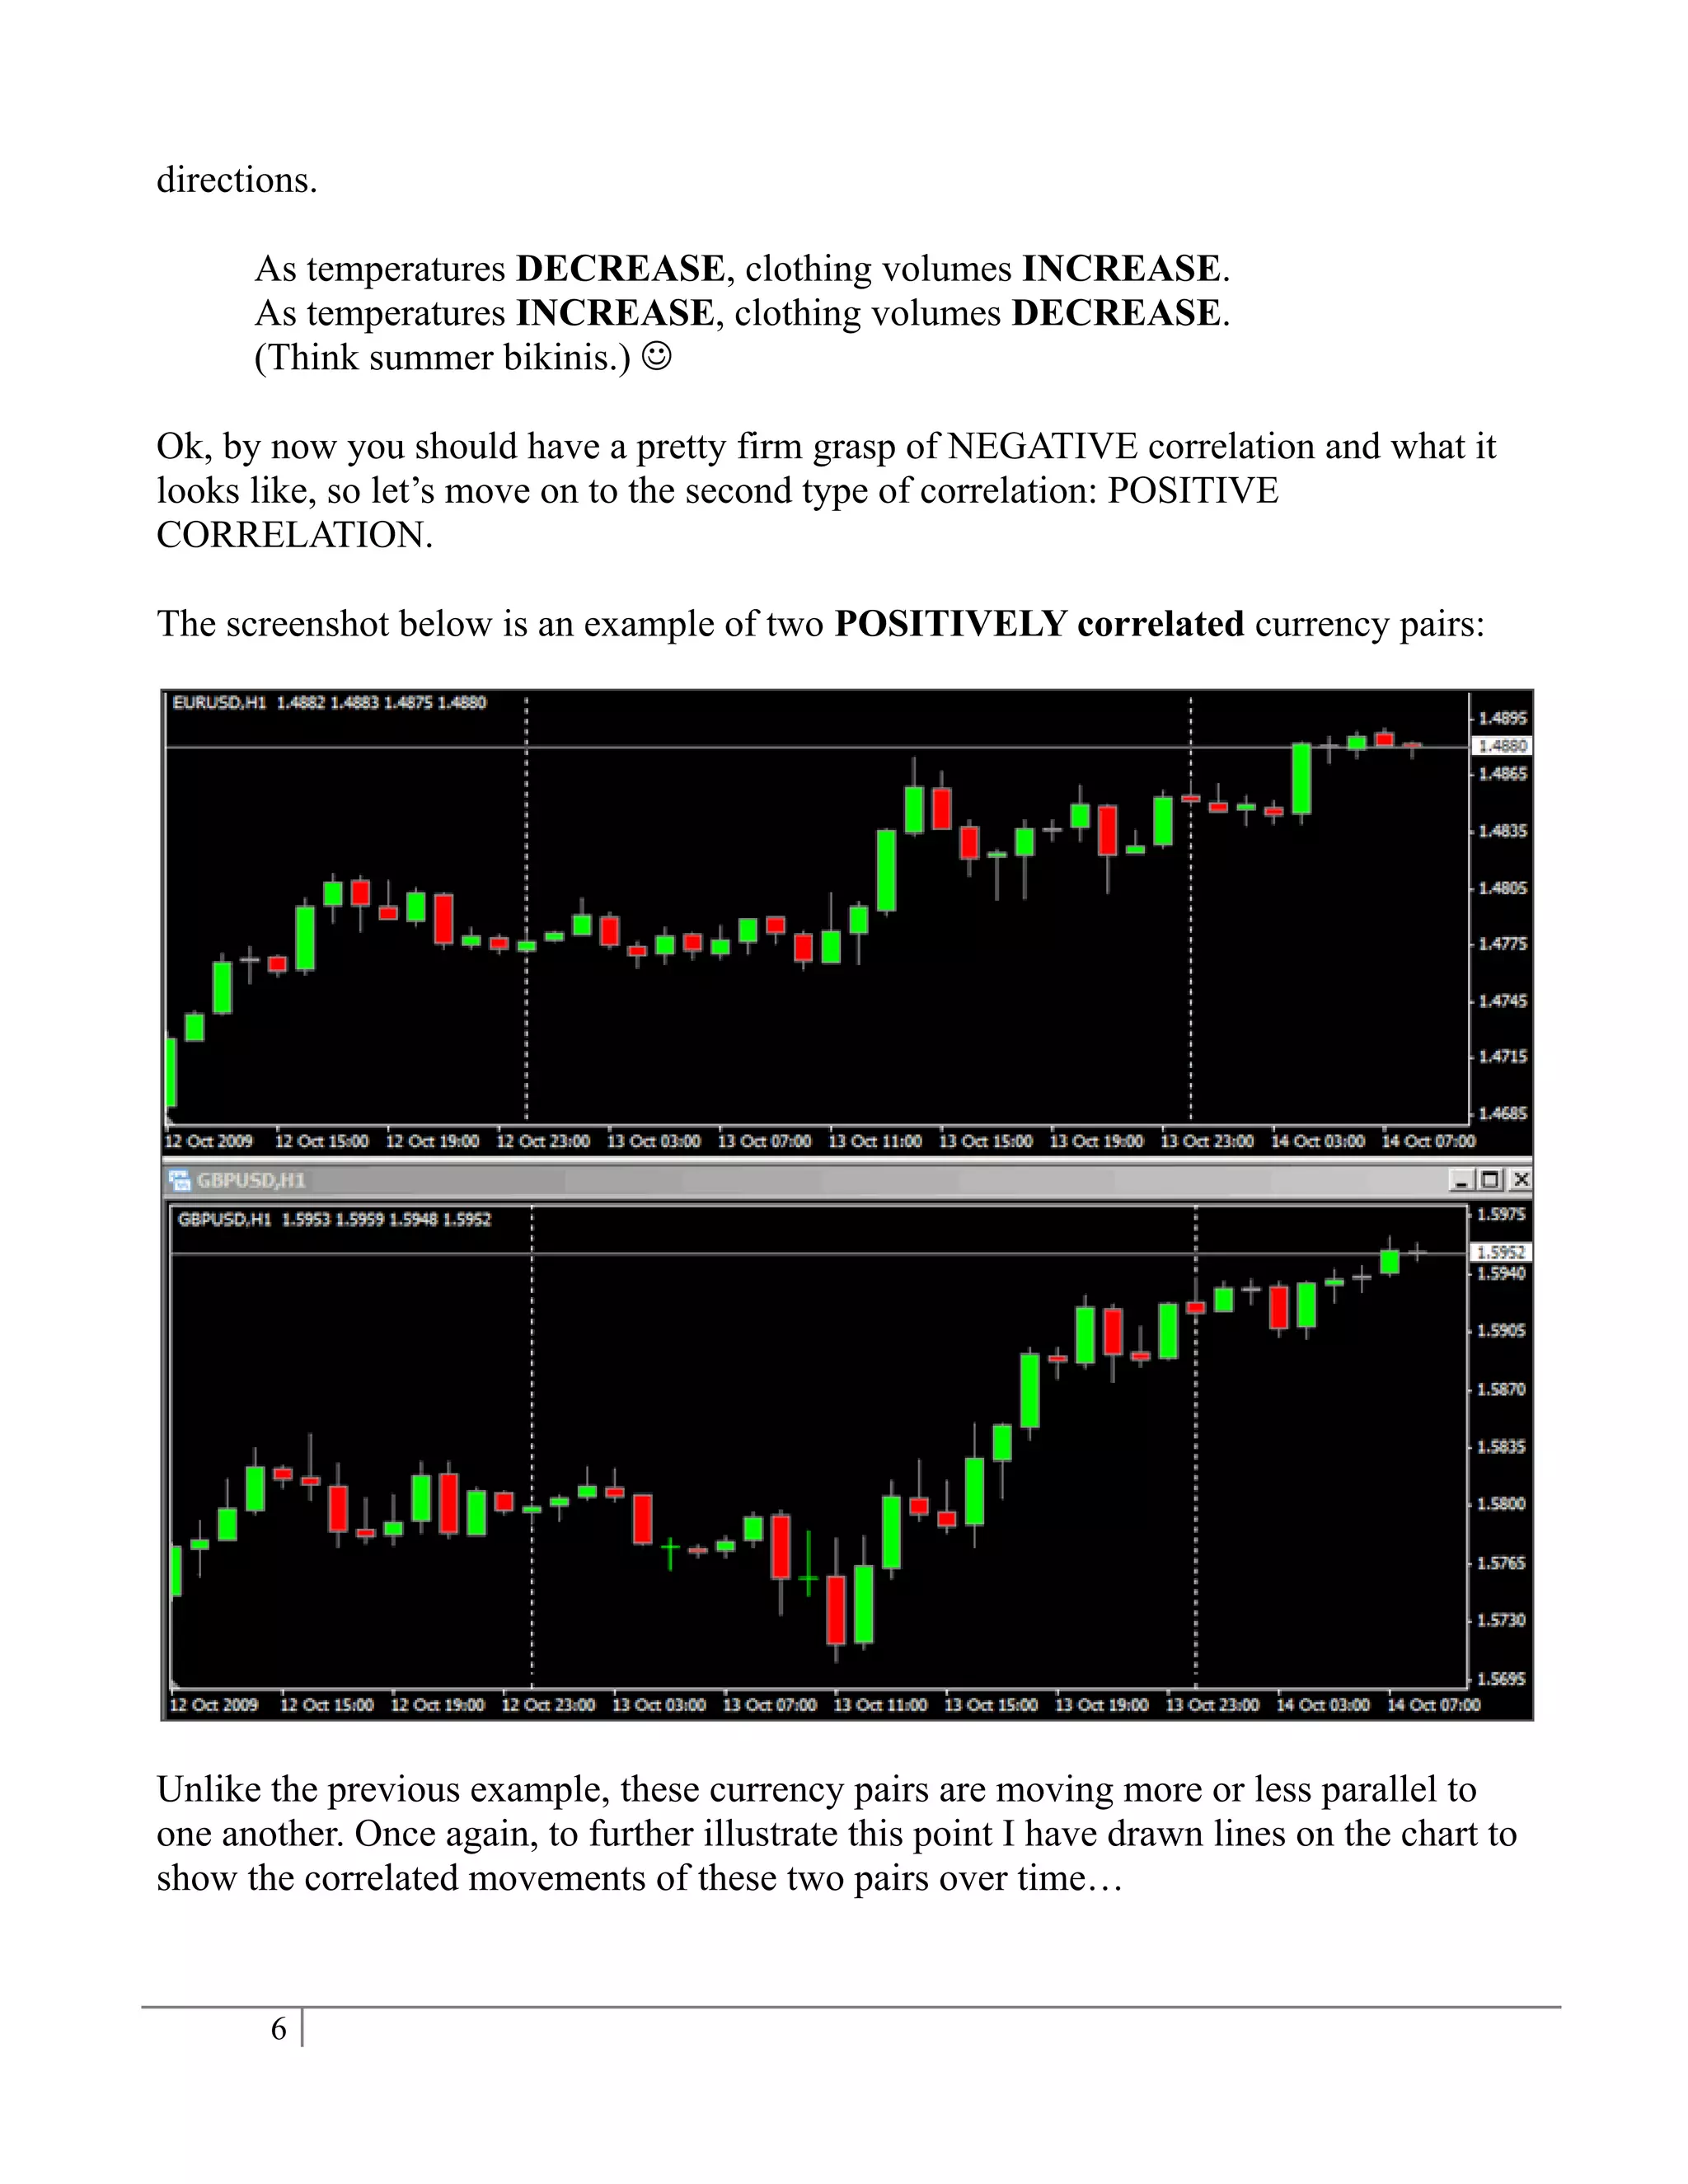
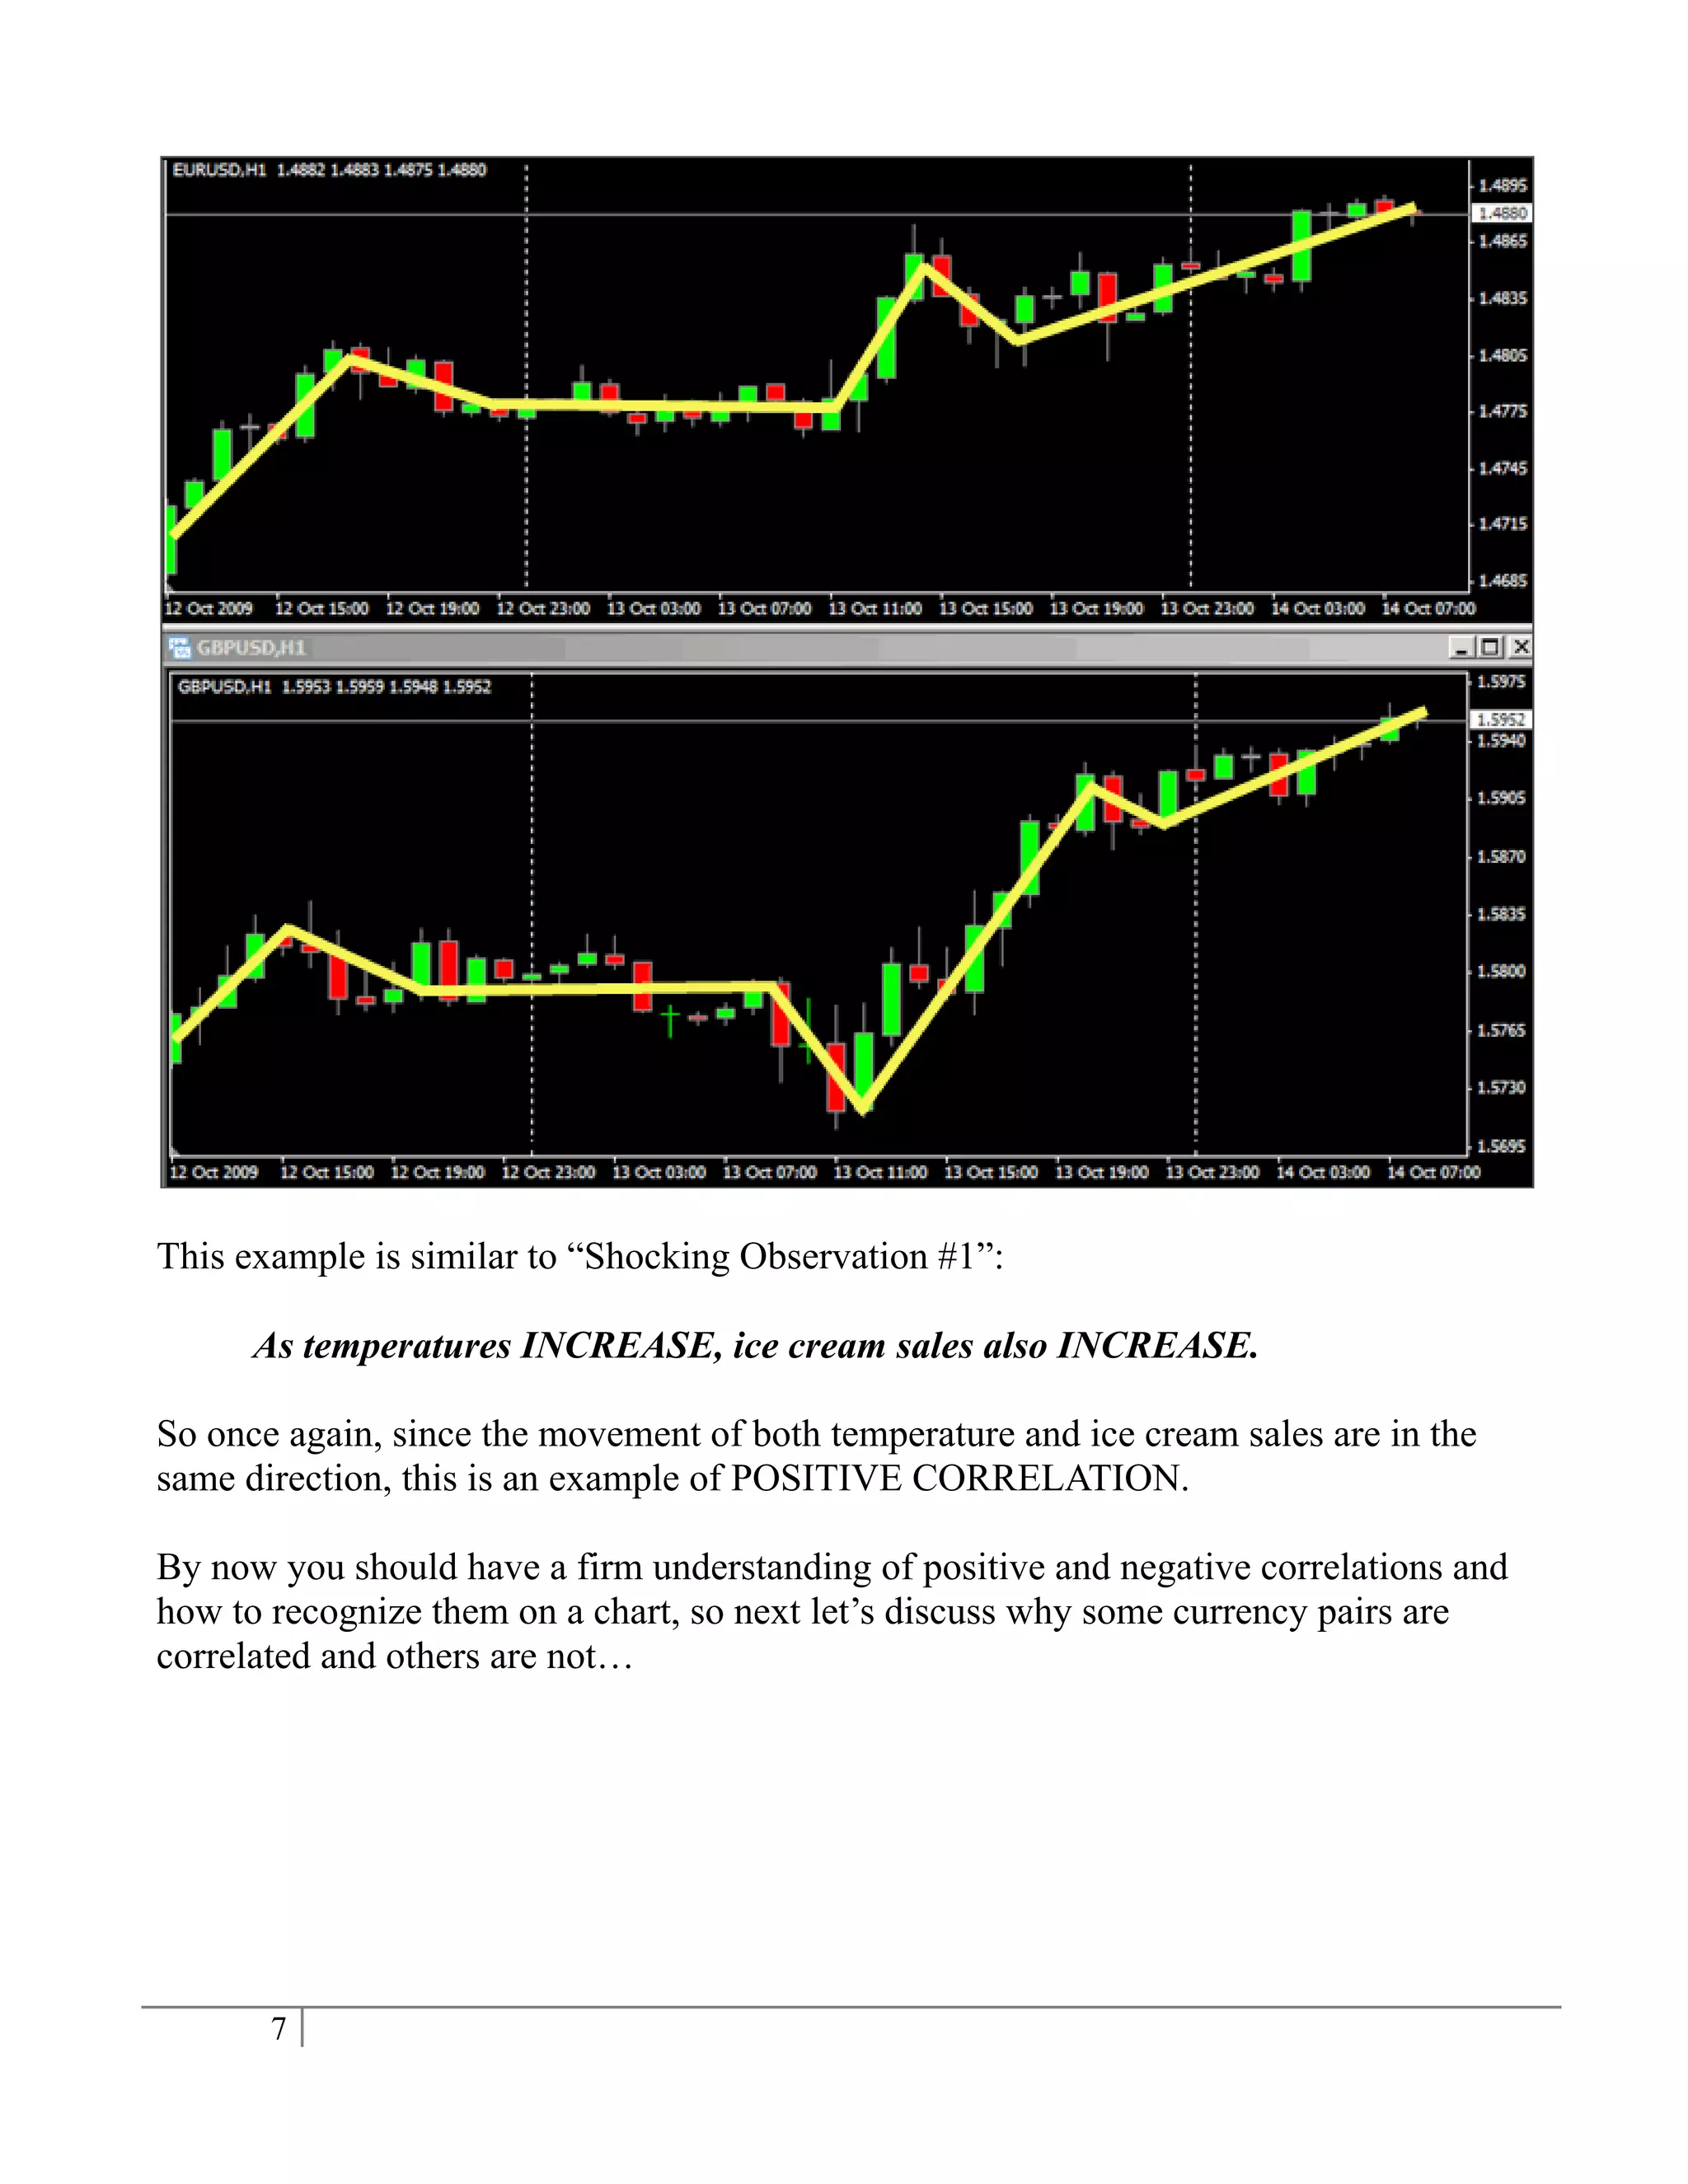
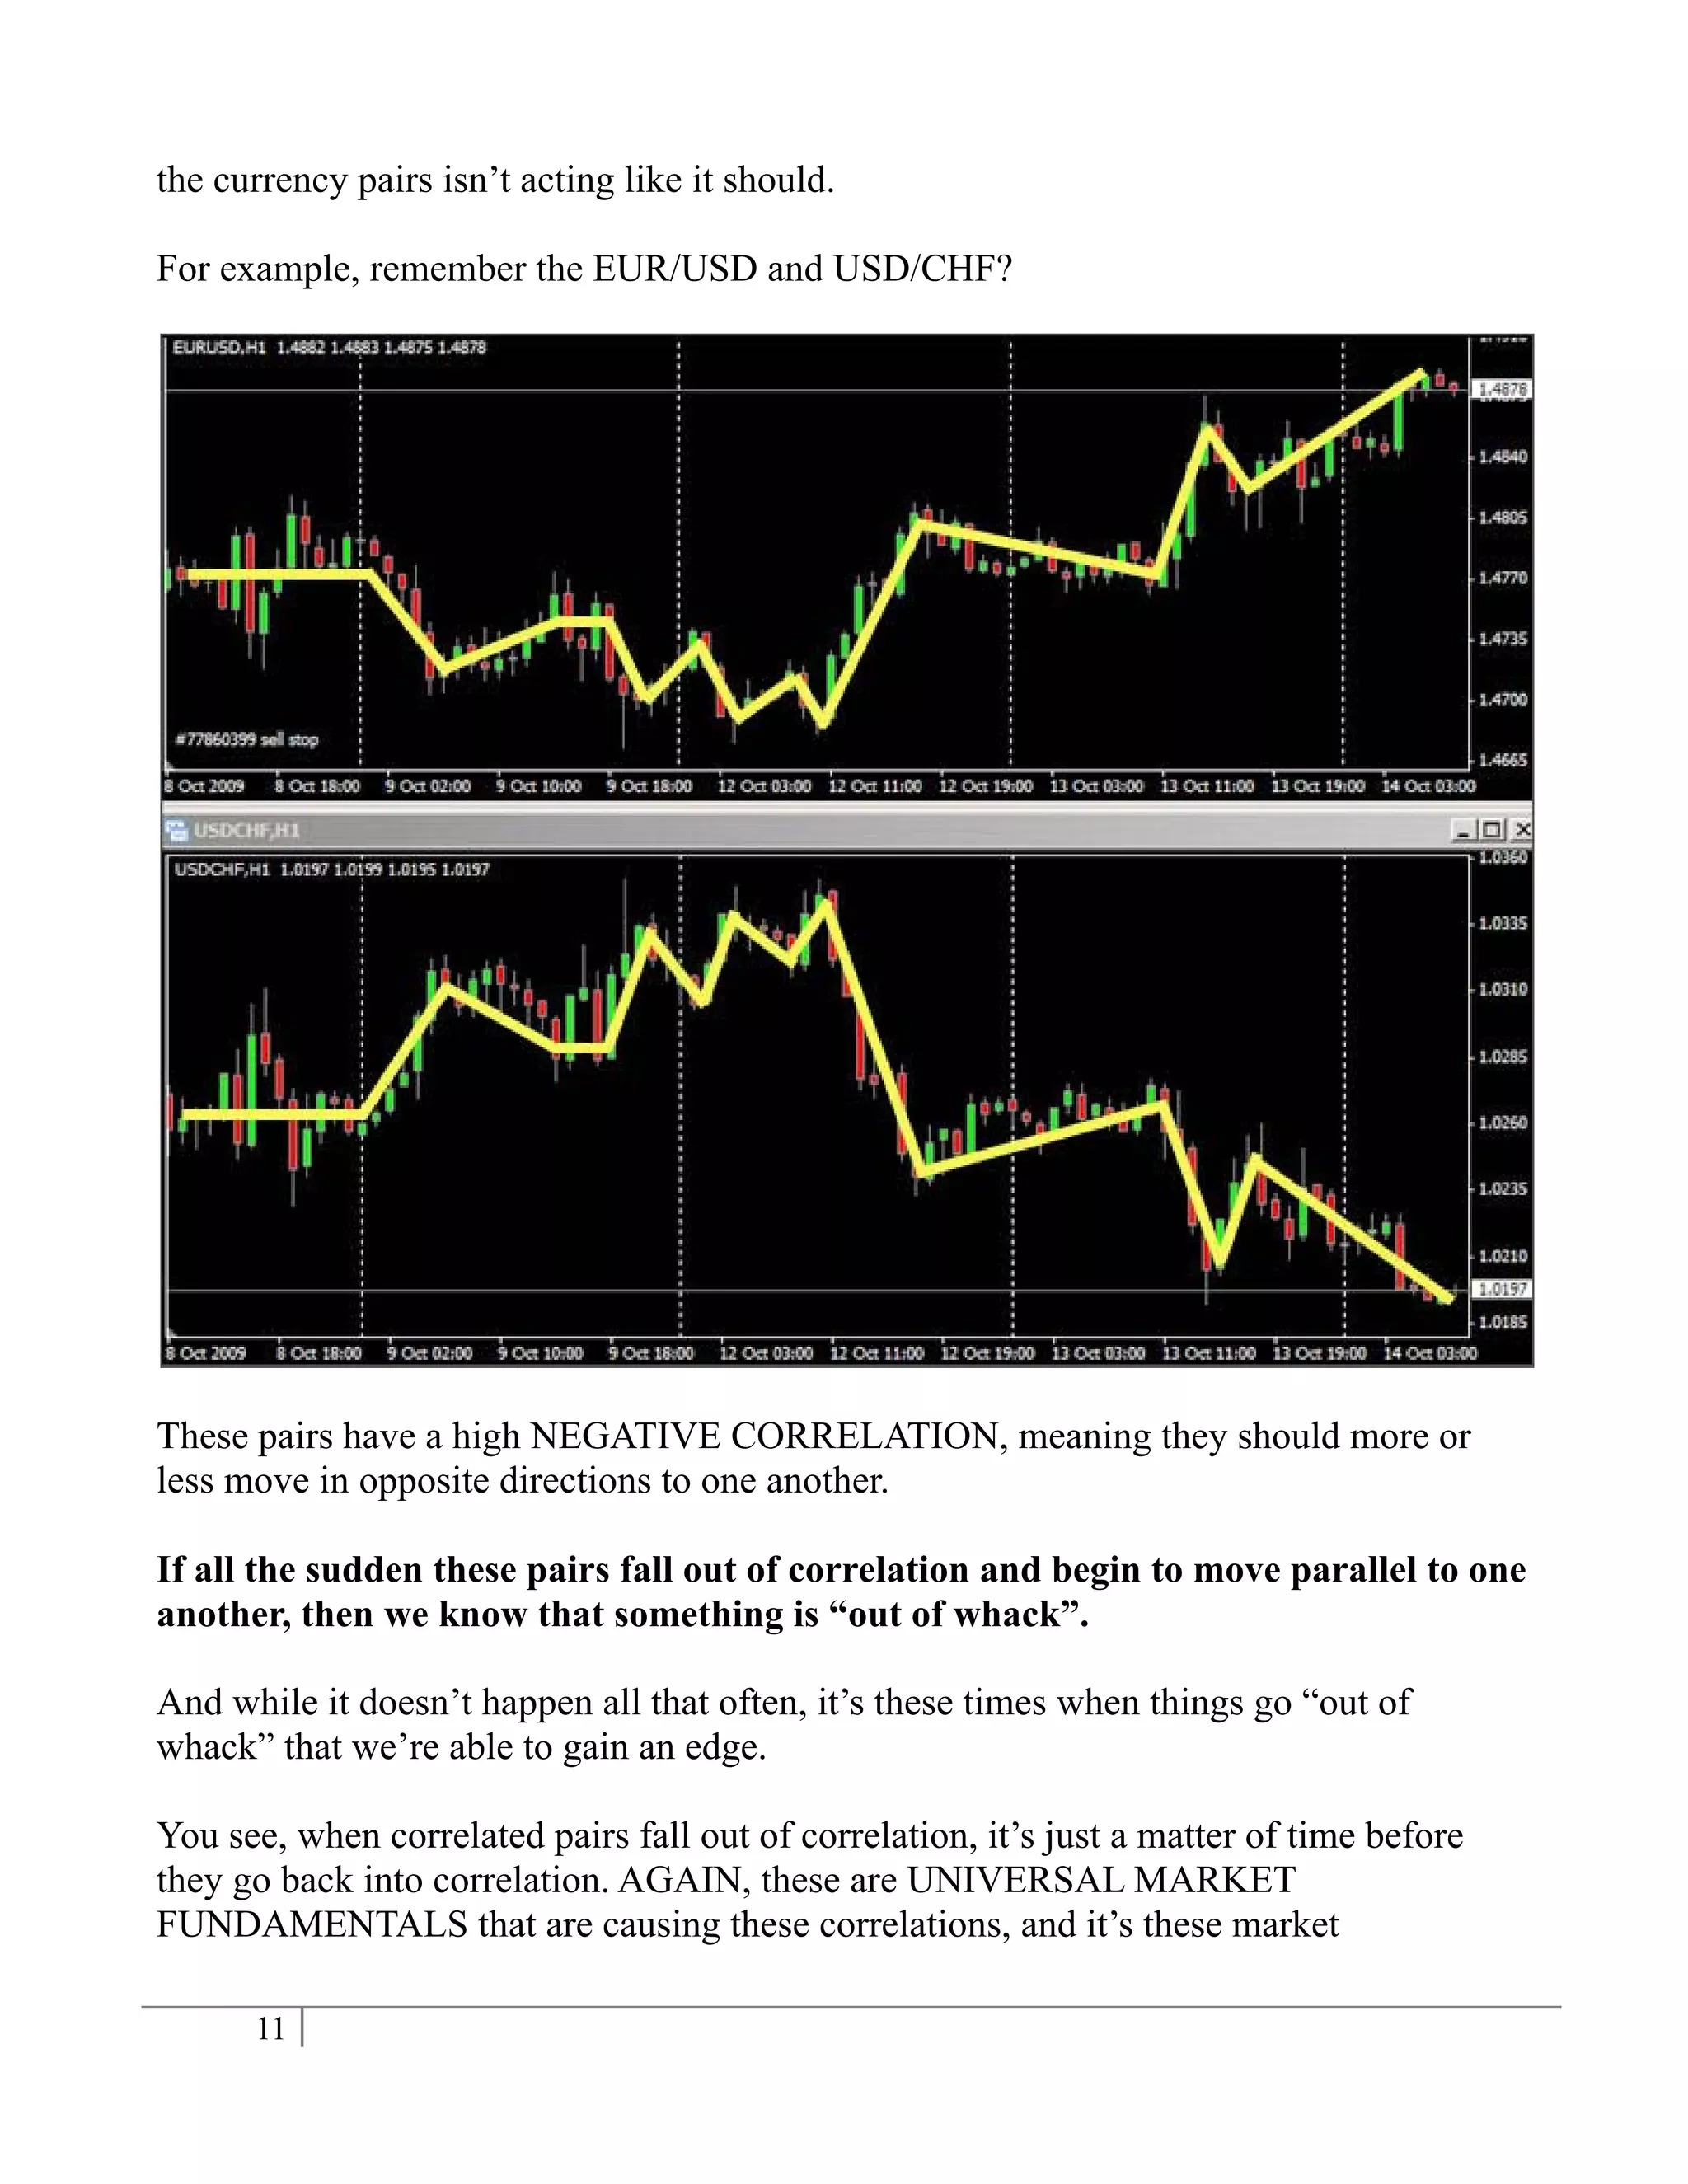
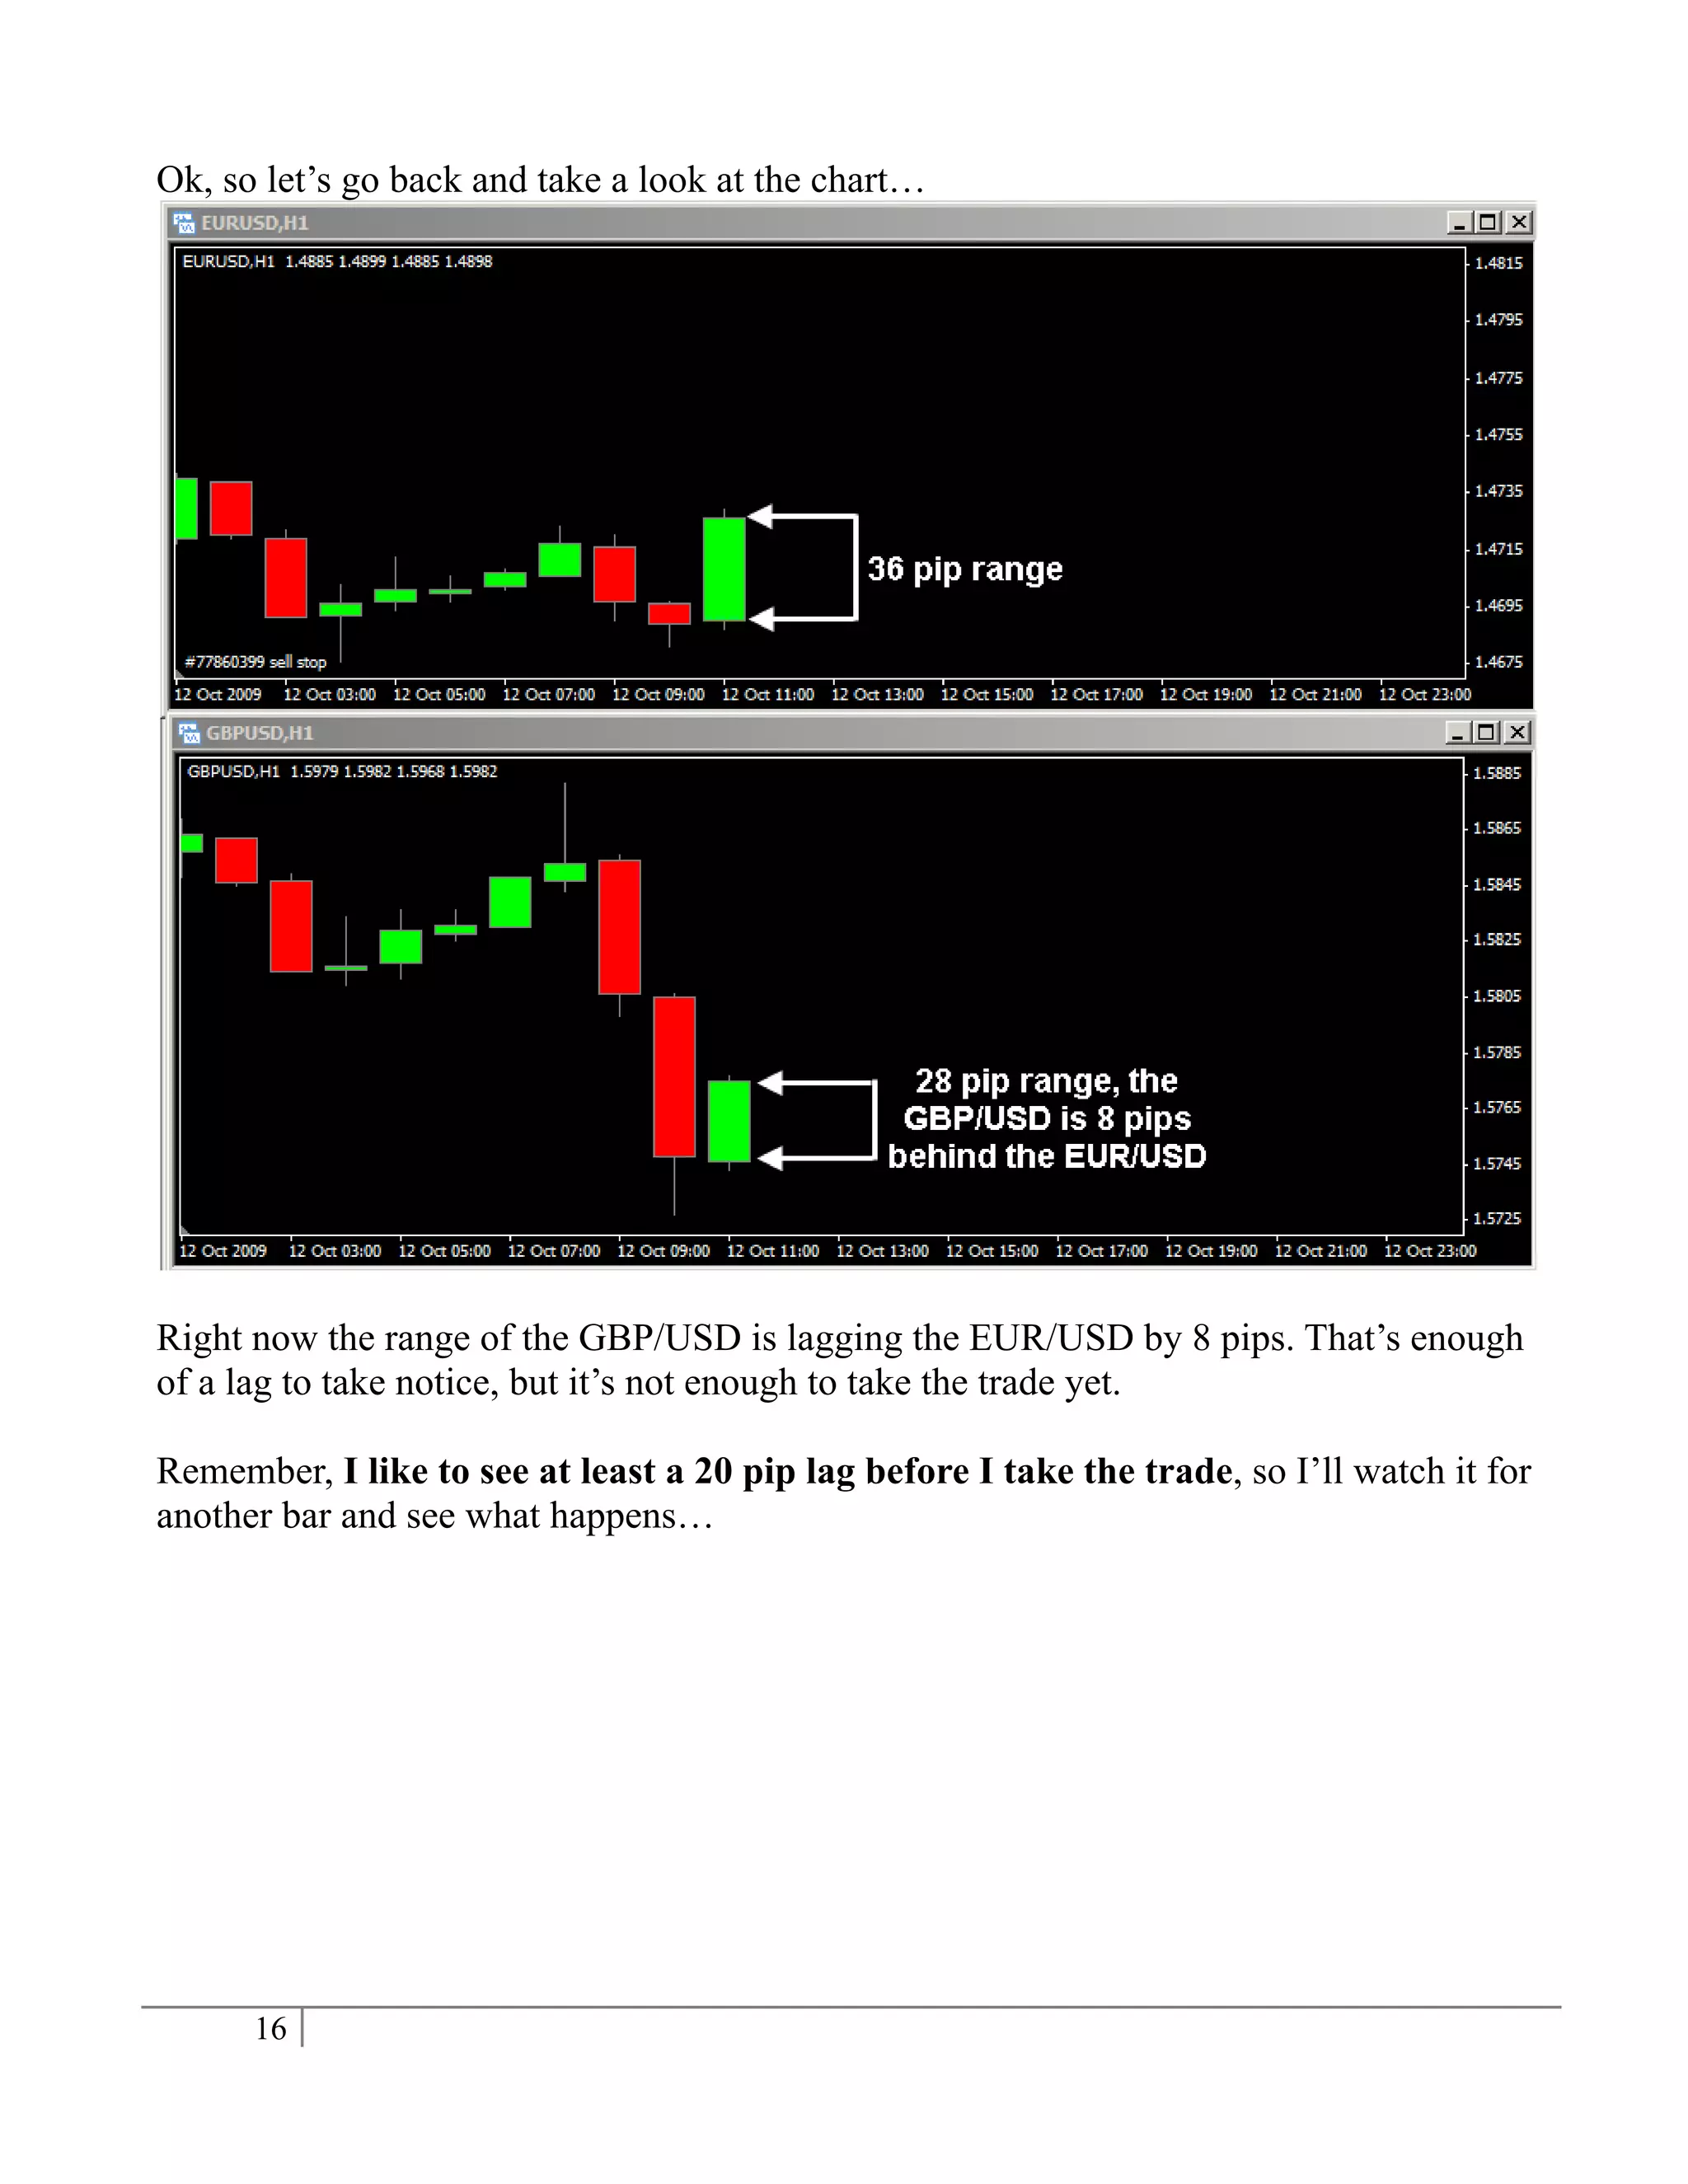
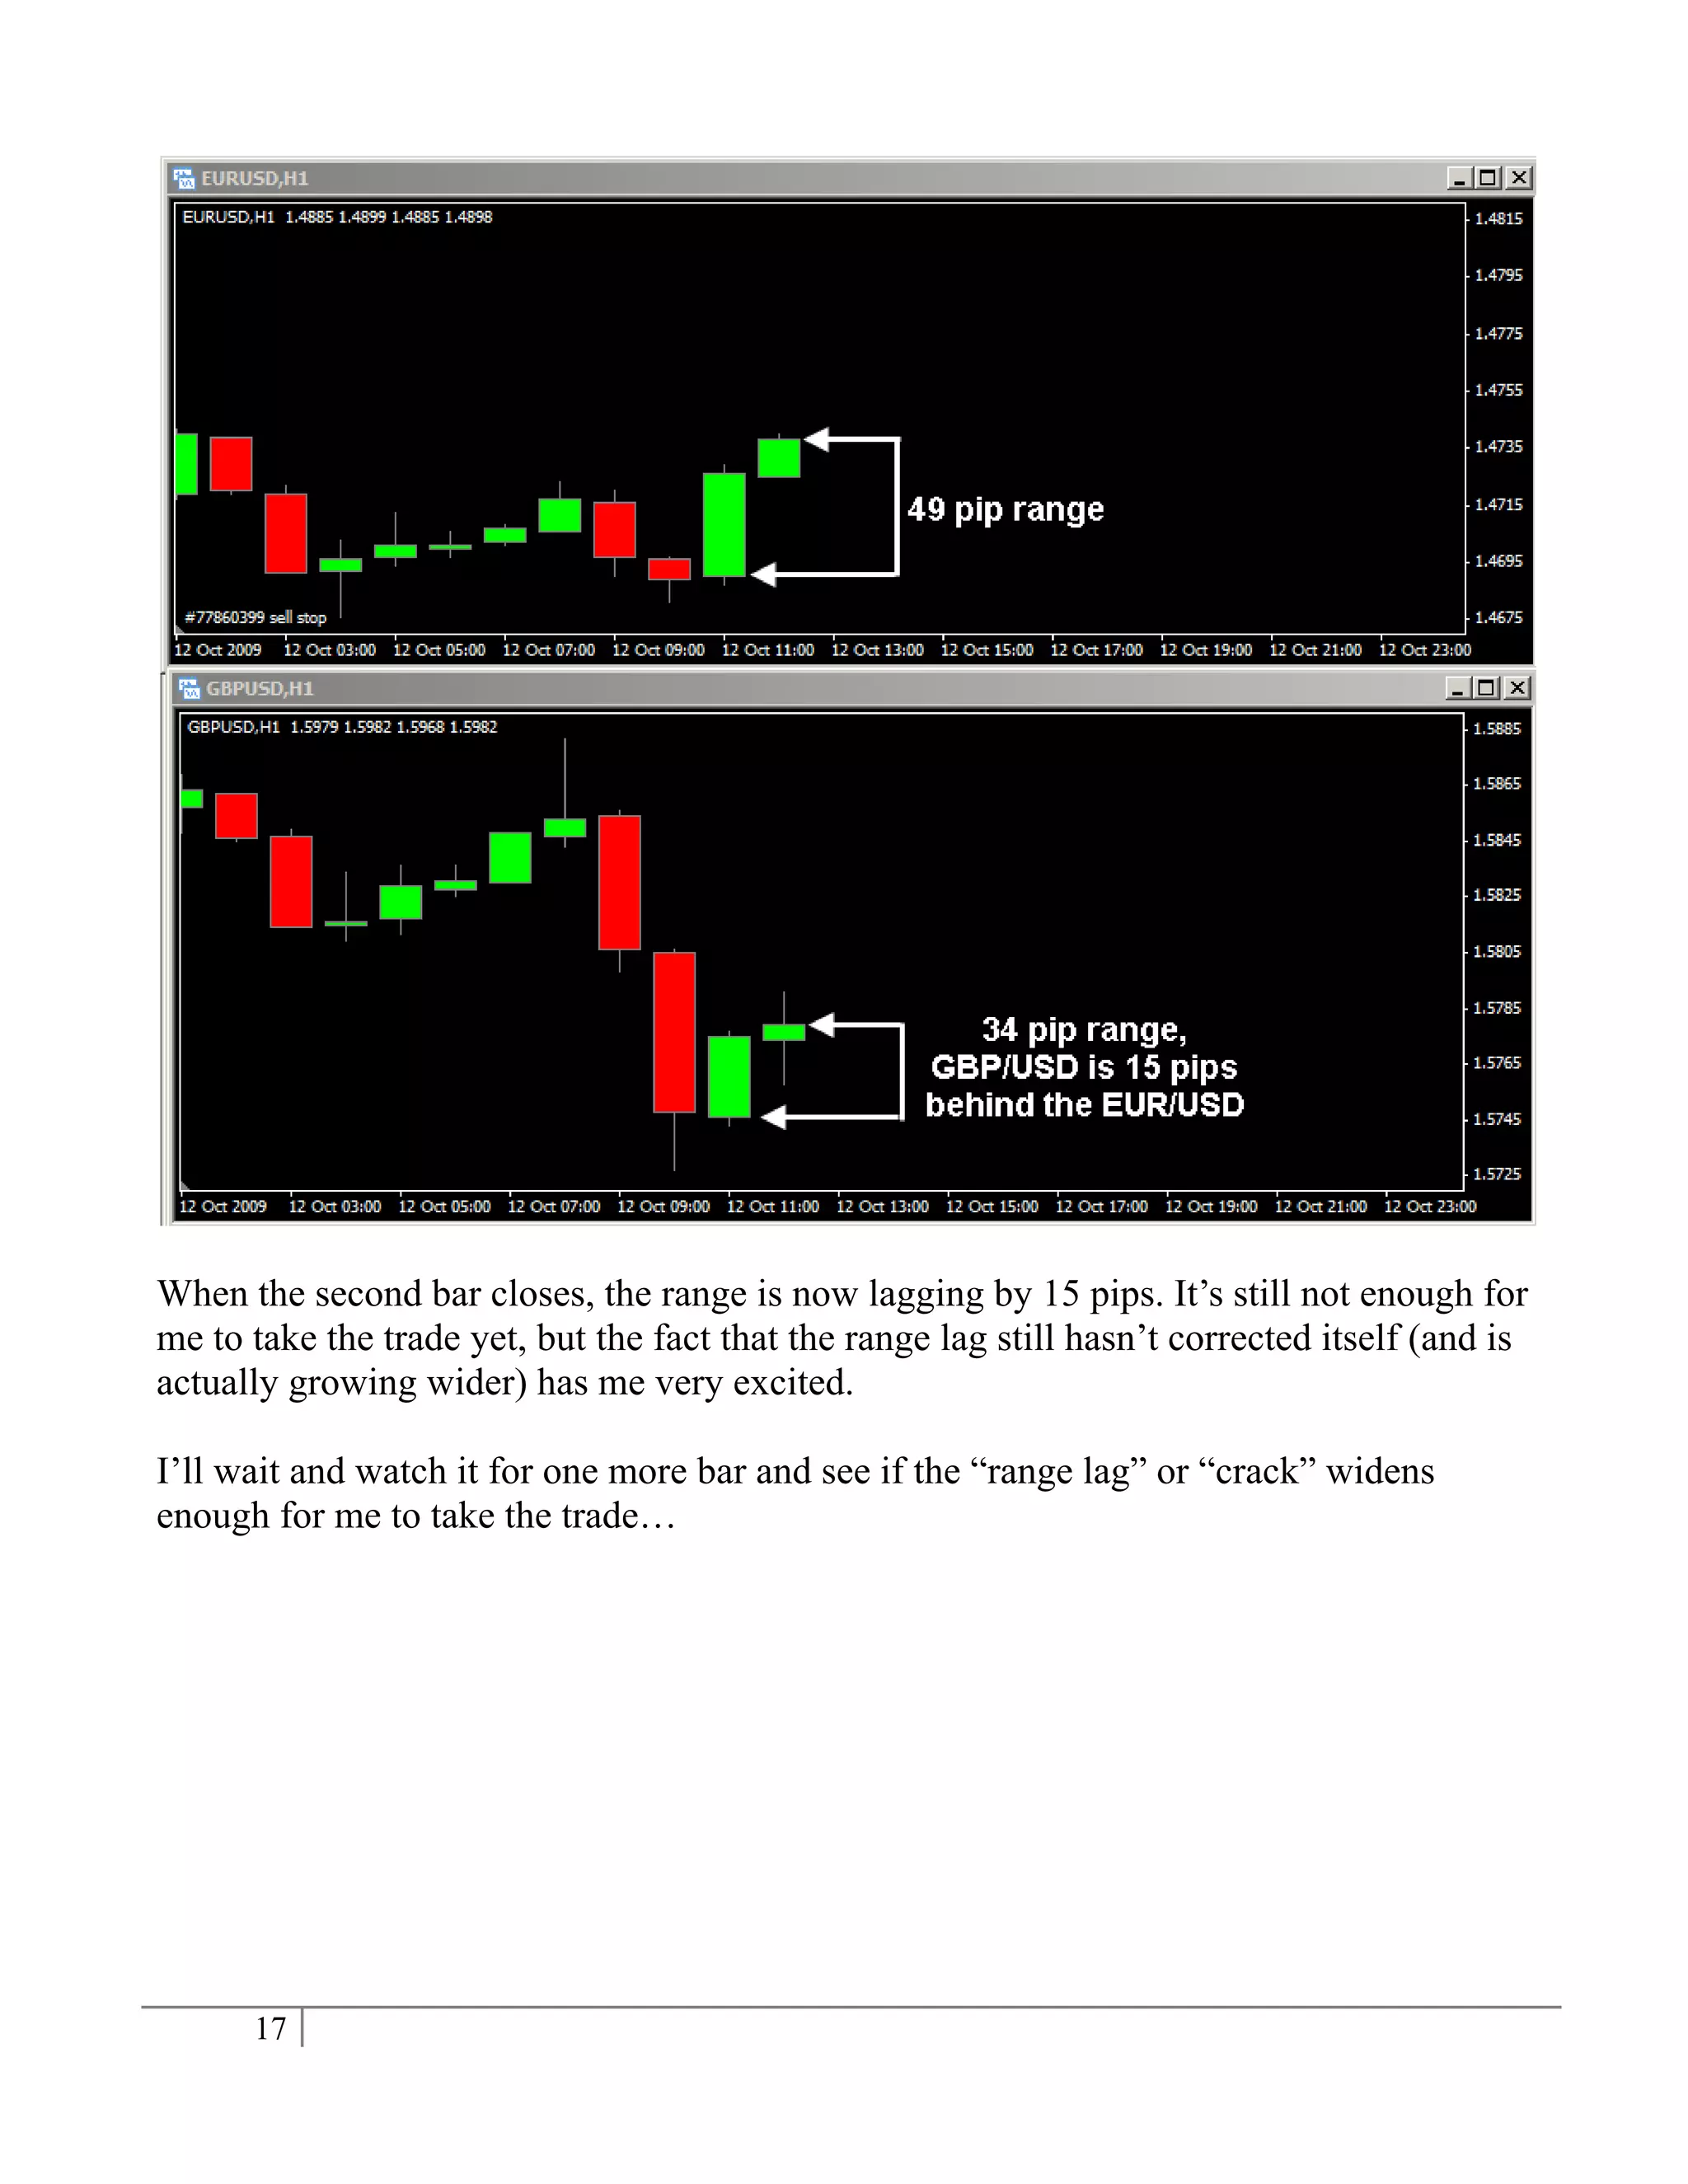
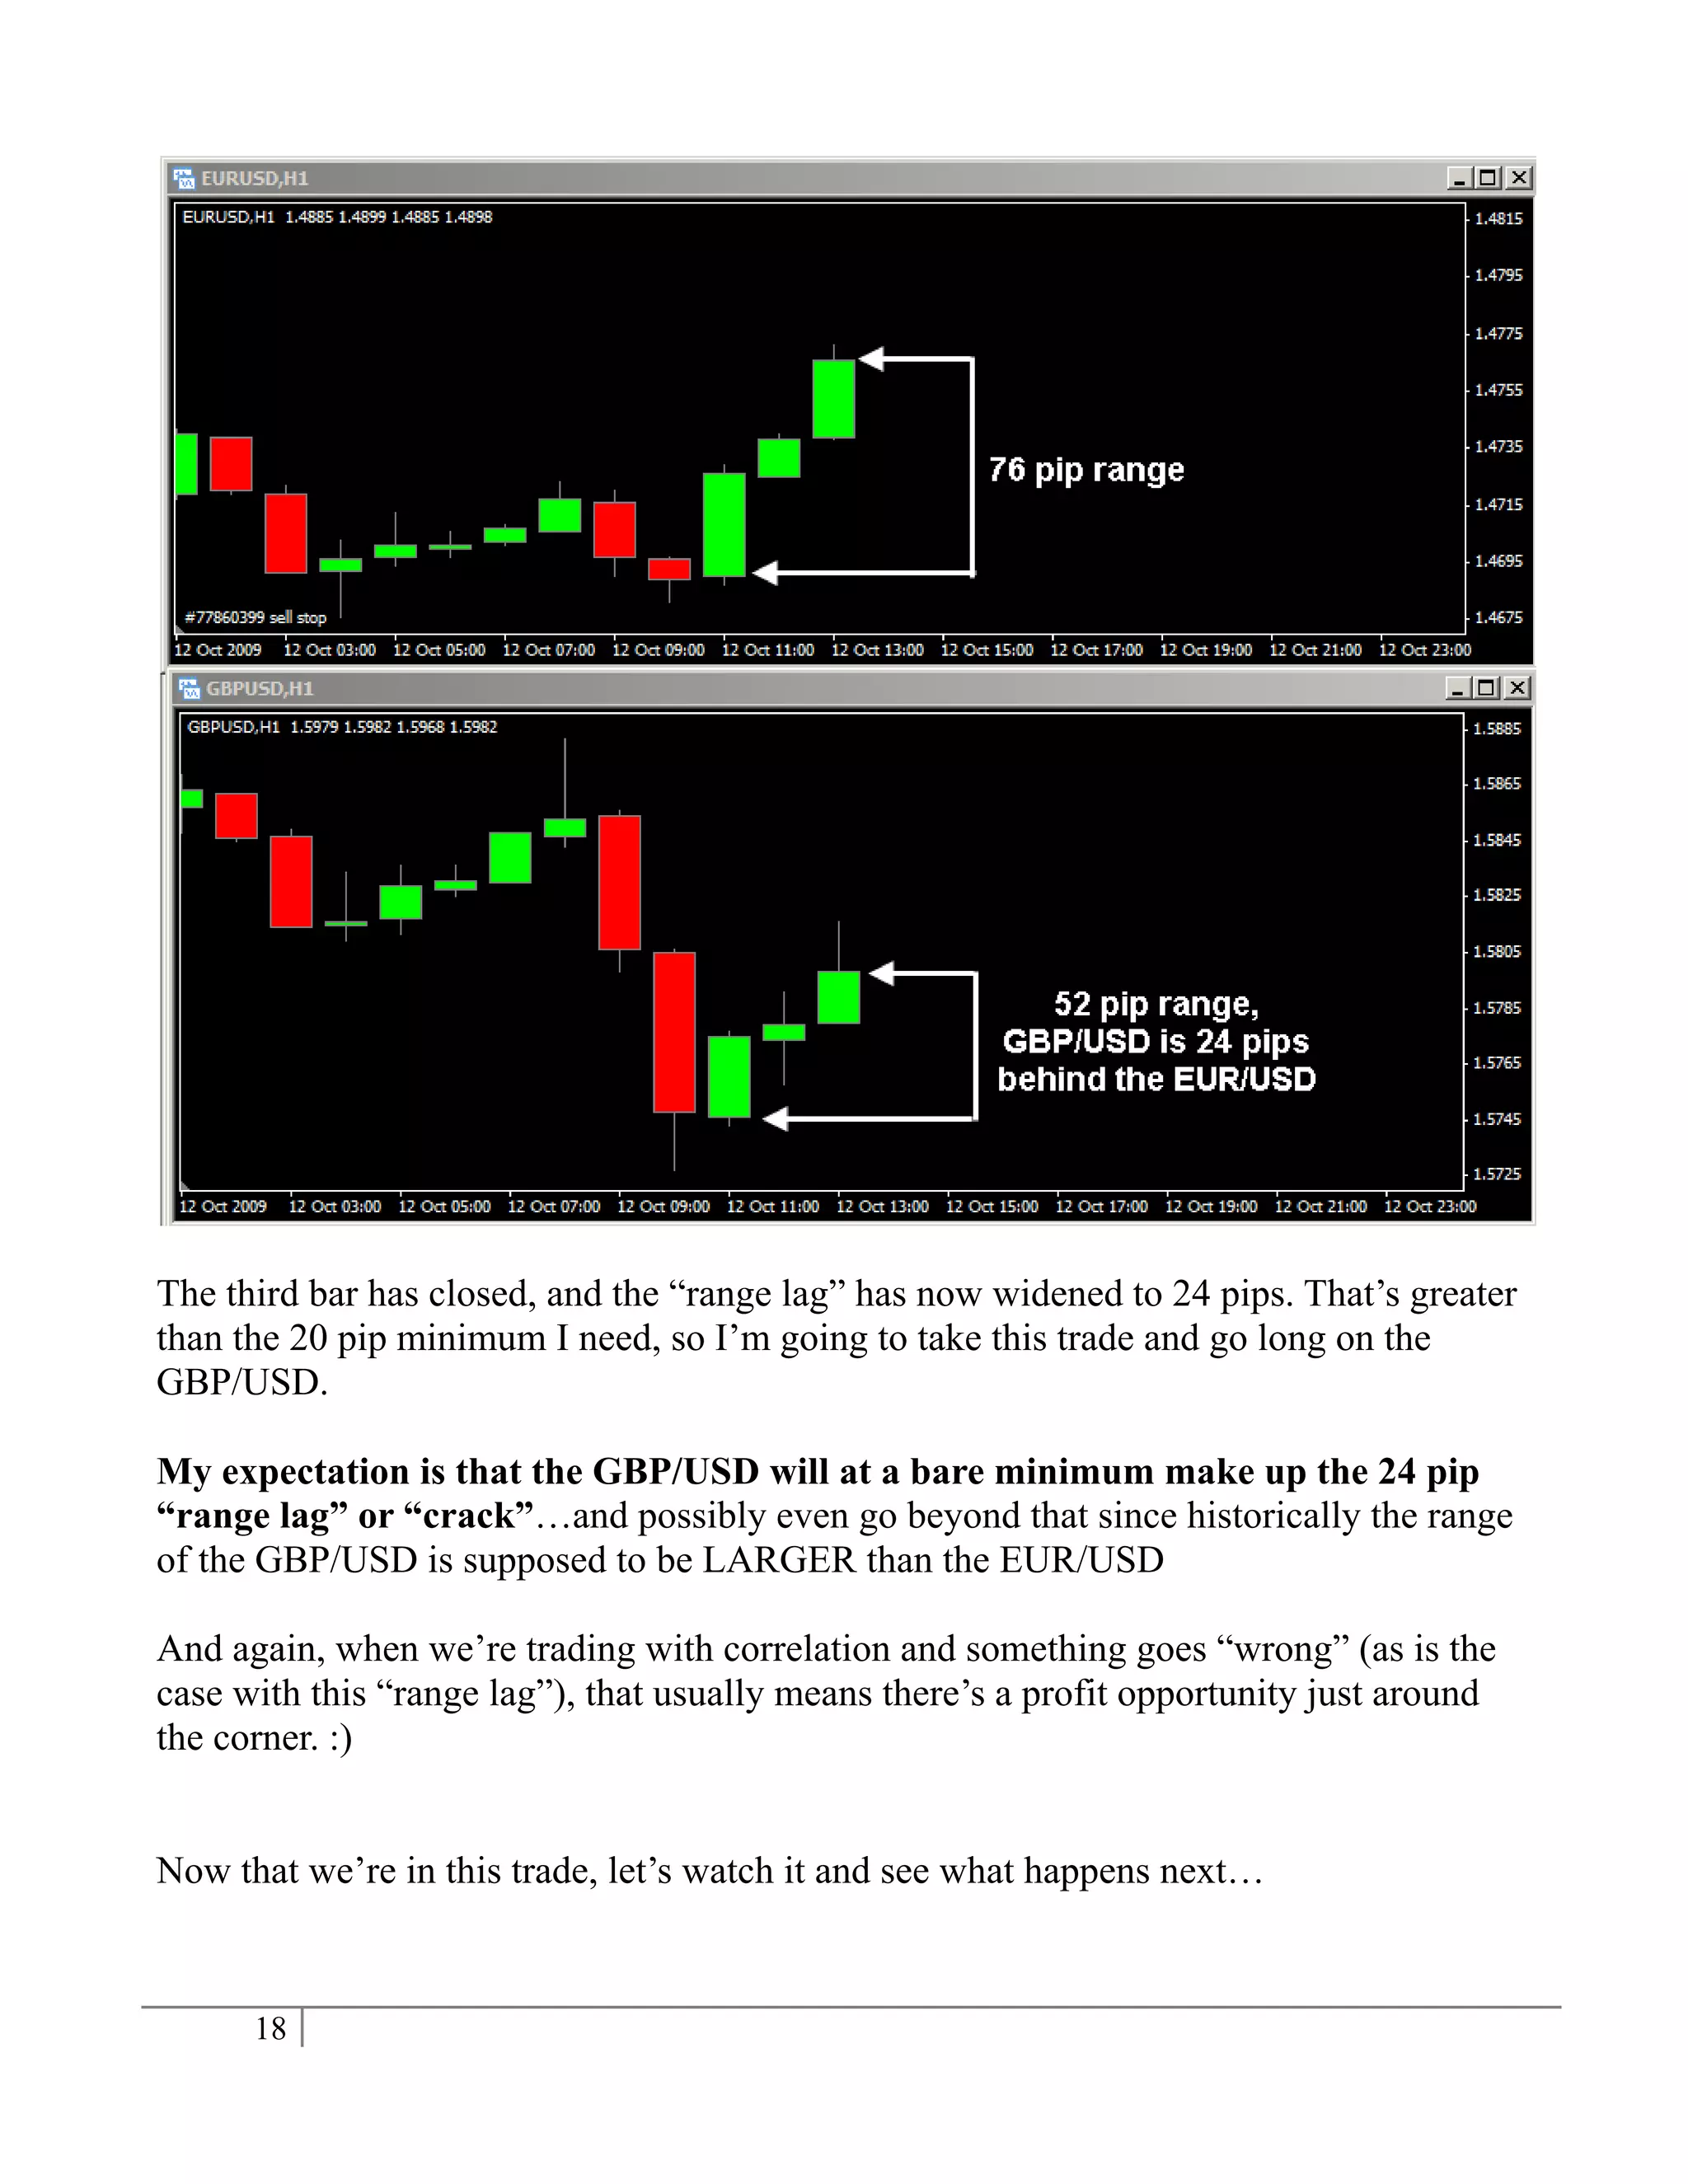
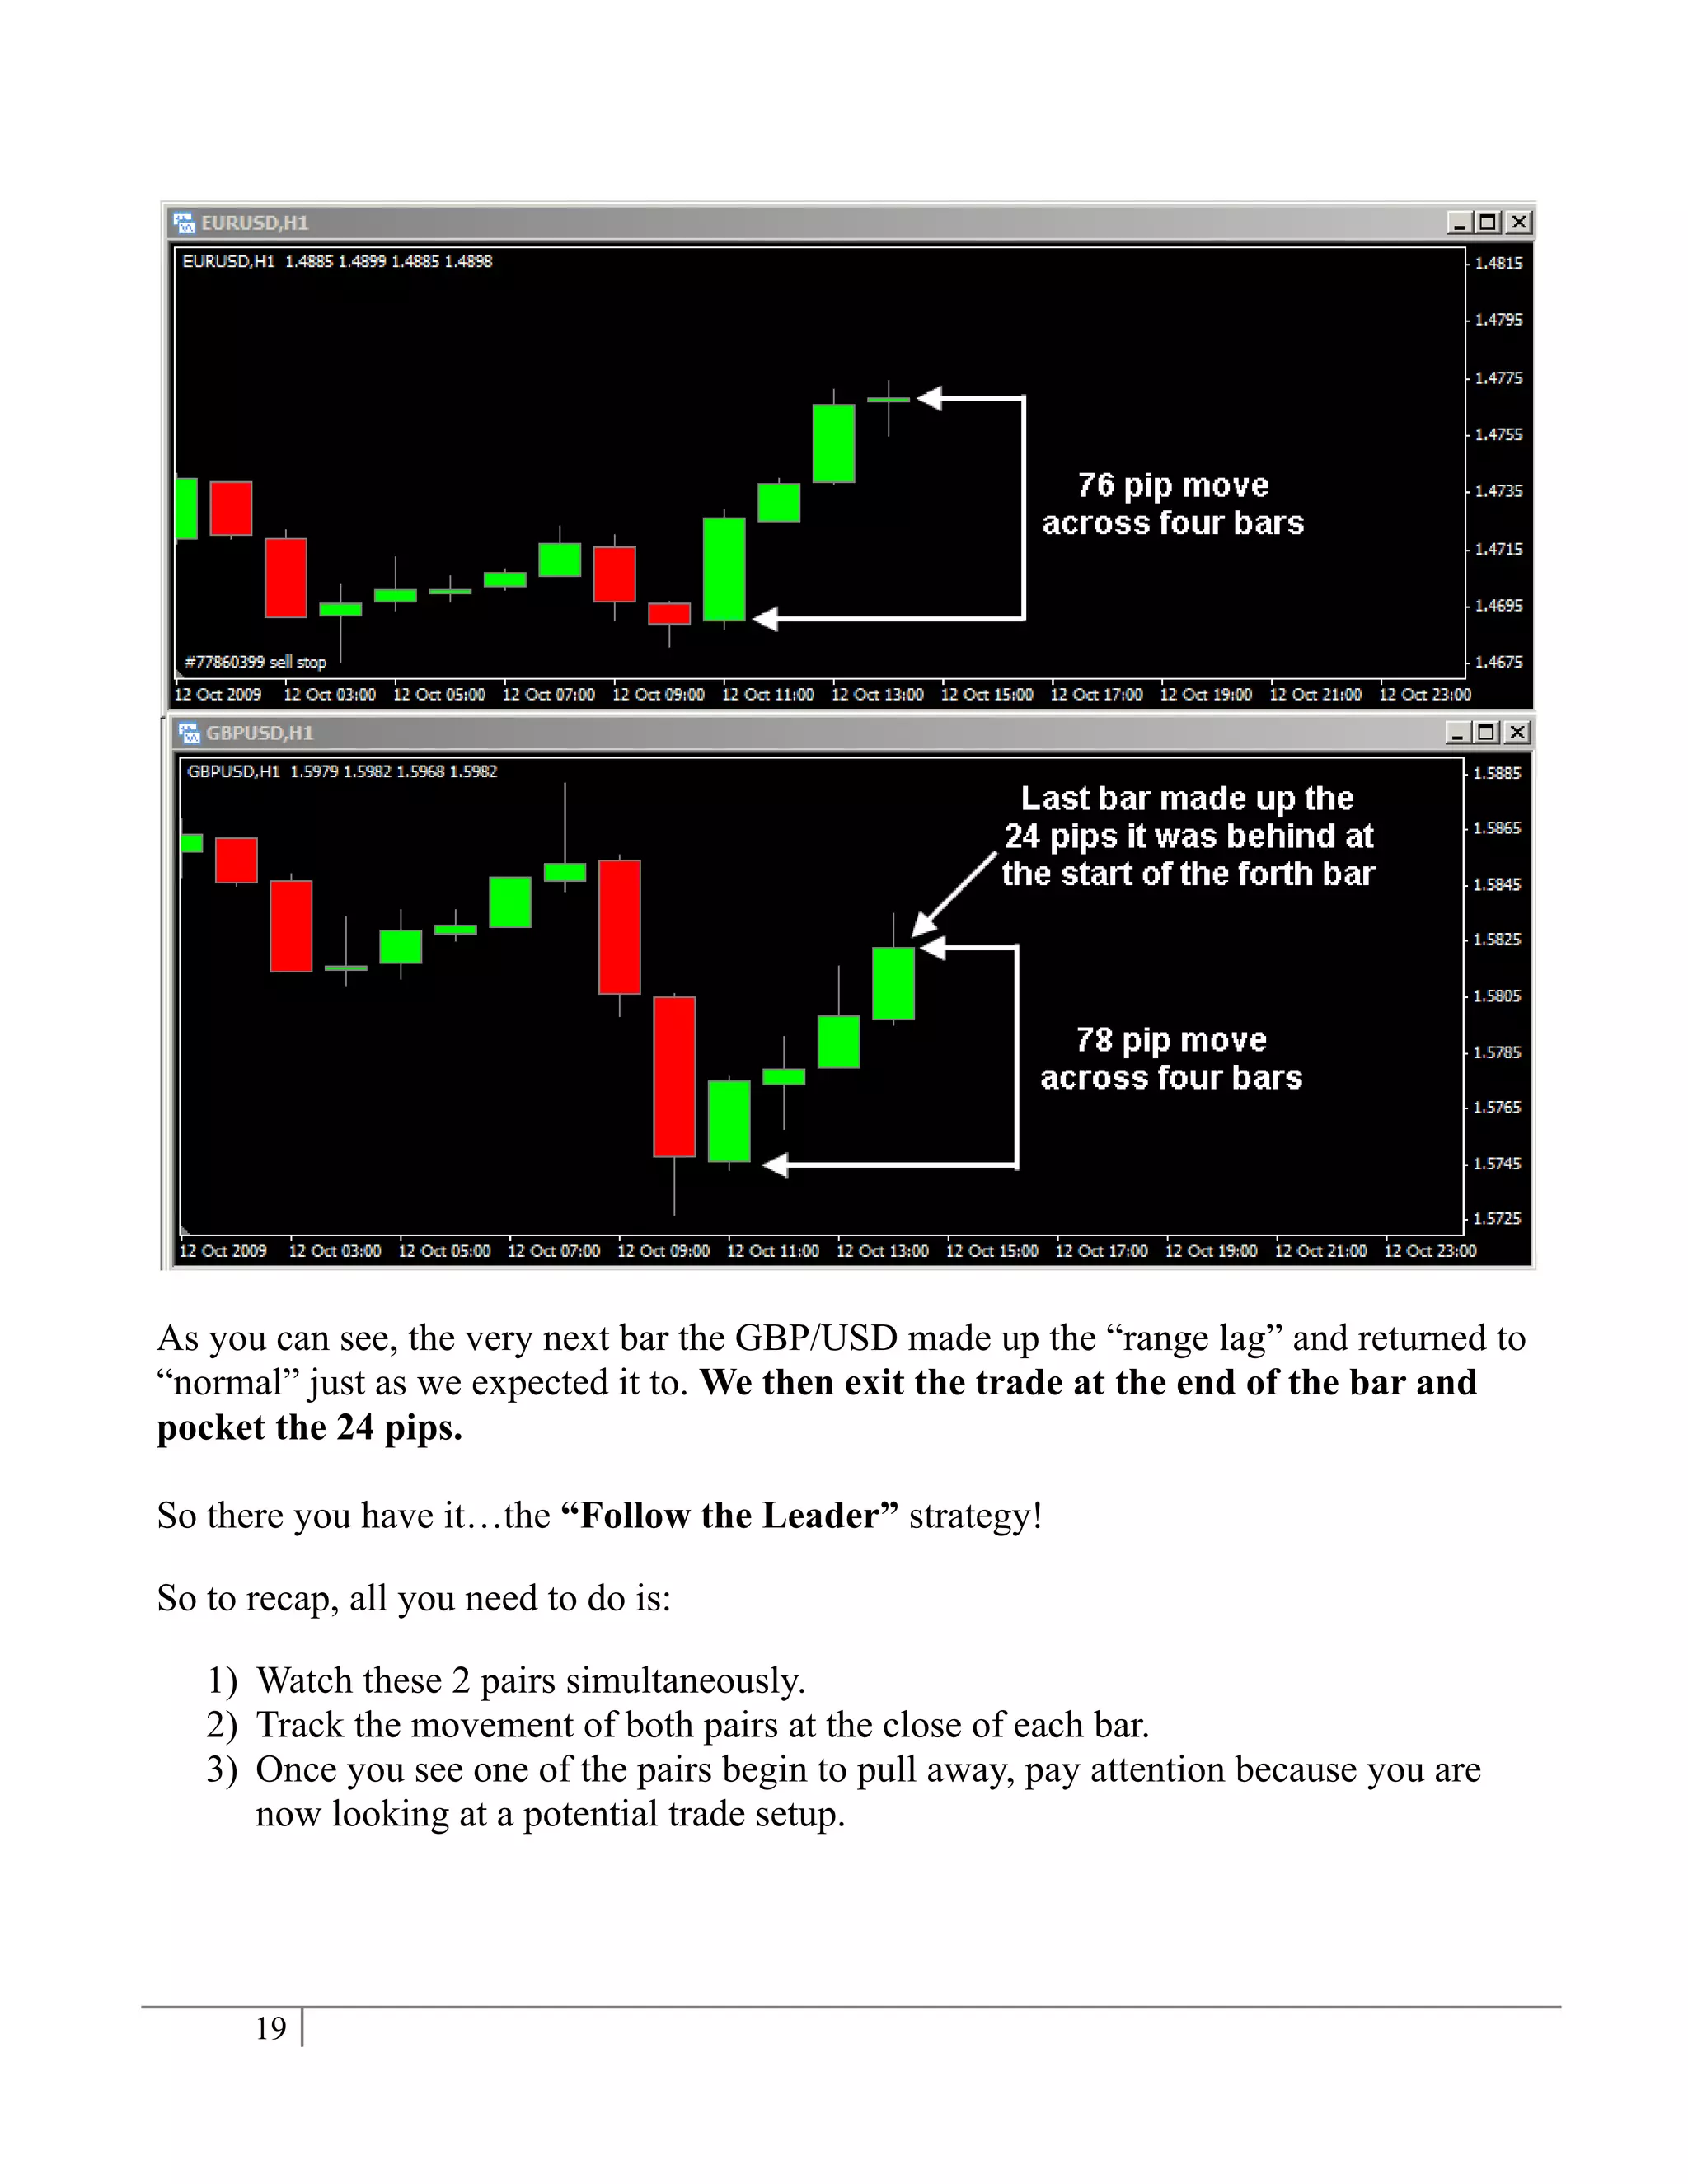
This document describes a trading strategy called "Follow the Leader" that capitalizes on correlated currency pairs. It explains that some currency pairs, like the EUR/USD and GBP/USD, typically move in the same direction due to shared fundamentals. The strategy looks for times when one currency pair's price range lags behind the other, indicating they have fallen out of correlation temporarily. It then enters a trade, betting the pair with the smaller range will catch up to match the larger range of the other, resulting in profitable movement back into correlation.
This document provides an overview of high probability trading setups for the currency market. It discusses the top 10 trading rules developed by the authors from years of observing currency price action. These rules are meant to keep traders grounded and out of harm's way. The document then outlines several high probability trading setups and strategies for both trending and counter-trend environments in the currency market.
Successful traders have disciplined habits and trading techniques that separate them from others. The key traits include having a clear objective, using a suitable trading system for their personality and risk tolerance, drawing a plan and strictly executing it, properly sizing positions based on risk level, being willing to accept losses, carefully recording all trades, taking responsibility for their own decisions, maintaining a learning attitude, believing in themselves and their system, periodically reviewing their system, and approaching trading like a game by following rules and strategies without emotional attachment to wins or losses. These traits allow successful traders to remain objective and consistent in their approach.
forex trading strategy that you can make money with. Can also be use by using your android and iphone metatrader.
The settings on the indicator are easy to setup. The strategy best time frame is h4 and hourly chart.
http://www.pipsumo.com/2017/04/parabolic-sar-trading-strategy.html
Japanese candlesticks are one of the most popular methods of the technical analysis. In this presentation, JustForex will teach you how to read Japanese candlesticks and trade according to it.
This document is the introduction to a book about forex trading. It outlines the contents of the book, which is divided into four parts. Part one covers basic forex concepts. Part two details eight forex trading strategies, including chart pattern trading and price rejection trading. Part three explains how to combine knowledge and strategies to achieve high performance trades with over 90% winning rates. Part four provides final advice for forex traders. The book aims to create a balanced system for having a solid trading strategy, managing risks, controlling emotions during trades, and maintaining discipline.
Many traders-beginners are sure, that success on Forex depends mainly on a trading strategy and risk management, and don't think about the psychological aspect of the trading. However, emotions may affect trading process very much. The psychology of the Forex trading really exists and it is one of the things that differs a successful trader from a losing one.
Top 8 Forex Trading Strategies That Pro Traders UseSyrous Pejman
In this slideshow find the best Forex trading strategies including chart patterns, price rejection, correlation trading, volume-price analysis, long term daily and weekly trading, news and sentiment trading strategies. Besides, you will learn the best money and risk management methods and also the best advice by the experts to control your psychology during your trades.
https://www.fiverr.com/mastermentor/teach-you-forex-trading-in-1-hour
Simple and Easy way to learn Forex from a Pro Trader. Follow this guide and learn how to trade forex in an easy and fast manner. Becoming a succesful trader is just minutes away!
Learn step by step easy to follow video course below:
https://www.fiverr.com/mastermentor/teach-you-forex-trading-in-1-hour
This document provides an overview of supply and demand trading strategies. It begins with an introduction and disclaimer about the risks of trading. It then discusses key concepts like identifying trends on charts, drawing trendlines, and understanding retracements and reversals. The document focuses on explaining supply and demand zones, how to identify and draw them on charts, and how to develop a trading strategy around high probability supply and demand zones. It emphasizes the importance of risk management strategies like stop losses and position sizing. The goal is to provide readers with the fundamental tools and framework to execute a supply and demand trading approach.
“Forex Trading Strategies” is a complete guide of most popular and widely used strategies in Forex trade. You can read about day trading and its main types, understand the strategies based on market analysis, learn about portfolio and algorithmic trading, and many more. The book represents the ins and outs of each strategy - why and how it is used and how to get profit from trade. It is suitable for all traders who are novice in trade or want to improve their skills. All the strategies classified and explained here are for educational purposes and can be applied by each trader in a different way.
Trading Psychology: 5 Critical Lessons From Pro Traders That You Should Know.Reach Markets
Successful traders have the ability to develop a solid plan and have the mental focus to stick to it over time.
Achieving your goals can be helped by following the path set by someone successful.
These 5 quotes are meaningful pieces of advice from successful traders, which can help you improve your decision making and trading psychology.
The document discusses forex trading and provides information on:
1) The forex market is the largest financial market in the world with over $4 trillion traded daily. It is accessible to individuals via the internet and allows trading of major currencies 24/5.
2) Compared to stock trading, forex trading offers advantages like 24/7 accessibility, no commissions, ability to short sell without restrictions, and higher leverage of 400:1.
3) The most heavily traded currency pairs are EUR/USD, USD/JPY, GBP/USD, and USD/CHF. The US dollar is the most traded currency, comprising about 83.7% of forex trading.
This document introduces a forex trading strategy using the MACD indicator on a 4-hour timeframe. It describes the strategy's focus on simplicity and high probability trades. Figures 1-3 are included to illustrate past trade signals and results, with Figure 1 showing 14 signals over 5 weeks that produced good results. The strategy aims for 95% accuracy by filtering for the best MACD signals. Setup instructions are provided for the MACD settings and moving averages to use on charts. Common MACD patterns that signal high probability trades are explained, such as heads and shoulders and rounding tops and bottoms.
This document introduces the MagicBreakout forex trading strategy. It is summarized as follows:
1) The strategy aims to enter the market before breakouts occur by using the CCI indicator to signal when to enter trades. This allows traders to enter positions before the crowd of momentum traders.
2) Detailed rules are provided for both entry and exit including identifying trends using EMAs, setting entry criteria using CCI crossovers, and taking profits and stops using Fibonacci retracement levels.
3) Following the strategy and strict money management is touted as the key to achieving consistent profits that grow exponentially over time. Additional paid strategies and software are promoted as helping automate the system.
The document discusses the benefits of exercise for mental health. Regular physical activity can help reduce anxiety and depression and improve mood and cognitive functioning. Exercise boosts blood flow, releases endorphins, and promotes changes in the brain which help regulate emotions and stress levels.
By www.ProfitableTradingTips.com
Scalping in Day Trading
Traders who engage in rapid momentum trades are often scalping in day trading. These traders make their profit from the difference between bid and ask prices. Even in a flat market traders can profit from scalping in day trading. In order to successfully make a business out of scalping in day trading the trader needs to pay close attention to the market, always be aware of market fundamentals, and keep abreast of technical analysis. Despite the theoretical possibility of trading in an absolutely flat market the price of a stock constantly moves to some degree throughout the trading day. Thus when scalping in day trading one acts as a mini trend trader as well.
In and Out of Positions in a Hurry
There is a rhythm to scalping in day trading and it is fast. Traders seek to profit from the actions of traders to simply take the bid and ask prices of a stock. This strategy guarantees a profit if the trader acts quickly. It can result in losses if the stock price moves too quickly. As an example, Xyz Corporation has a bid price of $10.10 and ask price of $10.15. If the scalper can buy at the bid price and sell at the ask price he gains $0.05 per share, a small amount but a lot if repeated many times throughout the day. However, the market might move lower before he can complete his trade. Let’s say that the stock moves so that the bid price is now $9.90 and the ask price is $9.95. The trader who purchased for $10.10 now needs to sell at $9.95 if he wants to quickly exit his trade. The other choice is to continue the trade in hopes that the market will turn upward and not fall farther. This later course is anathema to scalping in day trading. When scalping a trader is never trying to outguess the market but simply helping to make the market and make repetitive small profits.
The Nature of Bid and Ask Prices
Bid and ask prices are available on markets across the world. By using this price system traders are able to execute trades immediately, so long as there are enough bid prices to match ask prices. The difference between bid and ask prices is called the spread. Gaining the spread on every trade is the goal when scalping in day trading. The ideal scalping trade would be instantaneous. Buy at the low price and sell at the high. Getting in and out in an instant would seem to be the ideal situation if dealing with absolutely static bid and ask prices. However, the market is never static so traders must look to market direction even when scalping in day trading. A successful scalper also engages in trend following in day trading.
Think of the Spread as a Bonus
Scalping in day trading takes advantage of market movement as well as the bid to ask spread. While trend traders use technical analysis to read market sentiment they attempt to ride out a trade to gain the maximum profit.
Profit from trapped traders with 2 simple setupsNetpicksTrading
http://www.netpicks.com/tjgiveaway1 - YOUR FREE TRADING SYSTEM
The concept of trapped traders is a simple one to understand.
While there are two forms of trapped traders, I only want to focus on one.
The trader who is trapped in a losing position.
These traders, by virtue of being on the wrong side of the market, can help propel your trade when they hit the exits.
Issues Of Trapped Traders
The fear and panic by those who enter a trade only to find the market going against them can cause a sudden burst of price movement. This movement in price is caused by these traders exiting their positions and creating order flow in the opposite direction from which they entered the trade.
Whenever you look at the high of a green candle, picture someone hitting their buy button and entering the trade. Flash forward to the next candle being a red momentum candle and that trader who bought the high, is trapped.
To exit, they have to sell.
See more at: http://www.netpicks.com/trapped-traders/
A forex trading strategy is a technique used by traders to determine when to buy and sell currency pairs based on technical analysis, fundamentals, or developed trading signals. Effective strategies include selecting markets, establishing entry and exit points, determining position size, and developing trading tactics. Traders should evaluate whether a strategy remains profitable and suited to current market conditions, and be willing to modify or change strategies when necessary to maintain effectiveness.
Tim Morge, The three up three down trading strategyiamn900
1) The document describes a trading strategy called "Three Up, Three Down" which identifies trading ranges in markets after prices have tested the top of the range three times and the bottom three times.
2) The strategy was originally developed by farmers in the 1800s/1900s and involves drawing lines to connect the three tops and bottoms of ranges.
3) The document provides examples of the strategy in action on charts of crude oil and stock market futures, showing clear trading ranges and profitable entries when prices break above or below the three line.
What are some of the advantages of using a scalping strategy to trade the forex market? - Quick profits Entry and exit is usually done within a couple of minutes. This allows for quick profits but can lead to quick losses as well. - Exit is usually within 20 minutes or less - Lots of trades Strategy uses 3 Indicators The strategy uses 3 indicators: pivot points, Fibonacci retracement and the Stochastic Oscillator. The 3 main pivot points both above and below the pivot are used for this system: S1, S2, S3 and R1, R2, R3. The Fibonacci retracement values used are the 0.618, the 0.382 and the 0.500 levels. The Stochastic Oscillator is set at 5,3,3.
Opening range breakout trading strategyNasir Tareen
The document discusses strategies for trading opening range breakouts. It defines the opening range as the high and low prices established within the first hour, 30 minutes, 15 minutes, or even one minute after the market opens. It recommends taking long signals if the price breaks above the high of the opening range or short signals if the price breaks below the low of the opening range. Additional factors like volume, daily chart trends, and catalysts can improve the odds of a successful trade. An example trade is presented to illustrate how to profit from an opening range breakout.
This document provides definitions and strategies for the Follow The Money (FTM) trading strategy. It discusses analyzing market structure and momentum on different timeframes to identify trends and trading opportunities that are aligned across timeframes. Key concepts explained include order blocks, imbalances, and how institutional traders use techniques like stop hunt candles and order manipulation to provide liquidity and mitigate losses. The document emphasizes the importance of trading with the trend and looking for continuation moves where structures are aligned on multiple timeframes.
Rsi pro forex trading system cash back forex rebaitess ( pdf drive ) (2)hitesh836039
This document provides 17 examples of forex trades using the RSI PRO Forex Trading System. Each example includes a chart and description of the trade setup and signals. The examples showcase how to identify trading opportunities from shifts in RSI ranges, divergences, reversals and channel breaks. They also demonstrate concepts like managing risk, position sizing, and avoiding trades during low volatility periods. The purpose is to help traders learn from actual past trades and improve their decision making when using the RSI PRO system.
This document discusses the importance of managing emotions in Forex trading. It states that while knowledge of markets and strategies is important, success ultimately depends on learning to handle emotions well. Experienced traders avoid trading out of greed or fear, understand uncertainty in the market, and never expect quick profits. The document recommends developing a solid trading plan and discipline to prevent emotions from affecting performance, as managing emotions is the key to long-term success in Forex trading.
This document discusses the challenges of determining causation when analyzing the relationship between exchange rates and exports using limited data from individual countries. Complex economies involve many interconnected factors, making direct causation difficult to identify. While exchange rate changes may theoretically cause export changes, in reality other variables are also changing simultaneously. The author uses Peru as an example, finding its currency appreciated against the dollar from 2002-2012 as trade balance increased, though the relationship became less clear from 2010-2012. Overall the document cautions that the best we may be able to identify is correlation rather than direct causation from such analyses.
This document provides an overview of different chart patterns that traders can use, including triangles (ascending, descending, and symmetrical), head and shoulders patterns, and their inverses. It discusses how to identify these patterns on charts and how to trade when they are formed, including where to place stop losses and take profits. Key points covered include that the head and shoulders pattern is a reliable reversal indicator, triangles can signal continuations or reversals depending on the type, and symmetrical triangles can result in breakouts in either direction.
https://www.fiverr.com/mastermentor/teach-you-forex-trading-in-1-hour
Simple and Easy way to learn Forex from a Pro Trader. Follow this guide and learn how to trade forex in an easy and fast manner. Becoming a succesful trader is just minutes away!
Learn step by step easy to follow video course below:
https://www.fiverr.com/mastermentor/teach-you-forex-trading-in-1-hour
This document provides an overview of supply and demand trading strategies. It begins with an introduction and disclaimer about the risks of trading. It then discusses key concepts like identifying trends on charts, drawing trendlines, and understanding retracements and reversals. The document focuses on explaining supply and demand zones, how to identify and draw them on charts, and how to develop a trading strategy around high probability supply and demand zones. It emphasizes the importance of risk management strategies like stop losses and position sizing. The goal is to provide readers with the fundamental tools and framework to execute a supply and demand trading approach.
“Forex Trading Strategies” is a complete guide of most popular and widely used strategies in Forex trade. You can read about day trading and its main types, understand the strategies based on market analysis, learn about portfolio and algorithmic trading, and many more. The book represents the ins and outs of each strategy - why and how it is used and how to get profit from trade. It is suitable for all traders who are novice in trade or want to improve their skills. All the strategies classified and explained here are for educational purposes and can be applied by each trader in a different way.
Trading Psychology: 5 Critical Lessons From Pro Traders That You Should Know.Reach Markets
Successful traders have the ability to develop a solid plan and have the mental focus to stick to it over time.
Achieving your goals can be helped by following the path set by someone successful.
These 5 quotes are meaningful pieces of advice from successful traders, which can help you improve your decision making and trading psychology.
The document discusses forex trading and provides information on:
1) The forex market is the largest financial market in the world with over $4 trillion traded daily. It is accessible to individuals via the internet and allows trading of major currencies 24/5.
2) Compared to stock trading, forex trading offers advantages like 24/7 accessibility, no commissions, ability to short sell without restrictions, and higher leverage of 400:1.
3) The most heavily traded currency pairs are EUR/USD, USD/JPY, GBP/USD, and USD/CHF. The US dollar is the most traded currency, comprising about 83.7% of forex trading.
This document introduces a forex trading strategy using the MACD indicator on a 4-hour timeframe. It describes the strategy's focus on simplicity and high probability trades. Figures 1-3 are included to illustrate past trade signals and results, with Figure 1 showing 14 signals over 5 weeks that produced good results. The strategy aims for 95% accuracy by filtering for the best MACD signals. Setup instructions are provided for the MACD settings and moving averages to use on charts. Common MACD patterns that signal high probability trades are explained, such as heads and shoulders and rounding tops and bottoms.
This document introduces the MagicBreakout forex trading strategy. It is summarized as follows:
1) The strategy aims to enter the market before breakouts occur by using the CCI indicator to signal when to enter trades. This allows traders to enter positions before the crowd of momentum traders.
2) Detailed rules are provided for both entry and exit including identifying trends using EMAs, setting entry criteria using CCI crossovers, and taking profits and stops using Fibonacci retracement levels.
3) Following the strategy and strict money management is touted as the key to achieving consistent profits that grow exponentially over time. Additional paid strategies and software are promoted as helping automate the system.
The document discusses the benefits of exercise for mental health. Regular physical activity can help reduce anxiety and depression and improve mood and cognitive functioning. Exercise boosts blood flow, releases endorphins, and promotes changes in the brain which help regulate emotions and stress levels.
By www.ProfitableTradingTips.com
Scalping in Day Trading
Traders who engage in rapid momentum trades are often scalping in day trading. These traders make their profit from the difference between bid and ask prices. Even in a flat market traders can profit from scalping in day trading. In order to successfully make a business out of scalping in day trading the trader needs to pay close attention to the market, always be aware of market fundamentals, and keep abreast of technical analysis. Despite the theoretical possibility of trading in an absolutely flat market the price of a stock constantly moves to some degree throughout the trading day. Thus when scalping in day trading one acts as a mini trend trader as well.
In and Out of Positions in a Hurry
There is a rhythm to scalping in day trading and it is fast. Traders seek to profit from the actions of traders to simply take the bid and ask prices of a stock. This strategy guarantees a profit if the trader acts quickly. It can result in losses if the stock price moves too quickly. As an example, Xyz Corporation has a bid price of $10.10 and ask price of $10.15. If the scalper can buy at the bid price and sell at the ask price he gains $0.05 per share, a small amount but a lot if repeated many times throughout the day. However, the market might move lower before he can complete his trade. Let’s say that the stock moves so that the bid price is now $9.90 and the ask price is $9.95. The trader who purchased for $10.10 now needs to sell at $9.95 if he wants to quickly exit his trade. The other choice is to continue the trade in hopes that the market will turn upward and not fall farther. This later course is anathema to scalping in day trading. When scalping a trader is never trying to outguess the market but simply helping to make the market and make repetitive small profits.
The Nature of Bid and Ask Prices
Bid and ask prices are available on markets across the world. By using this price system traders are able to execute trades immediately, so long as there are enough bid prices to match ask prices. The difference between bid and ask prices is called the spread. Gaining the spread on every trade is the goal when scalping in day trading. The ideal scalping trade would be instantaneous. Buy at the low price and sell at the high. Getting in and out in an instant would seem to be the ideal situation if dealing with absolutely static bid and ask prices. However, the market is never static so traders must look to market direction even when scalping in day trading. A successful scalper also engages in trend following in day trading.
Think of the Spread as a Bonus
Scalping in day trading takes advantage of market movement as well as the bid to ask spread. While trend traders use technical analysis to read market sentiment they attempt to ride out a trade to gain the maximum profit.
Profit from trapped traders with 2 simple setupsNetpicksTrading
http://www.netpicks.com/tjgiveaway1 - YOUR FREE TRADING SYSTEM
The concept of trapped traders is a simple one to understand.
While there are two forms of trapped traders, I only want to focus on one.
The trader who is trapped in a losing position.
These traders, by virtue of being on the wrong side of the market, can help propel your trade when they hit the exits.
Issues Of Trapped Traders
The fear and panic by those who enter a trade only to find the market going against them can cause a sudden burst of price movement. This movement in price is caused by these traders exiting their positions and creating order flow in the opposite direction from which they entered the trade.
Whenever you look at the high of a green candle, picture someone hitting their buy button and entering the trade. Flash forward to the next candle being a red momentum candle and that trader who bought the high, is trapped.
To exit, they have to sell.
See more at: http://www.netpicks.com/trapped-traders/
A forex trading strategy is a technique used by traders to determine when to buy and sell currency pairs based on technical analysis, fundamentals, or developed trading signals. Effective strategies include selecting markets, establishing entry and exit points, determining position size, and developing trading tactics. Traders should evaluate whether a strategy remains profitable and suited to current market conditions, and be willing to modify or change strategies when necessary to maintain effectiveness.
Tim Morge, The three up three down trading strategyiamn900
1) The document describes a trading strategy called "Three Up, Three Down" which identifies trading ranges in markets after prices have tested the top of the range three times and the bottom three times.
2) The strategy was originally developed by farmers in the 1800s/1900s and involves drawing lines to connect the three tops and bottoms of ranges.
3) The document provides examples of the strategy in action on charts of crude oil and stock market futures, showing clear trading ranges and profitable entries when prices break above or below the three line.
What are some of the advantages of using a scalping strategy to trade the forex market? - Quick profits Entry and exit is usually done within a couple of minutes. This allows for quick profits but can lead to quick losses as well. - Exit is usually within 20 minutes or less - Lots of trades Strategy uses 3 Indicators The strategy uses 3 indicators: pivot points, Fibonacci retracement and the Stochastic Oscillator. The 3 main pivot points both above and below the pivot are used for this system: S1, S2, S3 and R1, R2, R3. The Fibonacci retracement values used are the 0.618, the 0.382 and the 0.500 levels. The Stochastic Oscillator is set at 5,3,3.
Opening range breakout trading strategyNasir Tareen
The document discusses strategies for trading opening range breakouts. It defines the opening range as the high and low prices established within the first hour, 30 minutes, 15 minutes, or even one minute after the market opens. It recommends taking long signals if the price breaks above the high of the opening range or short signals if the price breaks below the low of the opening range. Additional factors like volume, daily chart trends, and catalysts can improve the odds of a successful trade. An example trade is presented to illustrate how to profit from an opening range breakout.
This document provides definitions and strategies for the Follow The Money (FTM) trading strategy. It discusses analyzing market structure and momentum on different timeframes to identify trends and trading opportunities that are aligned across timeframes. Key concepts explained include order blocks, imbalances, and how institutional traders use techniques like stop hunt candles and order manipulation to provide liquidity and mitigate losses. The document emphasizes the importance of trading with the trend and looking for continuation moves where structures are aligned on multiple timeframes.
Rsi pro forex trading system cash back forex rebaitess ( pdf drive ) (2)hitesh836039
This document provides 17 examples of forex trades using the RSI PRO Forex Trading System. Each example includes a chart and description of the trade setup and signals. The examples showcase how to identify trading opportunities from shifts in RSI ranges, divergences, reversals and channel breaks. They also demonstrate concepts like managing risk, position sizing, and avoiding trades during low volatility periods. The purpose is to help traders learn from actual past trades and improve their decision making when using the RSI PRO system.
This document discusses the importance of managing emotions in Forex trading. It states that while knowledge of markets and strategies is important, success ultimately depends on learning to handle emotions well. Experienced traders avoid trading out of greed or fear, understand uncertainty in the market, and never expect quick profits. The document recommends developing a solid trading plan and discipline to prevent emotions from affecting performance, as managing emotions is the key to long-term success in Forex trading.
This document discusses the challenges of determining causation when analyzing the relationship between exchange rates and exports using limited data from individual countries. Complex economies involve many interconnected factors, making direct causation difficult to identify. While exchange rate changes may theoretically cause export changes, in reality other variables are also changing simultaneously. The author uses Peru as an example, finding its currency appreciated against the dollar from 2002-2012 as trade balance increased, though the relationship became less clear from 2010-2012. Overall the document cautions that the best we may be able to identify is correlation rather than direct causation from such analyses.
This document provides an overview of different chart patterns that traders can use, including triangles (ascending, descending, and symmetrical), head and shoulders patterns, and their inverses. It discusses how to identify these patterns on charts and how to trade when they are formed, including where to place stop losses and take profits. Key points covered include that the head and shoulders pattern is a reliable reversal indicator, triangles can signal continuations or reversals depending on the type, and symmetrical triangles can result in breakouts in either direction.
1 Aggregate Demand 4. Explain the intuition behind the wea.docxoswald1horne84988
1 Aggregate Demand
4. Explain the intuition behind the wealth, interest rate, and exchange rate effects.
The intuition behind the real wealth effect is that when the price level decreases, it takes less
money to buy goods and services. The money you have is now worth more and you feel
wealthier. So, in response to a decrease in the price level, real GDP will increase. More
formally, this means that when households’ assets are worth more in terms of their
purchasing power, they are more likely to purchase more goods and services.
The opposite happens when the price level increases. If the price of everything increases, but
the number of dollars you have doesn’t, then you have to cut back on spending. Some
shorthand of this chain of events can help us wrap our heads around this:
PL↓→real wealth ↑→consumption increases→move right along AD curve
The intuition behind the interest rate effect is that when the price level decreases, you need
less money in your pocket to buy stuff. The less money you need to keep on hand to buy
stuff, the more money you are going to keep in a bank. Banks pay interest to try to lure
people to deposit their money in banks. So, if you are going to keep more money in the bank
anyway, banks don’t have to offer as much interest in order to convince you; that drives
interest rates down. As a result, businesses and households spend more money on investment
and “big ticket” items that are interest sensitive, like X, Y, and Z. So, once again, a decrease
in the price level will increase real GDP.
On the other hand, a higher price level will drive up interest rates. Remember how a higher
price level would make everyone’s dollars are worth less, and they cut back on consumption?
Well, what if they didn’t want to cut back on consumption. Instead, maybe they sell off some
other asset like a bond to try to get more money. The problem is, every other bondholder is
also trying to sell off their bonds, so there are no buyers! Anyone who wants to issue a new
bond is going to have to do something to try to attract buyers. The way to do that is to raise
the interest rate that is offered. All of that excess demand for money leads to an increase in
the interest rate.
Finally, the intuition behind the exchange rate effect is that a decrease in the price level in
country A makes its goods cheaper to country B, so country B buys more of country A’s
exports. When the price level in one country goes down, its goods are suddenly more
attractive to every other country. It’s like the whole country is on sale! Since that country’s
goods are suddenly cheaper, their exports go up.
2 Multipliers
4. Households in Iron Island save 10% of every additional dollar in income that they
receive. What will happen to aggregate demand Maggietopia if there is a $4 billion
increase in lump-sum taxes?
Note: Please answer this question on your own.
3 Short-run Aggregate Supply (SRAS)
.
In this slide, you will find a propose of a warning mechanism for financial instrument, I tried to explain briefly the aim, the method and the results! Have a nice reading!
This document discusses the debate around inflation and deflation forces currently at work in the US economy. It argues that the Federal Reserve is pulling hard to curb deflation by increasing the money supply, but risks overshooting and causing high inflation. The author believes the most likely outcome is that the Fed will keep interest rates too low and the money supply high for too long, eventually leading to distressing levels of inflation. The document advises protecting investments from inflation by diversifying out of cash, bonds, and annuities into other assets.
This document provides an introduction to the forex market, including:
- The forex market is the largest financial market in the world with over $1.2 trillion in daily trading volume.
- Major currency pairs include EUR/USD, GBP/USD, USD/JPY, and USD/CHF, which together comprise over 90% of forex trading.
- Currency quotes show the bid (buy) and ask (sell) price, with the difference known as the spread. Pips refer to the smallest price movement in a currency pair.
- Forex is traditionally traded in standard 100,000 unit lots, but mini lots of 10,000 units are also available. Lever
The document provides an overview of day trading in the forex market, which trades $5.3 trillion daily. It explains that forex is traded 24/5 by buying and selling currency pairs to profit from price fluctuations. The document also lists the six most traded currency pairs and provides basic information on how forex trading works and how to potentially make money by trading currencies.
The document provides an introduction to the foreign exchange (forex) market. It discusses how the forex market operates through interbank trading between banks, brokers, and other financial institutions. The forex market is decentralized and trades 24 hours a day, with over $1.2 trillion in daily volume. Currencies are quoted in pairs, with the US dollar often serving as one side of the pair. Price movements in currency pairs are measured in pips or decimal points.
The document discusses futures and options trading, noting that it involves large potential rewards but also large potential risks, and investors must be aware of and willing to accept those risks. It provides an overview of tweezer candlestick patterns, including tweezer tops and bottoms, which can indicate support and resistance levels, and discusses characteristics of effective tweezer patterns. The document emphasizes that past performance is not indicative of future results and any discussions are not a solicitation to trade.
This document discusses the difference between Ito calculus and Taylor expansions in the context of calculating portfolio profit and loss (PL).
While Taylor expansions deal with regular calculus and require differentiability, Ito's lemma looks similar to a Taylor expansion but is an exact equation, not an approximation. Ito's lemma describes how the chain rule works in stochastic calculus.
The document uses the example of calculating option PL to illustrate the difference. A Taylor expansion can be used to calculate the first-order PL terms from changes in the stock price, volatility, and time. However, the full PL calculation involves additional non-market factors like funding costs, credit valuation adjustments, and cross-currency effects that
This document provides an introduction and overview of trading concepts from the perspective of David M. Knight. Some key points:
- Trading requires learning from experience over time as the best teacher is experience in the markets. Understanding trends, waves, and support and resistance is important.
- Determining the overall trend of the market using the 50-day and 200-day simple moving averages on daily charts helps understand the mass trader psychology.
- Markets move in wave patterns, so understanding the type of waves (i.e. volatile vs. smooth) helps determine the best times to trade.
- Considering volume, volatility, and velocity (the 3 V's) along with risk versus volume can help optimize
The document discusses foreign exchange (FX) market concepts and notations. It introduces a rigorous notation system to index currencies using integers and define spot FX rates between currencies. It defines the usual market convention for quoting currency pairs and relates this to the introduced notation. The document also discusses the FX correlation triangle and how volatility relationships can be derived between currency pairs using properties of geometric Brownian motion processes and Ito's lemma.
A discussion over the book- principal of cash flow valuationFuturum2
This document summarizes an online discussion between Karnen and Ignacio Velez-Pareja (IVP) about IVP's book "Principles of Cash Flow Valuation". Karnen asks questions about chapters he has read so far. IVP provides clarification and additional insights. They discuss the appropriate discount rates to use for perpetuities versus finite cash flows. IVP suggests using an unlevered cost of equity (Ku) and cash flow to equity approach to handle different scenarios in a consistent manner. Karnen remains uncertain about accurately estimating changing discount rates over time. IVP emphasizes the importance of consistency even if the "correct" approach is unknown.
Currency correlation, the price movement of one currency in relation to another currency, takes place in the forex market due to clubbing, interdependency, and risk. As currencies are traded in pairs, the value change of one currency affects other currencies and it is called clubbing. Interdependency is the dependency of neighboring economies and their effect in the forex market. And when the market is at risk, traders look for safe currencies, which increases their price. But currency correlation is not a fixed affair in the market. So, if you want to trade based on the currency correlation, checking it with calculations and facts is a must thing to do, to trade safely in the market.
https://wetalktrade.com/currency-correlation-forex-pairs/
Motivational Currency is a new approach to an old challenge. Motivational Currency is what drives people from the inside out. It's an easy to remember way to understand what motivates you, uncover what motivates others and influence with impact. . www.OnPointAdvising.com
Portfolio Management And The European Crisisamadei77
This document provides guidance on portfolio management during times of crisis like the ongoing European debt crisis. It argues that probabilities don't matter and the focus should be on potential impact. It also says we cannot truly know the future or fully understand past events. The document recommends stress testing scenarios, but notes the limitations as reality may be messier. It emphasizes that negative skew, where losses are larger than gains, can be very damaging, especially if the portfolio has large exposures and the crisis is significant. Managing risks through stop losses is advised.
1. The document provides an introduction to investing in gold and silver, noting that while a disclaimer is included, the purpose is to educate readers on key strategies and information.
2. It discusses the current state of the US economy, including unprecedented levels of debt that have raised concerns about inflation and the stability of the dollar. This context suggests gold and silver are wise hedge investments.
3. There are many investment options in gold and silver, but the document focuses on physical bullion coins and bars as the best investments, noting concerns about ETFs and numismatic coins in difficult economic times.
every people want to invest money in different financial product like pf,fd,rd,sba. insurance ,mutual fund, bond ,debt,govt. securities and maximise wealth of money but all people are not aware about option trading strategy help you appreciate your investment amount.all people aware fall in indian currrency against dollar in intrenational trade.
B2B payments are rapidly changing. Find out the 5 key questions you need to be asking yourself to be sure you are mastering B2B payments today. Learn more at www.BlueSnap.com.
Industrial Tech SW: Category Renewal and CreationChristian Dahlen
Every industrial revolution has created a new set of categories and a new set of players.
Multiple new technologies have emerged, but Samsara and C3.ai are only two companies which have gone public so far.
Manufacturing startups constitute the largest pipeline share of unicorns and IPO candidates in the SF Bay Area, and software startups dominate in Germany.
At Techbox Square, in Singapore, we're not just creative web designers and developers, we're the driving force behind your brand identity. Contact us today.
The 10 Most Influential Leaders Guiding Corporate Evolution, 2024.pdfthesiliconleaders
In the recent edition, The 10 Most Influential Leaders Guiding Corporate Evolution, 2024, The Silicon Leaders magazine gladly features Dejan Štancer, President of the Global Chamber of Business Leaders (GCBL), along with other leaders.
Anny Serafina Love - Letter of Recommendation by Kellen Harkins, MS.AnnySerafinaLove
This letter, written by Kellen Harkins, Course Director at Full Sail University, commends Anny Love's exemplary performance in the Video Sharing Platforms class. It highlights her dedication, willingness to challenge herself, and exceptional skills in production, editing, and marketing across various video platforms like YouTube, TikTok, and Instagram.
SATTA MATKA SATTA FAST RESULT KALYAN TOP MATKA RESULT KALYAN SATTA MATKA FAST RESULT MILAN RATAN RAJDHANI MAIN BAZAR MATKA FAST TIPS RESULT MATKA CHART JODI CHART PANEL CHART FREE FIX GAME SATTAMATKA ! MATKA MOBI SATTA 143 spboss.in TOP NO1 RESULT FULL RATE MATKA ONLINE GAME PLAY BY APP SPBOSS
Storytelling is an incredibly valuable tool to share data and information. To get the most impact from stories there are a number of key ingredients. These are based on science and human nature. Using these elements in a story you can deliver information impactfully, ensure action and drive change.
LA HUG - Video Testimonials with Chynna Morgan - June 2024Lital Barkan
Have you ever heard that user-generated content or video testimonials can take your brand to the next level? We will explore how you can effectively use video testimonials to leverage and boost your sales, content strategy, and increase your CRM data.🤯
We will dig deeper into:
1. How to capture video testimonials that convert from your audience 🎥
2. How to leverage your testimonials to boost your sales 💲
3. How you can capture more CRM data to understand your audience better through video testimonials. 📊
Tata Group Dials Taiwan for Its Chipmaking Ambition in Gujarat’s DholeraAvirahi City Dholera
The Tata Group, a titan of Indian industry, is making waves with its advanced talks with Taiwanese chipmakers Powerchip Semiconductor Manufacturing Corporation (PSMC) and UMC Group. The goal? Establishing a cutting-edge semiconductor fabrication unit (fab) in Dholera, Gujarat. This isn’t just any project; it’s a potential game changer for India’s chipmaking aspirations and a boon for investors seeking promising residential projects in dholera sir.
Visit : https://www.avirahi.com/blog/tata-group-dials-taiwan-for-its-chipmaking-ambition-in-gujarats-dholera/
Zodiac Signs and Food Preferences_ What Your Sign Says About Your Tastemy Pandit
Know what your zodiac sign says about your taste in food! Explore how the 12 zodiac signs influence your culinary preferences with insights from MyPandit. Dive into astrology and flavors!
Discover timeless style with the 2022 Vintage Roman Numerals Men's Ring. Crafted from premium stainless steel, this 6mm wide ring embodies elegance and durability. Perfect as a gift, it seamlessly blends classic Roman numeral detailing with modern sophistication, making it an ideal accessory for any occasion.
https://rb.gy/usj1a2
IMPACT Silver is a pure silver zinc producer with over $260 million in revenue since 2008 and a large 100% owned 210km Mexico land package - 2024 catalysts includes new 14% grade zinc Plomosas mine and 20,000m of fully funded exploration drilling.
buy old yahoo accounts buy yahoo accountsSusan Laney
As a business owner, I understand the importance of having a strong online presence and leveraging various digital platforms to reach and engage with your target audience. One often overlooked yet highly valuable asset in this regard is the humble Yahoo account. While many may perceive Yahoo as a relic of the past, the truth is that these accounts still hold immense potential for businesses of all sizes.
1. The
CORRELATION
Secret
"Discover the little known secret that powerful
institutional traders use repeatedly to profit
from the fundamental connectivity of different
currency pairs…”
By Jason Fielder
1
2. Dear fellow trader,
I would like to open up this report with some rather SHOCKING observations. They
may seem unrelated at first, but bear with me because I promise these observations have
everything to do with YOU becoming a more confident and profitable Forex trader.
Ok, I hope you’re ready because here comes the first “SHOCKING OBSERVATION”…
SHOCKING OBSERVATION #1:
As temperatures INCREASE, sales of ice cream INCREASE as well.
SHOCKING OBSERVATION #2:
As temperatures DECREASE, the volume of clothes that people wear
INCREASES.
Wow, that’s some seriously shocking stuff, isn’t it?
Ok, ok…by now you probably realize that I’m joking. Clearly there’s nothing shocking
about these observations. In fact, they’re about as common sense as it gets. Everyone
knows that as the weather warms up, people like to eat ice cream because it’s cooling
and delicious to eat in the summer heat.
Furthermore, we all know that as the weather turns colder, people tend to wear more
clothes because it’s necessary to stay warm.
These relationships (i.e. increased temperatures = increased ice cream sales AND
decreased temperatures = increased clothing volume) are so “common sense” and
fundamental, in fact, that we likely ignore them completely.
But imagine if blatantly obvious relationships like these existed in the Forex market?
And more importantly, imagine if these “common sense” and “fundamental”
relationships could be used to give you an edge and actually increase your trading
accuracy and profitability?
Well believe it or not, these relationships do exist in the Forex market…
They’re called CORRELATED PAIRS, and in this report I’m going to show you how
you can capitalize on these correlated pairs (and correlation trading in general) to make
more money than you’ve ever made before trading the Forex.
2
3. I’m even going to give you one of my tested and proven correlation trading strategies
(it’s called “Follow the Leader”) that you can begin trading almost immediately.
But before we get into the trading strategies themselves, we first need to take a closer
look at correlated pairs so you can see how they work (and more importantly) how we
use them to get an unfair advantage over just about every other trader…
3
4. What Do Correlated Currency Pairs Look Like?
The first step to profiting from correlated pairs is to learn how to recognize them.
Fortunately for us, that step is actually quite easy as you can see by the screenshot
below:
Even at first glance, you should be able to detect a clear relationship between these two
correlated currency pairs: EUR/USD and USD/CHF
Can you see how they’re almost always moving in opposite directions? Can you see how
when the EUR/USD goes up the USD/CHF tends to go down…and vice-versa?
If not, look again…
(NOTE: This time I’ve placed lines on the chart to make the relationship even more
4
5. obvious.)
As you can clearly see, the charts for the EUR/USD and USD/CHF are almost perfect
mirror images of one another. When the EUR/USD goes down, the USD/CHF tends to
go up. And when the EUR/USD goes up, the USD/CHF tends to go down.
This relationship is known as a NEGATIVE CORRELATION, because these two
correlated pairs (almost) always move in opposite directions of one another.
If the concept of negative correlation is still a bit unclear, think back on the 2nd
“Shocking Observation” I gave you at the start of this report. If you recall…
As temperatures DECREASE, the volume of clothing that people wear
INCREASES.
So in other words, temperature and clothing volume almost always move in opposite
5
6. directions.
As temperatures DECREASE, clothing volumes INCREASE.
As temperatures INCREASE, clothing volumes DECREASE.
(Think summer bikinis.)
Ok, by now you should have a pretty firm grasp of NEGATIVE correlation and what it
looks like, so let’s move on to the second type of correlation: POSITIVE
CORRELATION.
The screenshot below is an example of two POSITIVELY correlated currency pairs:
Unlike the previous example, these currency pairs are moving more or less parallel to
one another. Once again, to further illustrate this point I have drawn lines on the chart to
show the correlated movements of these two pairs over time…
6
7. This example is similar to “Shocking Observation #1”:
As temperatures INCREASE, ice cream sales also INCREASE.
So once again, since the movement of both temperature and ice cream sales are in the
same direction, this is an example of POSITIVE CORRELATION.
By now you should have a firm understanding of positive and negative correlations and
how to recognize them on a chart, so next let’s discuss why some currency pairs are
correlated and others are not…
7
8. It’s All About the FUNDAMENTALS
At this point you’re probably wondering, why are currency pairs (like the EUR/USD and
USD/CHF) correlated in the first place? What causes these positive and negative
relationships to exist?
Well much like our temperature and ice cream and temperature and clothing examples
from before, currency correlations come down to basic fundamentals.
Increased temperatures are correlated to increased ice cream sales and decreased
temperatures are correlated to increased clothing volume for two simple but extremely
powerful FUNDAMENTAL FACTORS: comfort and survival.
People eat ice cream when it gets hot because it makes them comfortable, and
they wear more clothing when it gets cold for the same reason…comfort (and in
some cases survival).
The point is, the factors that drive these correlations are deeply rooted in daily life. They
won’t change! Not this year…not in 10 years…NOT IN 100 YEARS!
The fundamentals behind these correlations are UNIVERSAL!
The same is true for correlated currency pairs…
There are literally dozens of correlated currency pairs, but what follows is a partial list of
some of the most significant pairs, and the fundamentals that back them:
The EUR/USD and GBP/USD, for example, are positively correlated because the base
currencies (i.e. the first currencies listed) of these pairs – the EUR and the GBP –
represent European Union Member States, so they’re very, very similar both from a
monetary policy and from a geographical sense.
In other words, when EU makes a shift in monetary policy or when there’s a major
change in the European economy, both the EUR and the GBP are affected in the same
way, because they’re both European currencies.
The EUR/USD and USD/CHF, on the other hand, are negatively correlated because the
base currency of the first pair (the EUR) and the base currency of the second pair (the
USD) have very different monetary policies, economics and geographic locations. So for
the same reason the previous pairs were positively correlated, these pairs are negatively
8
9. correlated.
Now, allow me to let you in on yet another fact:
Did you know that currency pairs with CAD, NZD and AUD as their base currencies
will all tend to be POSITIVELY correlated with one another?
It’s true, and in this case it has nothing to do with monetary policy, and it certainly has
nothing to do with geography. (After all, Canada and New Zealand couldn’t be farther
apart!)
In this case, the CAD, NZD and AUD are all correlated because all three countries
(Canada, New Zealand and Australia) are heavily dependent on commodity exports,
meaning their currencies all have strong ties to the commodities markets.
Therefore, as commodities move, so too do these three currencies…and typically in the
same directions.
By the way, if by any chance you’ve found this section confusion, please… DON’T
WORRY ABOUT IT!!
I have some good news...
Just like you don’t need to fully grasp the workings of an internal combustion engine to
drive a car, you also don’t need to fully grasp the detailed fundamentals behind the
different currency pair correlations to profit from them!
In fact, all you really need to know is:
Strong fundamentals are behind correlated currency pairs. This gives
you a consistent, predictable model from which to trade.
In other words, just like we can count on increased temperatures remaining correlated
with increased ice cream sales (because it’s backed by FUNDAMENTALS of daily life),
you can also count on the EUR/USD and GBP/USD remaining correlated because they
too are backed by…
…UNIVERSAL MARKET FUNDAMENTALS.
9
10. Predictable Volatility = Profit Potential
Now that you understand what correlation is, how to recognize it on a chart and the
fundamentals that back it, it’s now time to discuss how we use correlation to gain an
edge over other traders.
When most traders look at correlated pairs, they focus the bulk of their attention on the
98% of the time that the currency pairs do what they’re supposed to do and remain
correlated.
Not me…I’ve always been more interested in the 2% of the time when correlated
pairs FALL OUT of correlation.
(And if by any chance you're worried 2% doesn't sound like a lot, I can let you in on a
little secret... it's PLENTY often to produce continuous trading opportunities, if you
know what to look for!)
Oh, by the way, I realize it may sound a bit counter-intuitive, to look for a correlation
“fall out” so please hear me out…
You now know that correlations are backed by fundamentals. But not just any
fundamentals…correlations in the Forex market are backed by UNIVERSALE
MARKET FUNDAMENTALS.
In other words, the currency pairs we’re trading aren’t correlated because some over-
optimized, made up indicator says that they’re correlated…
…they’re correlated because REAL-WORLD market forces dictate that they
MUST be correlated.
So why does all this matter and what does it have to do with gaining that “edge” that I
promised?
Well, it’s simple…
If we know that certain pairs are correlated, and that those correlations are backed by
real-world market forces, then the 2% of the time when those pairs fall out of
correlation…we know that something has gone wrong.
We don’t know what has gone wrong, necessarily, but we do know that at least one of
10
11. the currency pairs isn’t acting like it should.
For example, remember the EUR/USD and USD/CHF?
These pairs have a high NEGATIVE CORRELATION, meaning they should more or
less move in opposite directions to one another.
If all the sudden these pairs fall out of correlation and begin to move parallel to one
another, then we know that something is “out of whack”.
And while it doesn’t happen all that often, it’s these times when things go “out of
whack” that we’re able to gain an edge.
You see, when correlated pairs fall out of correlation, it’s just a matter of time before
they go back into correlation. AGAIN, these are UNIVERSAL MARKET
FUNDAMENTALS that are causing these correlations, and it’s these market
11
12. fundamentals that will force the pairs back into correlation.
So here’s what we know…
We know that something has gone “wrong” because the currency pairs aren’t
behaving like they should…
We know that the pairs will eventually be forced back into correlation by
real-world, fundamental market forces…
We know that when the pairs move back into parity (i.e. correlation) that the
“movement” will create significant profit opportunities…
Did you catch that last one?
We know that when the pairs move back into parity (i.e. correlation) that the
“movement” will create significant profit opportunities…
This is the single most important point of this entire section, so don’t miss it…
When correlated pairs fall out of correlation, a small moment of opportunity is
created because we now KNOW that there will be movement (i.e. volatility) when
the pairs move back into parity. And where there’s VOLATILITY, there’s the
potential for profit.
Here’s the deal: As a trader, it is impossible to profit without movement in the markets.
We NEED volatility or we don’t make money.
But volatility alone isn’t enough. To trade with maximum confidence and accuracy, we
need PREDICTABLE VOLATILITY…and that’s exactly what correlation trading
gives us.
As correlation traders, we know that when correlated pairs fall out of correlation that
they will return. And it’s when things return to “normal” that we’re able to take our
profit.
12
13. The Giant FLAW In Correlation Trading
The fact that you’re still reading this report suggests that you’re probably getting excited
about this concept of Correlation Trading. After all…
Correlation Trading is easy to identify and trade…
Correlation Trading is backed by proven, timeless, universal market
fundamentals…
Correlation Trading gives us the PREDICTABLE VOLATILITY we need to
trade with confidence and accuracy…
It all sounds great, doesn’t it!?
Well unfortunately, Correlation Trading does have one GIANT FLAW.
While correlations will tell you that a move is about to occur, correlation alone doesn’t
tell you which pair is moving or the direction it will be moving in.
In other words, you know you need to put on a trade, but you don’t know which pair to
trade or whether you need to buy or sell short.
This massive limitation in Correlation Trading has stifled traders for years, which is why
so few traders use correlations despite its obvious benefits. In fact, chances are you
hadn’t even heard of Correlation Trading prior to downloading this report!
Of the handful of traders who did trade with correlations, most just used it as a filter to
increase the accuracy of an already-profitable system.
Well I for one wasn’t willing to stop there…
You see, as a full-time trader, researcher and system developer, I know that identifying
PREDICTABLE VOLATILITY is half the battle. Determining entry and exit points
is simply a matter of testing and a whole lot of trial and error.
So when I stumbled across Correlation Trading over a year ago, I knew I had found
something that was worth my time. Immediately I threw everything I had into it…all my
personal free time, and every member of my research team that I could allocate to the
project.
13
14. It took the better part of 12 months, but eventually we were able to crack the
“Correlation Code”.
In those 12 months, my team and I researched, developed and tested 82 different
strategies for capitalizing on correlation trades.
When the dust settled we were left with only 8 that made cut...and because you've take
the time to download and read my report, I am now going to share one of my favorites
with you.
Follow The Leader
The strategy is called “Follow the Leader”, and while it’s one of the simplest of the 8
strategies my team and I developed, it’s no less powerful.
Candidly, I’m hoping that by letting you test-drive one of our proven strategies that
you’ll want to become a member so you can gain access the other 7 strategies in
“The Correlation Code”.
If you’re interested in the “Correlation Code”, you can get more information by going
to:
http://www.correlationcode.com (If this re-directs to the blog, it just means you can't see the code
“quite yet”, but be patient, it won't be long!)
…and by visiting the training blog at:
http://www.correlationcode.com/blog
When you visit the blog, you’ll find a number of other videos and reports related to
correlation trading, so you’ll definitely want to check it out.
But for now, let’s dive into the “Follow the Leader” strategy so you can start profiting
RIGHT NOW…
14
15. The “Follow the Leader” Correlation Trade
Like all correlation trades, “Follow the Leader” waits until two correlated pairs go “out
of whack”, and then quickly capitalizes on the opportunity to scalp some quick pips out
of the market.
Here’s how it works…
For this system I like to trade the EUR/USD along with the GBP/USD. These pairs are
positively correlated, so as expected they are more or less moving parallel to one another
(as you can see in the screenshot on the next page).
But when we’re trading with correlation, we’re not only looking at direction…we’re
also looking at the RANGE.
“Range”: The difference between the high and the low prices
during a specified period of time.
We know, for example, that the GBP/USD normally has a much larger range than
the EUR/USD. (NOTE: I don’t have the time right now to go into why the range of the
GBP/USD is larger, but if you look at the two charts side-by-side you’ll be able to see
with the naked eye what I’m talking about.)
In other words, while these correlated pairs will generally move in the same direction,
the GBP/USD should have lower valleys and higher peaks than the EUR/USD. So, when
we see that the range of the GBP/USD is lagging behind the range of the EUR/USD for
one bar (see screenshot below), we have a potential trade setup.
Once the “range lag” is 20 pips or greater, we take the trade with the expectation that
the GBP/USD will make up the “gap”, and overtake the range of the EUR/USD within a
few bars.
Remember, we know this is an extremely high probability trade, because “Fundamental
Law” dictates that the pairs MUST remain in correlation, so therefore we know that they
will eventually “snap back”.
Like I said, it’s a simple strategy, but because it’s backed by market fundamentals it’s
one of the most accurate (and profitable) intra-day strategies I've ever traded.
15
16. Ok, so let’s go back and take a look at the chart…
Right now the range of the GBP/USD is lagging the EUR/USD by 8 pips. That’s enough
of a lag to take notice, but it’s not enough to take the trade yet.
Remember, I like to see at least a 20 pip lag before I take the trade, so I’ll watch it for
another bar and see what happens…
16
17. When the second bar closes, the range is now lagging by 15 pips. It’s still not enough for
me to take the trade yet, but the fact that the range lag still hasn’t corrected itself (and is
actually growing wider) has me very excited.
I’ll wait and watch it for one more bar and see if the “range lag” or “crack” widens
enough for me to take the trade…
17
18. The third bar has closed, and the “range lag” has now widened to 24 pips. That’s greater
than the 20 pip minimum I need, so I’m going to take this trade and go long on the
GBP/USD.
My expectation is that the GBP/USD will at a bare minimum make up the 24 pip
“range lag” or “crack”…and possibly even go beyond that since historically the range
of the GBP/USD is supposed to be LARGER than the EUR/USD
And again, when we’re trading with correlation and something goes “wrong” (as is the
case with this “range lag”), that usually means there’s a profit opportunity just around
the corner. :)
Now that we’re in this trade, let’s watch it and see what happens next…
18
19. As you can see, the very next bar the GBP/USD made up the “range lag” and returned to
“normal” just as we expected it to. We then exit the trade at the end of the bar and
pocket the 24 pips.
So there you have it…the “Follow the Leader” strategy!
So to recap, all you need to do is:
1) Watch these 2 pairs simultaneously.
2) Track the movement of both pairs at the close of each bar.
3) Once you see one of the pairs begin to pull away, pay attention because you are
now looking at a potential trade setup.
19
20. 4) Calculate the “range lag” or “crack” and when it exceeds 20 pips, you’re ready to
pull the trigger, and you know what your target will be, as it will be always be
about equal to the “range-lag”!
I’m confident that this one strategy alone will make you a more confident, accurate and
profitable trader, as these trades are ultra high probability trades to take, and I LOVE
when they set up...
NOW, if you want to learn three (3) ways to optimize “Follow the Leader” even more,
and see some live correlation examples, you’ll want to watch the potent bonus video I
posted to my blog at:
http://www.CorrelationCode.com/blog/?p=9
20
21. How You Can Use This New-Found Knowledge To Become a
More Accurate, Confident and Profitable Trader
At this point you have a couple of options…
1. You can take this information, do nothing with it and stick with your normal
trading plan. And that may very well be the best option if you’re a highly
profitable trader, but I’m guessing you wouldn’t still be reading this report if that
were the case…
2. You can use correlated pairs like a lot of other “pseudo-correlation-
traders”…as a filter for an already-profitable system. That said, you’ll need to
have an already-profitable system that’s worth trading on top of correlated pairs,
and even then you’re leaving money on the table by not fully maximizing
correlation trading…
3. You can keep watching your email very closely, as over the coming days I'll
be releasing a number of videos that will delve far deeper into the concept of
Correlation Trading. I'll be demonstrating optimization techniques,
illustrating some of my other even MORE powerful strategies, showing you
how I take these “Ultra High” probability trades in real time, and...
I'll soon be showing you how get access to all my proven, profitable trading
strategies so that YOU will be able to trade correlation like the pros! (And
believe me it's very exciting stuff!!)
Depending on when you are reading this report, “Correlation Code” may not be
available yet (or it may have even sold out). To check on availability and to see if you
qualify, please go to:
http://www.CorrelationCode.com
And again, if it takes you to the blog, that simply means it isn't available just yet, so
keep watching for more trading videos, and I'll soon be revealing how you can learn
more about “The Correlation Code”.
It's the single most important discovery I've made in my 15+ years of trading, and I'm
about to share it with you. So if you're serious about being a far more confident and
accurate trader, and you want to trade at the “Professional” level, Correlation Trading
can get you there a lot faster you likely ever imagined.
21
22. This is VERY powerful stuff.
Thanks for reading, and as always…
Good trading,
Jason Fielder
22
23. About the Author
Since you may not know who I am, I thought it would be appropriate to introduce
myself.
My name is Jason Fielder, and I am a professional currency trader.
The fact that you haven’t heard of me is no surprise. I have never been comfortable in
the spotlight and have purposely remain “underground”.
I don’t write books…
I don’t try to get on CNBC, and…
I don’t go from city to city doing “dog and pony shows” so I can sell a room-full
of people my overpriced, piece-of-crap, blinking-light, “black box” software.
I’m a trader, a system developer, a husband, and an amateur surfer (not necessarily in
that order as my wife likes to remind me).
Trading is what I love, and trading is what I DO as a profession.
I also enjoy teaching and helping other active traders get an edge. I know from personal
experience that most trading systems and advice are 100% crap, and it’s my mission to
provide something that actually works to independent traders just like me.
That’s why you’re reading this report...I truly enjoy sharing what I know with traders
who are just like me.
If you like what you’ve seen here and you want to learn more about what I trade and
how I trade, I invite you to check out my CORRELATION CODE by going to:
http://www.CorrelationCode.com/blog
23