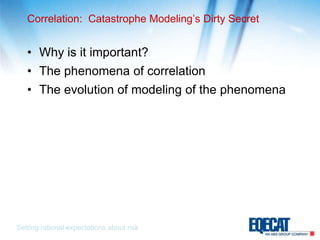
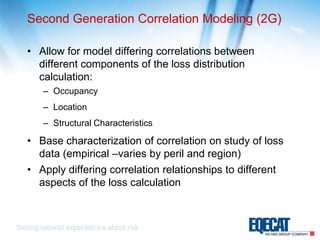
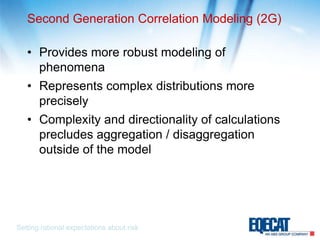
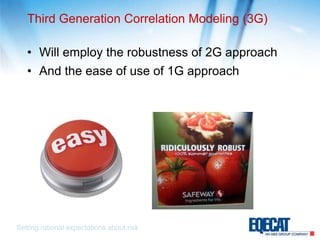
Correlation:  Catastrophe Modeling’s Dirty Secret
Correlation:  Catastrophe Modeling’s Dirty SecretWhy is it important?The phenomena of correlationThe evolution of modeling of the phenomenaSetting rational expectations about risk
Why Correlation is importantExtreme eventsThe “tail of the curve” is where correlation has a large impactcorrelation not accounted for can result in unpleasant surprisesLike hazard and vulnerability, correlation modeling affects model performance Overestimation and underestimation both problematicSetting rational expectations about risk
Why it mattersThe more leverage, the more it matters (i.e. further out on the tail)What decisions do we make out in the tail?Risk of ruinPricingCapital decisionsCommunicating risk to stake holdersReinsurance purchasing decisionsSetting expectations about riskSetting rational expectations about risk
The Phenomena of CorrelationDictionary definition - Statistics . the degree to which two or more attributes or measurements on the same group of elements show a tendency to vary together. Correlation is the measure of how likely distributions of outcomes are to behave the same way, or notCat modeling involves quantifying outcome distributions (uncertainty) – correlation describes the tendency or lack thereof of distributions to be in lockstepSetting rational expectations about risk
High correlationSetting rational expectations about risk
Low correlationSetting rational expectations about risk
Dimensions of correlationSpatialTemporalLoss responseSetting rational expectations about risk
The Phenomena of Correlation:  SpatialCorrelated hazard / losses due to large footprint eventsCyclones affecting multiple regions in a basinEarthquake rupture descriptions:  cascading fault rupturesWindstorm footprintsCorrelation through event definition:  Ike and inland lossesSetting rational expectations about risk
Spatial Correlation in EuropeWindstorm DariaSetting rational expectations about risk
The Phenomena of Correlation:  SpatialHazard characterization implies regional correlation (intended or not)Are adding Eurowind portfolios, for example France only portfolio to Germany only portfolioDiversifying (uncorrelated)Concentrating (correlated)Setting rational expectations about risk
The Phenomena of Correlation:  TemporalClustering:  weather perils are clustered due to atmospheric conditionsGlobal temporal weather correlation does existAMO for North Atlantic HurricanesENSO cycleSetting rational expectations about risk
The Phenomena of Correlation:  TemporalEarthquake events may have complex correlations to each otherEvents on same fault may be negatively correlated (time dependency)Stress release / transfer could provide mechanism for positive correlationGlobal correlation possible, but still under investigationSetting rational expectations about risk
Loss ResponseSetting rational expectations about risk
The Phenomena of Correlation:  Loss ResponseIn an event, damage response of structures IS correlated to varying degrees among different classes of exposureLevel of correlation between exposure classes differ – > multi-dimensional correlation matrixExamples:OccupancyDistanceResponse characteristics (based on construction, building height, components)Setting rational expectations about risk
Modeling of Correlation:  exampleCorrelated:  Significant probability of high-severity additive outcome+=fy(y)fx(x)Uncorrelated: Additive sum clustered close to the meanfxy(x+y)Setting rational expectations about risk
Modeling of Correlation:  sensitivity and impact on layering (illustration)The impact upon conditional probabilities of penetration is an inconsistent (insidious) bias:  sometimes high, sometimes, low.Not accounting for correlation will always under-estimate tail event probabilitiesSetting rational expectations about risk
First Generation Correlation Modeling (1G)Assume a reasonable but simple rule for correlation (i.e. 80/20)But ignores wealth of empirical data we have on this problemProvides a transparent means for adding portfolios (aggregation of risks)Calculation methods straight-forwardTail results will be highly influenced by the rule chosenbut not robust….
Second Generation Correlation Modeling (2G)Allow for model differing correlations between different components of the loss distribution calculation:OccupancyLocationStructural CharacteristicsBase characterization of correlation on study of loss data (empirical –varies by peril and region)Apply differing correlation relationships to different aspects of the loss calculationSetting rational expectations about risk
Second Generation Correlation Modeling (2G)Provides more robust modeling of phenomenaRepresents complex distributions more preciselyComplexity and directionality of calculations precludes aggregation / disaggregation outside of the modelSetting rational expectations about risk
Second Generation Correlation Modeling (2G)                                         but not easy…Setting rational expectations about risk
Third Generation Correlation Modeling (3G)Will employ the robustness of 2G approachAnd the ease of use of 1G approachSetting rational expectations about risk
EQECAT WORLDCATenterprise Re-architecturePerformance Step change in speedReliability  Reduce need for hot fixesCompletenessMost robust data base schemaConsistencyCommon building and occupancy classificationsTransparency  Access to insightSetting rational expectations about risk
Delivering 3G correlationJune 2011 – Robust correlation and the ability to aggregate portfolios analytically and extract event output2012 – robust correlation and the ability to aggregate and disaggregate portfolios “on the fly” and outside of the model.Setting rational expectations about risk

Correlation: Catastrophe Modeling’s Dirty Secret

  • 1.
    Correlation: CatastropheModeling’s Dirty Secret
  • 2.
    Correlation: CatastropheModeling’s Dirty SecretWhy is it important?The phenomena of correlationThe evolution of modeling of the phenomenaSetting rational expectations about risk
  • 3.
    Why Correlation isimportantExtreme eventsThe “tail of the curve” is where correlation has a large impactcorrelation not accounted for can result in unpleasant surprisesLike hazard and vulnerability, correlation modeling affects model performance Overestimation and underestimation both problematicSetting rational expectations about risk
  • 4.
    Why it mattersThemore leverage, the more it matters (i.e. further out on the tail)What decisions do we make out in the tail?Risk of ruinPricingCapital decisionsCommunicating risk to stake holdersReinsurance purchasing decisionsSetting expectations about riskSetting rational expectations about risk
  • 5.
    The Phenomena ofCorrelationDictionary definition - Statistics . the degree to which two or more attributes or measurements on the same group of elements show a tendency to vary together. Correlation is the measure of how likely distributions of outcomes are to behave the same way, or notCat modeling involves quantifying outcome distributions (uncertainty) – correlation describes the tendency or lack thereof of distributions to be in lockstepSetting rational expectations about risk
  • 6.
    High correlationSetting rationalexpectations about risk
  • 7.
    Low correlationSetting rationalexpectations about risk
  • 8.
    Dimensions of correlationSpatialTemporalLossresponseSetting rational expectations about risk
  • 9.
    The Phenomena ofCorrelation: SpatialCorrelated hazard / losses due to large footprint eventsCyclones affecting multiple regions in a basinEarthquake rupture descriptions: cascading fault rupturesWindstorm footprintsCorrelation through event definition: Ike and inland lossesSetting rational expectations about risk
  • 10.
    Spatial Correlation inEuropeWindstorm DariaSetting rational expectations about risk
  • 11.
    The Phenomena ofCorrelation: SpatialHazard characterization implies regional correlation (intended or not)Are adding Eurowind portfolios, for example France only portfolio to Germany only portfolioDiversifying (uncorrelated)Concentrating (correlated)Setting rational expectations about risk
  • 12.
    The Phenomena ofCorrelation: TemporalClustering: weather perils are clustered due to atmospheric conditionsGlobal temporal weather correlation does existAMO for North Atlantic HurricanesENSO cycleSetting rational expectations about risk
  • 13.
    The Phenomena ofCorrelation: TemporalEarthquake events may have complex correlations to each otherEvents on same fault may be negatively correlated (time dependency)Stress release / transfer could provide mechanism for positive correlationGlobal correlation possible, but still under investigationSetting rational expectations about risk
  • 14.
    Loss ResponseSetting rationalexpectations about risk
  • 15.
    The Phenomena ofCorrelation: Loss ResponseIn an event, damage response of structures IS correlated to varying degrees among different classes of exposureLevel of correlation between exposure classes differ – > multi-dimensional correlation matrixExamples:OccupancyDistanceResponse characteristics (based on construction, building height, components)Setting rational expectations about risk
  • 16.
    Modeling of Correlation: exampleCorrelated: Significant probability of high-severity additive outcome+=fy(y)fx(x)Uncorrelated: Additive sum clustered close to the meanfxy(x+y)Setting rational expectations about risk
  • 17.
    Modeling of Correlation: sensitivity and impact on layering (illustration)The impact upon conditional probabilities of penetration is an inconsistent (insidious) bias: sometimes high, sometimes, low.Not accounting for correlation will always under-estimate tail event probabilitiesSetting rational expectations about risk
  • 18.
    First Generation CorrelationModeling (1G)Assume a reasonable but simple rule for correlation (i.e. 80/20)But ignores wealth of empirical data we have on this problemProvides a transparent means for adding portfolios (aggregation of risks)Calculation methods straight-forwardTail results will be highly influenced by the rule chosenbut not robust….
  • 19.
    Second Generation CorrelationModeling (2G)Allow for model differing correlations between different components of the loss distribution calculation:OccupancyLocationStructural CharacteristicsBase characterization of correlation on study of loss data (empirical –varies by peril and region)Apply differing correlation relationships to different aspects of the loss calculationSetting rational expectations about risk
  • 20.
    Second Generation CorrelationModeling (2G)Provides more robust modeling of phenomenaRepresents complex distributions more preciselyComplexity and directionality of calculations precludes aggregation / disaggregation outside of the modelSetting rational expectations about risk
  • 21.
    Second Generation CorrelationModeling (2G) but not easy…Setting rational expectations about risk
  • 22.
    Third Generation CorrelationModeling (3G)Will employ the robustness of 2G approachAnd the ease of use of 1G approachSetting rational expectations about risk
  • 23.
    EQECAT WORLDCATenterprise Re-architecturePerformanceStep change in speedReliability Reduce need for hot fixesCompletenessMost robust data base schemaConsistencyCommon building and occupancy classificationsTransparency Access to insightSetting rational expectations about risk
  • 24.
    Delivering 3G correlationJune2011 – Robust correlation and the ability to aggregate portfolios analytically and extract event output2012 – robust correlation and the ability to aggregate and disaggregate portfolios “on the fly” and outside of the model.Setting rational expectations about risk

Editor's Notes

  • #3 This is intended to be the agenda slide. Hazard and vulnerability are discussed a lot, but not much on correlation. Very important and high impact on understanding tail risk. Northridge, steel construction, correlation matters.?
  • #4 The big picture slide – who cares? The answers will be provided in future slides, but this slide gives the big picture answer: ILS covers extreme events, extreme events may be the result of the correlation between components, and ignoring correlation in cat modeling can have negative consequences.Can
  • #6 This perhaps should be two slides. Idea is to provide a verbal / intuitive description of what we are talking aboutNOTE: one possibility would be to put the dictionary definition in grayed out background and have 2nd and 3rd points in foreground Tom’s thoughts:
  • #13 "weather perils are clustered in heavy activity seasons due to persistent weather patterns that may last a season or more" Our models have clustering, and our usage of clustering is defendable with ample research and empirical data, non-poisonnian technique.
  • #14 Need to check with Ken to make sure that we don’t say something unsupportable wrt EQ faultsDifference in clustering for weather than seismo events as weather clustering is likely on a yearly basis. Seismic clustering / time dependency… happens over much longer time frames.
  • #16 Correlation does NOT impose identical behavior- but expresses the quantifiable likelihood of outcomes being similarPost-event observations of damage patterns identify pockets of damage that are explainable by common construction attributes (1971 San Fernando - extreme damage to House-over-Garage "Brady Bunch" split level houses, 1992 Hurricane Andrew destruction to new homes and apartments in Homestead, but much less damage in neighboring and windward Coral Gables, ...)Modeling of complex correlation matrix leads to 2G difficulty to be discussed laterCorrelation is quantifiable through analysis of claims dataNot all features result in correlated response (i.e. given all else being the same, like colored warehouses aren’t likely to have more highly correlated response to a hurricane than warehouses of different colors. But warehouses are more likely to respond in a more correlated fashion than a warehouse and a house)
  • #17 On this slide or next, provide plot of distributions of the two pofs, AND tables with losses at varying probabilities.
  • #18 The table with the penetration probabilities are numbers off the CDF for the two distributions (correlated, uncorrelated). I arbitrarily chose levels associated, with "working layer" (for my test, working layer attaches at about the mean), "cat" (mean + 50% or so is the attachment point), and "super cat" is a little more than double the mean. The point here is to reinforce the impact of this bias - for lower layers, the correlated group has a higher probability of very low losses (the outcome of low loss at site A & low loss at site B is higher if they are more likely to swing in tandem).Why is this an important point? Return back to the message of reducing "surprises". If a model has a consistent bias (always low, always high) it can be adjusted with scalars. If a model has an inconsistent bias, you don't know if your model result will be too high or too low until after the loss occurs (surprise!).
  • #19 Consideration of correlation a modeling input just like vulnerability, hazard, etc. Yet this method may be overly simplistic compared to the other aspects of the model implementation