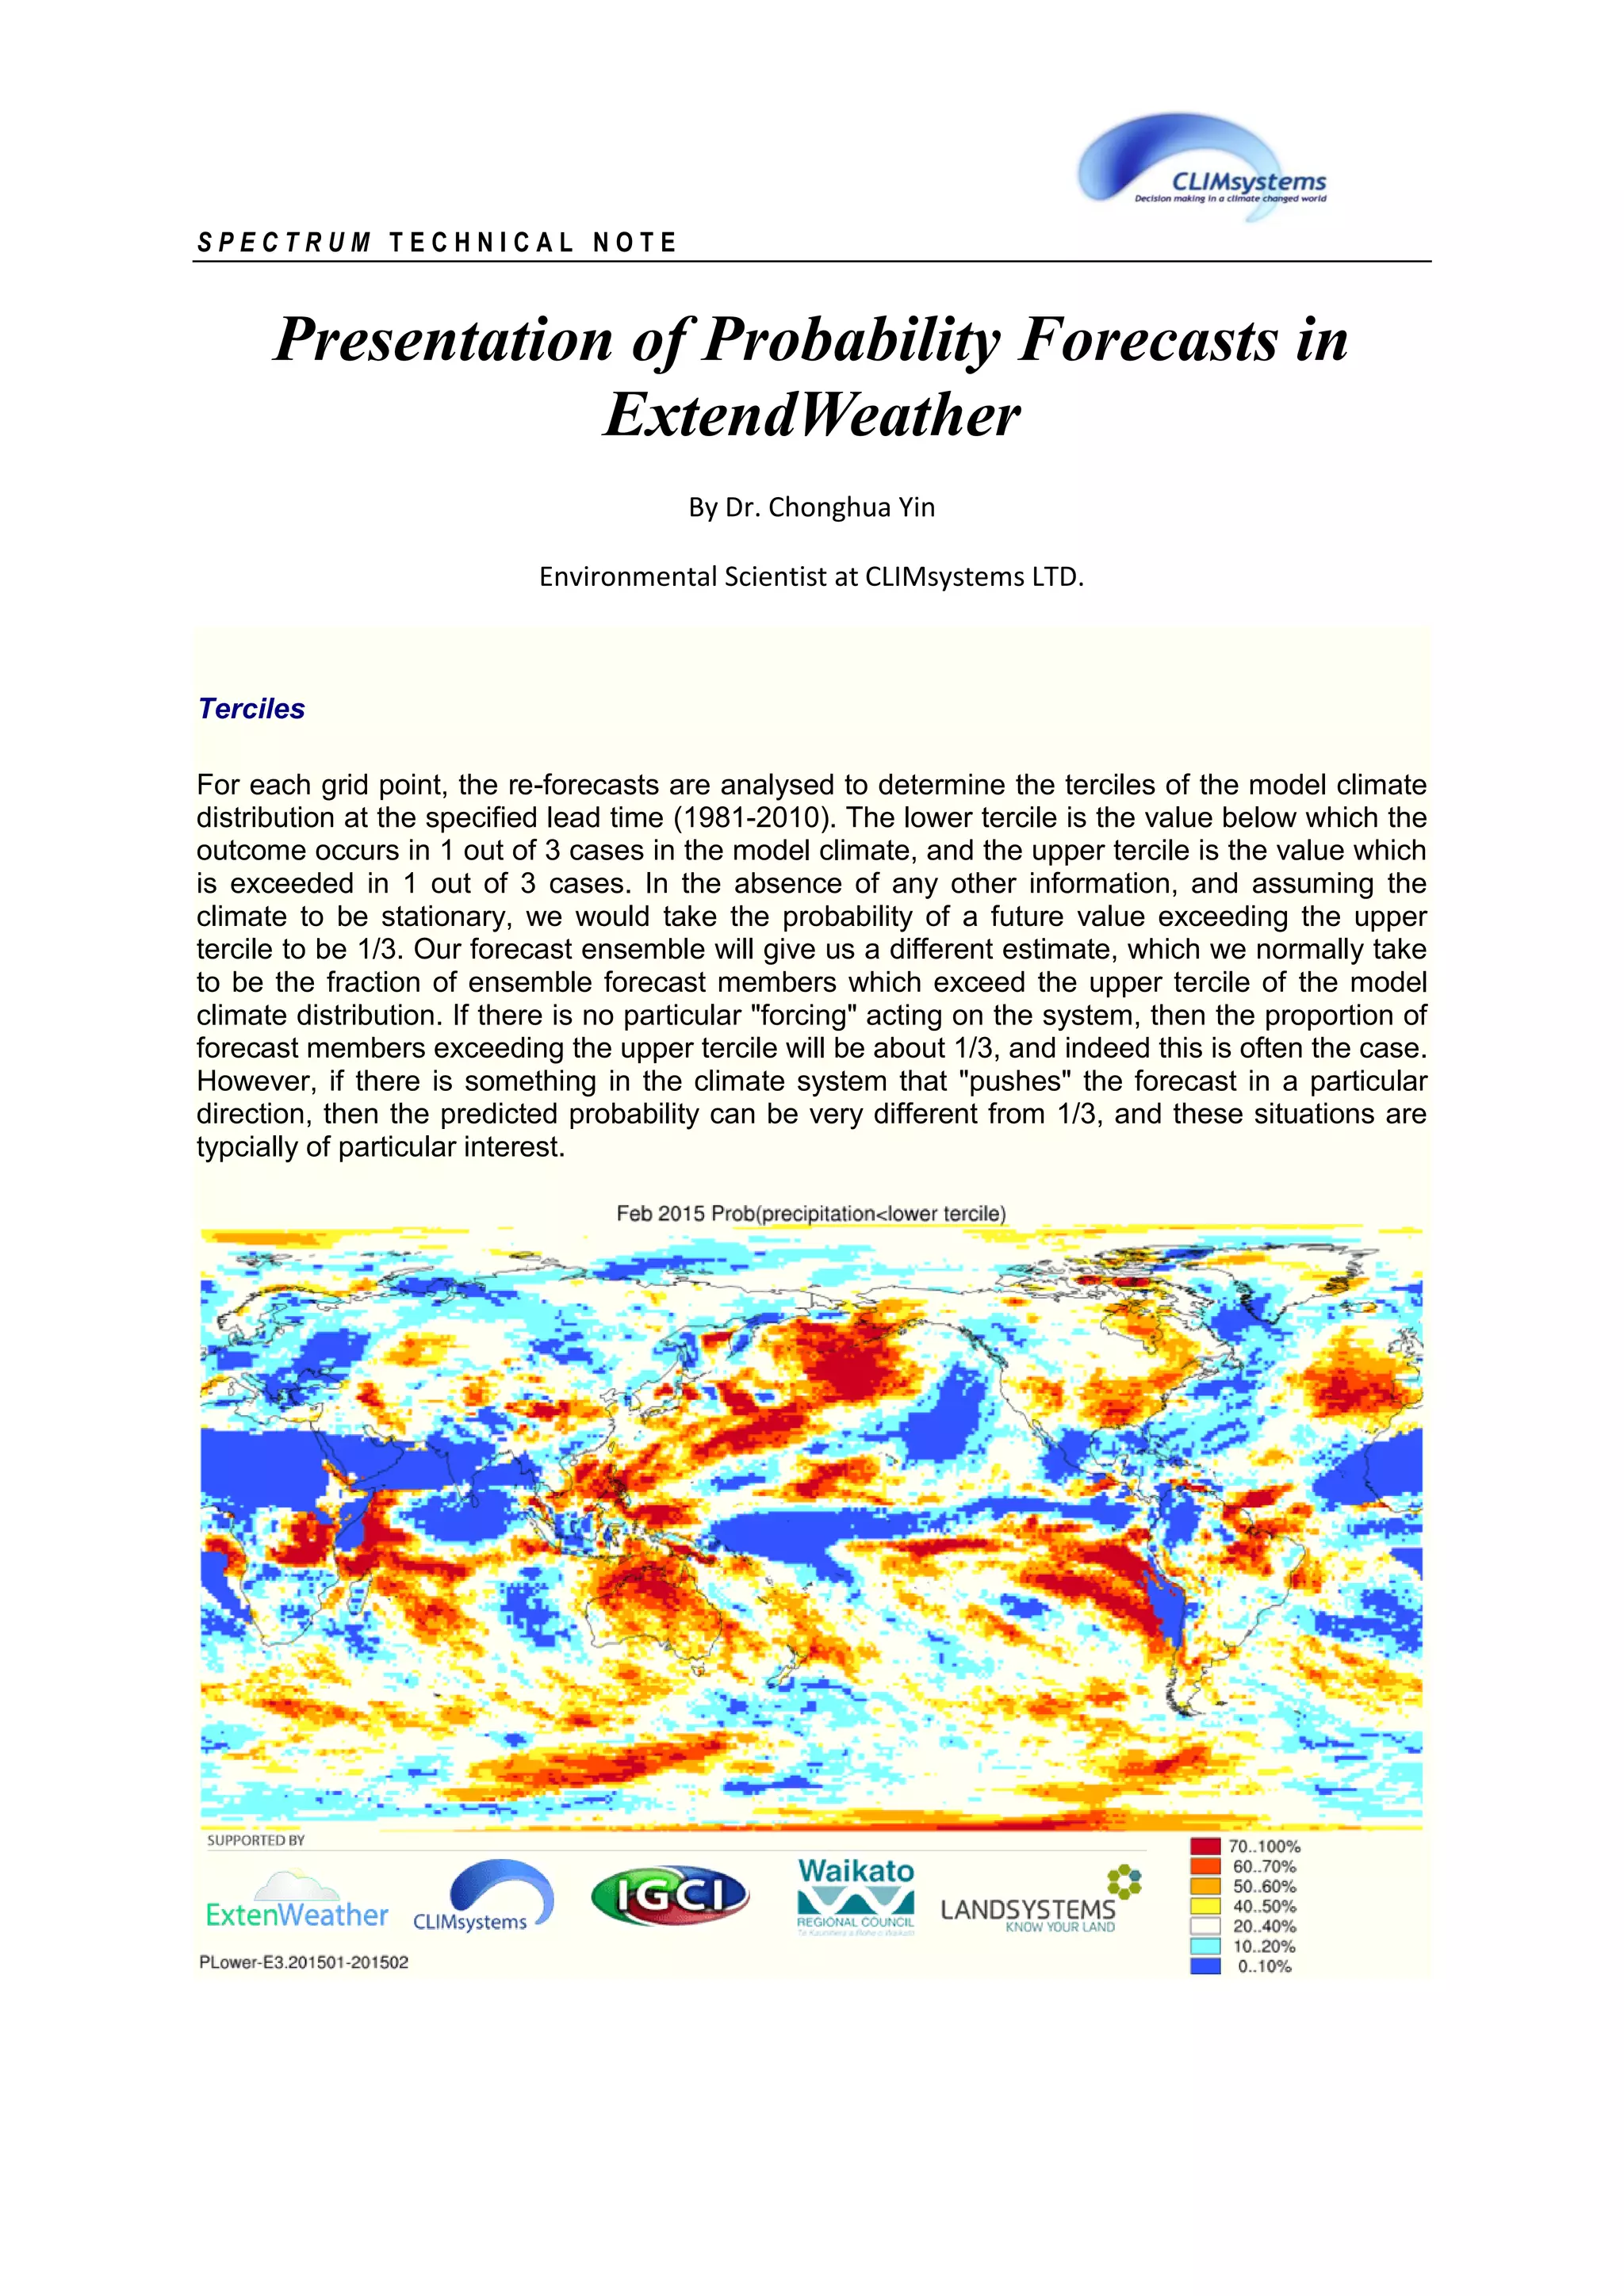
The document discusses different methods for presenting probability forecasts in ExtendWeather:
1) Terciles divide the model climate distribution into thirds, and forecasts show the probability of exceeding the upper tercile.
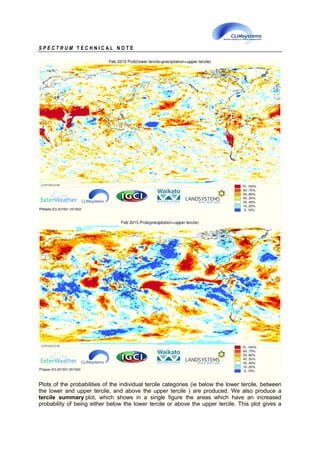
2) Plots show probabilities of variables falling into different terciles.
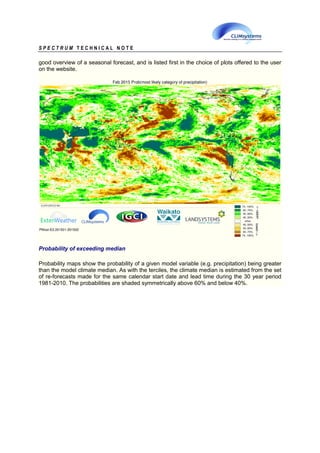
3) Probabilities of exceeding the median are also shown, with areas above 60% and below 40% highlighted.
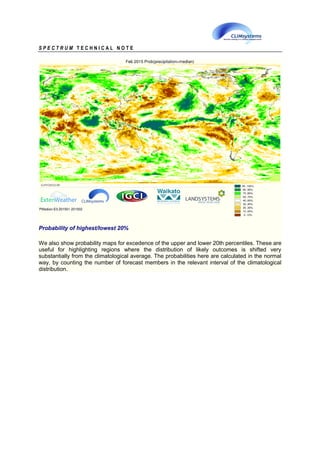
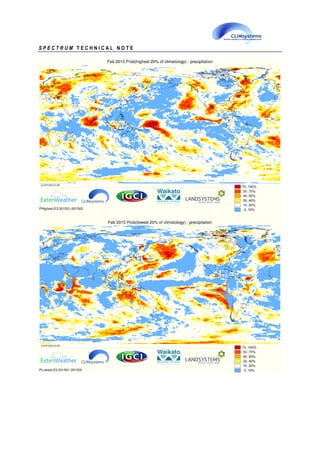
4) Probabilities of the highest and lowest 20% are presented to identify substantially shifted distributions.