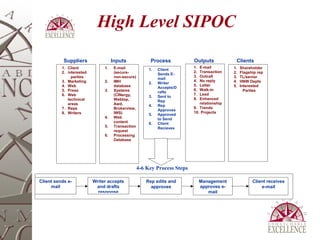
Flagship E-mail Turnaround Project  Control Tollgate Presentation
Team Charter   Executive Summary The goal of the Flagship E-mail team is to respond to 100% of client e-mails within 48 hours.  In the current work environment the group is only responding to about 55% of e-mails within this timeframe.  This project will reduce the percentage of defects from 45% to 28%. Business Problem/Opportunity Within the current environment there are:             Forty-five percent of client e-mails are responded to in greater than 48 hours.             Delays within the e-mail process.             Increased cycle-times for e-mail received after hours.             Large overtime and contingency requirements to manage daily volumes.             High defect rates/low sigma ratings for turnaround times.             Client dissatisfaction with prolonged response times.   Project Benefits The Primary goal of this project is to reduce cycle-time for Flagship e-mails.             Save costs by reducing reliance on overtime and phone assistance.             Increase client satisfaction by more efficiently responding to inquiries.             Reduce or eliminate rework by lowering departmental “redundancy” rates. While the department goal is to respond to 100% of e-mails in 48 hours, the goal of this project is to achieve a 72% rate.  This project was initiated as a result of Voice of the Business feedback.
High Level SIPOC
74 VOC items pertaining to HNW e-mails received between 3/2001 and 2/2003. 34 of 74 were negative feedback regarding e-mail turnaround times. 15 of 34 were from Flagship clients. “ Two to three days is unacceptable.” “ Client doesn’t like how long it takes to send and receive e-mail.” “ E-mails should be handled in a more timely manner.” “ E-mail responses take too long.” Reactive VOC Data
Client Expectations “ The promptness of the service should be improved” “ Why would I use e mail when I can get to someone immediately by phone? I find e-mail the most effective way of communicating IF people answer promptly.” “ I have no problems with the response time nor the quality of the responses.” “ E-mail is intended as a responsive medium. Vanguard's policy of answering within 2 business days is poor and very poor relative to your competition.” *Survey developed by Web Services Response Label Frequency Percentage Adjusted Percentage Within 8 hours after sending the e-mail 94 12.58 12.97 Within 24 hours after sending the e-mail 407 54.48 56.14 Within 48 hours after sending the e-mail 159 21.29 21.93 Within 72 hours after sending the e-mail 22 2.95 3.03 Other, (please specify): 43 5.76 5.93 Total 725 97.05 100.00
Data Collection Plan
Analyze Phase Progress to date: Completed Analyze phase on 5-9-2003 Control charts, pareto charts and process step comparisons will drive Improve phase Major process delays identified in 4 of 10 steps Assigned to Business Unit Assigned to Representative Accepted by Representative *Assigned to other unit *limited control for this status
Analysis Sampled 812 e-mails out of population of 25,800 to determine which e-mail statuses contribute most to process delays.  The process is comprised of 12 distinct process statuses.  The findings of this analysis follow: Status 1: “Assigned to Business” 124 e-mails remained in this status over 48 hours 55 e-mails remained in this status between 40 and 48 hours Average turnaround in this status is 16.54 hours Status 4: “Assigned to Representative” 35 e-mails remained in this status over 48 hours 25 items remained in this status between 40 and 48 hours Status 5: “Accepted by Representative” 11 e-mails remained in this status over 48 hours 15 e-mails remained in this status between 20 and 48 hours Of 812 sampled items, 21% remained within one status for over 48 hours. Of 812 sampled items, 31% remained within one status for over 40 hours. Sampled 1067 e-mails out of population of 25,800 to determine which
Process Defects 58% of defects within the process sample were received Friday through Sunday.
Improve Phase Progress to date: Utilized three distinct pilots to achieve results. Improve phase was completed on 6/20/2003.
Pilot Summary Pilot 1:  Weekend Pilot Criteria:   All e-mails with exception of “relationship” topics will bypass assigned phone reps. Staffing for each Saturday will increase to 2 FTEs. Measure: During pilot phase the number of e-mails sent on Saturdays increased from 2.4% of volume to 8.3% of total volume. Result: Resulted in 69 less defects during pilot, or a reduction of 4.5%
Pilot Pre-Pilot 1.61 Sigma 2.09 Sigma Special cause data points include items sent to other departments, July 4 holiday, and the loss of 1 FTE to disability.
Pilot Success For period of 6/19 – 7/8 the defect rate for Flagship dropped by 38%. (45% to 28%) Average turnaround for the pilot dropped from 42 hours to 29 hours. 12.67% of all e-mails were sent via “Weekday” or “Weekend” pilots. Value Added = $276,000 annually. Lost productivity and Contingency coverage ($158k) Voyager Coverage Does not include Flagship Contingency Reduced rework ($49k) Kickbacks to Writer Bypass Approvals Overtime costs ($69k)
Sigma Shifts from 1.61 to 2.09. Client Compliments “ Please extend my sincere thanks to Kim Acosta for taking the time to reply in your absence with a very extensive and very clear message regarding my query on various stop orders.” “ And it was a delightful surprise to get the response on the weekend.”   No Negative Feedback from Clients! Pilot Success

Contact Center Six Sigma Summary

  • 1.
    Flagship E-mail TurnaroundProject Control Tollgate Presentation
  • 2.
    Team Charter  Executive Summary The goal of the Flagship E-mail team is to respond to 100% of client e-mails within 48 hours. In the current work environment the group is only responding to about 55% of e-mails within this timeframe. This project will reduce the percentage of defects from 45% to 28%. Business Problem/Opportunity Within the current environment there are:            Forty-five percent of client e-mails are responded to in greater than 48 hours.            Delays within the e-mail process.            Increased cycle-times for e-mail received after hours.            Large overtime and contingency requirements to manage daily volumes.            High defect rates/low sigma ratings for turnaround times.            Client dissatisfaction with prolonged response times.   Project Benefits The Primary goal of this project is to reduce cycle-time for Flagship e-mails.            Save costs by reducing reliance on overtime and phone assistance.            Increase client satisfaction by more efficiently responding to inquiries.            Reduce or eliminate rework by lowering departmental “redundancy” rates. While the department goal is to respond to 100% of e-mails in 48 hours, the goal of this project is to achieve a 72% rate. This project was initiated as a result of Voice of the Business feedback.
  • 3.
  • 4.
    74 VOC itemspertaining to HNW e-mails received between 3/2001 and 2/2003. 34 of 74 were negative feedback regarding e-mail turnaround times. 15 of 34 were from Flagship clients. “ Two to three days is unacceptable.” “ Client doesn’t like how long it takes to send and receive e-mail.” “ E-mails should be handled in a more timely manner.” “ E-mail responses take too long.” Reactive VOC Data
  • 5.
    Client Expectations “The promptness of the service should be improved” “ Why would I use e mail when I can get to someone immediately by phone? I find e-mail the most effective way of communicating IF people answer promptly.” “ I have no problems with the response time nor the quality of the responses.” “ E-mail is intended as a responsive medium. Vanguard's policy of answering within 2 business days is poor and very poor relative to your competition.” *Survey developed by Web Services Response Label Frequency Percentage Adjusted Percentage Within 8 hours after sending the e-mail 94 12.58 12.97 Within 24 hours after sending the e-mail 407 54.48 56.14 Within 48 hours after sending the e-mail 159 21.29 21.93 Within 72 hours after sending the e-mail 22 2.95 3.03 Other, (please specify): 43 5.76 5.93 Total 725 97.05 100.00
  • 6.
  • 7.
    Analyze Phase Progressto date: Completed Analyze phase on 5-9-2003 Control charts, pareto charts and process step comparisons will drive Improve phase Major process delays identified in 4 of 10 steps Assigned to Business Unit Assigned to Representative Accepted by Representative *Assigned to other unit *limited control for this status
  • 8.
    Analysis Sampled 812e-mails out of population of 25,800 to determine which e-mail statuses contribute most to process delays. The process is comprised of 12 distinct process statuses. The findings of this analysis follow: Status 1: “Assigned to Business” 124 e-mails remained in this status over 48 hours 55 e-mails remained in this status between 40 and 48 hours Average turnaround in this status is 16.54 hours Status 4: “Assigned to Representative” 35 e-mails remained in this status over 48 hours 25 items remained in this status between 40 and 48 hours Status 5: “Accepted by Representative” 11 e-mails remained in this status over 48 hours 15 e-mails remained in this status between 20 and 48 hours Of 812 sampled items, 21% remained within one status for over 48 hours. Of 812 sampled items, 31% remained within one status for over 40 hours. Sampled 1067 e-mails out of population of 25,800 to determine which
  • 9.
    Process Defects 58%of defects within the process sample were received Friday through Sunday.
  • 10.
    Improve Phase Progressto date: Utilized three distinct pilots to achieve results. Improve phase was completed on 6/20/2003.
  • 11.
    Pilot Summary Pilot1: Weekend Pilot Criteria: All e-mails with exception of “relationship” topics will bypass assigned phone reps. Staffing for each Saturday will increase to 2 FTEs. Measure: During pilot phase the number of e-mails sent on Saturdays increased from 2.4% of volume to 8.3% of total volume. Result: Resulted in 69 less defects during pilot, or a reduction of 4.5%
  • 12.
    Pilot Pre-Pilot 1.61Sigma 2.09 Sigma Special cause data points include items sent to other departments, July 4 holiday, and the loss of 1 FTE to disability.
  • 13.
    Pilot Success Forperiod of 6/19 – 7/8 the defect rate for Flagship dropped by 38%. (45% to 28%) Average turnaround for the pilot dropped from 42 hours to 29 hours. 12.67% of all e-mails were sent via “Weekday” or “Weekend” pilots. Value Added = $276,000 annually. Lost productivity and Contingency coverage ($158k) Voyager Coverage Does not include Flagship Contingency Reduced rework ($49k) Kickbacks to Writer Bypass Approvals Overtime costs ($69k)
  • 14.
    Sigma Shifts from1.61 to 2.09. Client Compliments “ Please extend my sincere thanks to Kim Acosta for taking the time to reply in your absence with a very extensive and very clear message regarding my query on various stop orders.” “ And it was a delightful surprise to get the response on the weekend.”  No Negative Feedback from Clients! Pilot Success

Editor's Notes

  • #3 40% defects over 4 th quarter 2002. Project will reduce to 25% based on 48 hour allowable turnaround. Overtime costs will be reduced by 25% Cost of poor quality: 2002 overtime: over $45,000 for the year. FS & Voyager Backup during weekdays: Estimated at over $150,000 per year in lost productivity. Total of $195,000 per year in Cost of Poor Quality. Savings of 25%=$49,000 Savings of 50%= $97,000
  • #6 Refer to actual survey:
  • #10 Illustration of all defects within sample 42% overall defect rate for the sample, which is consistent with the total population. 58% of all defects are from e-mails received on a weekend (Friday, Saturday, Sunday)