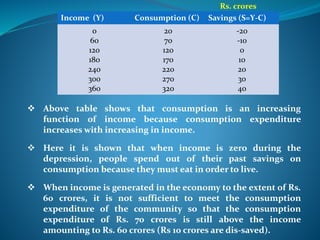
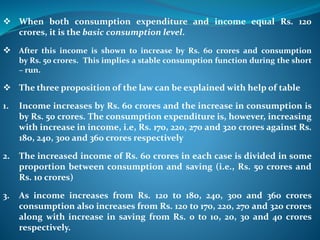
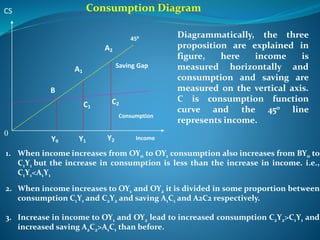
KEYNES PSYCHOLOGICAL LAW OF CONSUMPTION
Introduction
 John Maynard Keynes was the greatest and the most eminent
economist of the 20th century.
 His greatest work, “General Theory of Employment, Interest and
Money” popularly known as ‘General Theory’ published in 1936 is
an important landmark in the modern economic science.
 Keynes General Theory is given today the same status as
Admsmith’s Wealth of Nation in the eighteenth century and Karl
Mark’s Das Capital in the nineteenth century.
Meaning of Consumption Function
 The consumption function or propensity to consume refers to
income consumption relationship.
 It is a functional relationship between two aggregates, i.e.,
total consumption and gross national income
 Symbolically, the relationship is represented as
C = f(Y),
Where C is consumption, Y is Income and f is functional
relationship.
Thus the consumption function indicates a functional
relationship between C and Y. This relationship is based on
the other things being equal assumption.
 According to Keynes, even if income is zero, there will be
consumption and such consumption is called ‘Autonomous
Consumption’ which can be represented as ‘a’ this means that
consumption is always positive.
 Increasing in consumption due to an increase in income is
called ‘Induced Consumption’
C = a+b (Y)
 The psychological law of consumption which forms the basis
of the consumption function. He wrote “Men are disposed as
rule and on the overage to increase their consumption as their
income increases but not by as much as the increase in
their income.
 The law implies that there is a tendency on the part of the
people to spend on the consumption less than the full
increment of income.
Propositions of the Law
This law has three related proposition
1. When income increases consumption expenditure also increases
but by smaller amount.
2. The increased will be divided in some proportion between
consumption expenditure and saving.
3. Increase in income always leads to an increase in both
consumption and saving.
 Above table shows that consumption is an increasing
function of income because consumption expenditure
increases with increasing in income.
 Here it is shown that when income is zero during the
depression, people spend out of their past savings on
consumption because they must eat in order to live.
 When income is generated in the economy to the extent of Rs.
60 crores, it is not sufficient to meet the consumption
expenditure of the community so that the consumption
expenditure of Rs. 70 crores is still above the income
amounting to Rs. 60 crores (Rs 10 crores are dis-saved).
Income (Y) C0nsumption (C) Savings (S=Y-C)
0
60
120
180
240
300
360
20
70
120
170
220
270
320
-20
-10
0
10
20
30
40
Rs. crores
 When both consumption expenditure and income equal Rs. 120
crores, it is the basic consumption level.
 After this income is shown to increase by Rs. 60 crores and consumption
by Rs. 50 crores. This implies a stable consumption function during the short
– run.
 The three proposition of the law can be explained with help of table
1. Income increases by Rs. 60 crores and the increase in consumption is
by Rs. 50 crores. The consumption expenditure is, however, increasing
with increase in income, i.e, Rs. 170, 220, 270 and 320 crores against Rs.
180, 240, 300 and 360 crores respectively
2. The increased income of Rs. 60 crores in each case is divided in some
proportion between consumption and saving (i.e., Rs. 50 crores and
Rs. 10 crores)
3. As income increases from Rs. 120 to 180, 240, 300 and 360 crores
consumption also increases from Rs. 120 to 170, 220, 270 and 320 crores
along with increase in saving from Rs. 0 to 10, 20, 30 and 40 crores
respectively.
450
Saving Gap
Consumption
B
A1
A2
C1
C2
Y0 Y1 Y2 Income
CS
0
Consumption Diagram
Diagrammatically, the three
proposition are explained in
figure, here income is
measured horizontally and
consumption and saving are
measured on the vertical axis.
C is consumption function
curve and the 450 line
represents income.
1. When income increases from OY0 to OY1 consumption also increases from BY0 to
C1Y1 but the increase in consumption is less than the increase in income. i.e.,
C1Y1<A1Y1
2. When income increases to OY1 and OY2 it is divided in some proportion between
consumption C1Y1 and C2Y2 and saving A1C1 and A2C2 respectively.
3. Increase in income to OY1 and OY2 lead to increased consumption C2Y2>C1Y1 and
increased saving A2C2>A1C1 than before.
Assumption of the Law
1. It assumes a constant psychological and institutional complex
2. It assumes the existence of normal condition
3. It assumes the existence of a Laissez-faire Capitalist Economy.
Consumption function

Consumption function

  • 2.
    KEYNES PSYCHOLOGICAL LAWOF CONSUMPTION Introduction  John Maynard Keynes was the greatest and the most eminent economist of the 20th century.  His greatest work, “General Theory of Employment, Interest and Money” popularly known as ‘General Theory’ published in 1936 is an important landmark in the modern economic science.  Keynes General Theory is given today the same status as Admsmith’s Wealth of Nation in the eighteenth century and Karl Mark’s Das Capital in the nineteenth century.
  • 3.
    Meaning of ConsumptionFunction  The consumption function or propensity to consume refers to income consumption relationship.  It is a functional relationship between two aggregates, i.e., total consumption and gross national income  Symbolically, the relationship is represented as C = f(Y), Where C is consumption, Y is Income and f is functional relationship. Thus the consumption function indicates a functional relationship between C and Y. This relationship is based on the other things being equal assumption.
  • 4.
     According toKeynes, even if income is zero, there will be consumption and such consumption is called ‘Autonomous Consumption’ which can be represented as ‘a’ this means that consumption is always positive.  Increasing in consumption due to an increase in income is called ‘Induced Consumption’ C = a+b (Y)  The psychological law of consumption which forms the basis of the consumption function. He wrote “Men are disposed as rule and on the overage to increase their consumption as their income increases but not by as much as the increase in their income.  The law implies that there is a tendency on the part of the people to spend on the consumption less than the full increment of income.
  • 5.
    Propositions of theLaw This law has three related proposition 1. When income increases consumption expenditure also increases but by smaller amount. 2. The increased will be divided in some proportion between consumption expenditure and saving. 3. Increase in income always leads to an increase in both consumption and saving.
  • 6.
     Above tableshows that consumption is an increasing function of income because consumption expenditure increases with increasing in income.  Here it is shown that when income is zero during the depression, people spend out of their past savings on consumption because they must eat in order to live.  When income is generated in the economy to the extent of Rs. 60 crores, it is not sufficient to meet the consumption expenditure of the community so that the consumption expenditure of Rs. 70 crores is still above the income amounting to Rs. 60 crores (Rs 10 crores are dis-saved). Income (Y) C0nsumption (C) Savings (S=Y-C) 0 60 120 180 240 300 360 20 70 120 170 220 270 320 -20 -10 0 10 20 30 40 Rs. crores
  • 7.
     When bothconsumption expenditure and income equal Rs. 120 crores, it is the basic consumption level.  After this income is shown to increase by Rs. 60 crores and consumption by Rs. 50 crores. This implies a stable consumption function during the short – run.  The three proposition of the law can be explained with help of table 1. Income increases by Rs. 60 crores and the increase in consumption is by Rs. 50 crores. The consumption expenditure is, however, increasing with increase in income, i.e, Rs. 170, 220, 270 and 320 crores against Rs. 180, 240, 300 and 360 crores respectively 2. The increased income of Rs. 60 crores in each case is divided in some proportion between consumption and saving (i.e., Rs. 50 crores and Rs. 10 crores) 3. As income increases from Rs. 120 to 180, 240, 300 and 360 crores consumption also increases from Rs. 120 to 170, 220, 270 and 320 crores along with increase in saving from Rs. 0 to 10, 20, 30 and 40 crores respectively.
  • 8.
    450 Saving Gap Consumption B A1 A2 C1 C2 Y0 Y1Y2 Income CS 0 Consumption Diagram Diagrammatically, the three proposition are explained in figure, here income is measured horizontally and consumption and saving are measured on the vertical axis. C is consumption function curve and the 450 line represents income. 1. When income increases from OY0 to OY1 consumption also increases from BY0 to C1Y1 but the increase in consumption is less than the increase in income. i.e., C1Y1<A1Y1 2. When income increases to OY1 and OY2 it is divided in some proportion between consumption C1Y1 and C2Y2 and saving A1C1 and A2C2 respectively. 3. Increase in income to OY1 and OY2 lead to increased consumption C2Y2>C1Y1 and increased saving A2C2>A1C1 than before.
  • 9.
    Assumption of theLaw 1. It assumes a constant psychological and institutional complex 2. It assumes the existence of normal condition 3. It assumes the existence of a Laissez-faire Capitalist Economy.