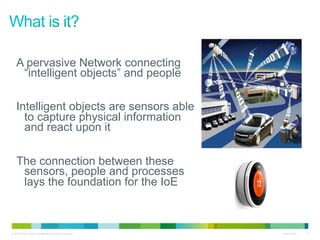
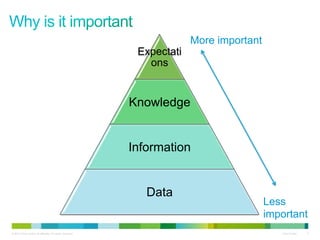
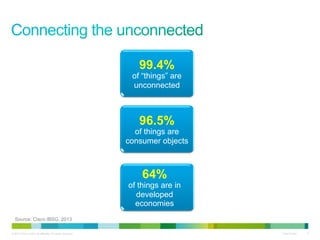
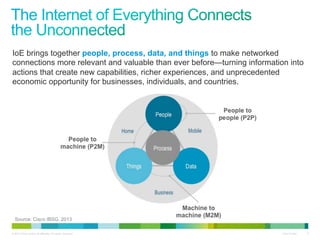
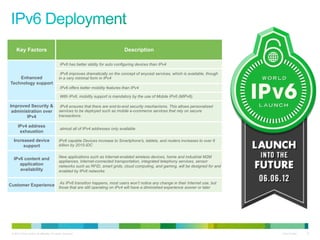
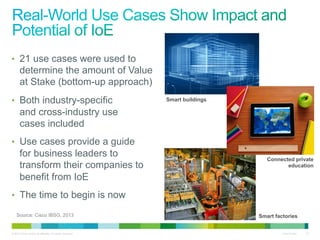
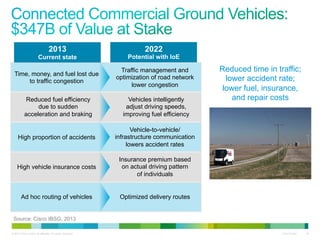
Connecting the
Unconnected
New opportunities enabled by the Internet
of Everything
Niccolò Aterini
Network Consulting Engineer
naterini@cisco.com
© 2013 Cisco and/or its affiliates. All rights reserved.

Fabrizio Pappalardo
Product Manager
fpappala@cisco.com
Cisco Public

1
© 2013 Cisco and/or its affiliates. All rights reserved.

Cisco Public

2
A pervasive Network connecting
“intelligent objects” and people
Intelligent objects are sensors able
to capture physical information
and react upon it
The connection between these
sensors, people and processes
lays the foundation for the IoE

© 2013 Cisco and/or its affiliates. All rights reserved.

Cisco Public

3
Expectati
ons

More important

Knowledge
Information
Data

© 2013 Cisco and/or its affiliates. All rights reserved.

Less
important
Cisco Public

4
99.4%

of “things” are
unconnected

96.5%

of things are
consumer objects

64%

of things are in
developed
economies
Source: Cisco IBSG, 2013
© 2013 Cisco and/or its affiliates. All rights reserved.

Cisco Public

5
IoE brings together people, process, data, and things to make networked
connections more relevant and valuable than ever before—turning information into
actions that create new capabilities, richer experiences, and unprecedented
economic opportunity for businesses, individuals, and countries.

Source: Cisco IBSG, 2013
© 2013 Cisco and/or its affiliates. All rights reserved.

Cisco Public

6
© 2013 Cisco and/or its affiliates. All rights reserved.

Cisco Public

7
New things
The Network
Cloud

© 2013 Cisco and/or its affiliates. All rights reserved.

Cisco Public

8
•  Smartphones&Tablets

•  New Devices&Sensors

•  Open source

© 2013 Cisco and/or its affiliates. All rights reserved.

Cisco Public

9
Smart Industry

Smart Homes

Established

Smart Offices

Growing from Trillions to Tens of Trillions

Smart Car

Smart Health

Emerging

Smart Agriculture

Growing from Billions to Trillions
Sources: Machina Research
© 2013 Cisco and/or its affiliates. All rights reserved.

Cisco Public

10
Bits/ps

Service
Provider

Voice
Video
Data
Mobile

Service
Provider

Smart Energy

Smart Health

Smart Industry
© 2013 Cisco and/or its affiliates. All rights reserved.

Bandwidth
(Cost Reduction and Speed)

Multi-service Consumer
(Prioritization and Agility)

Smart Homes

Service
Provider

Smart Car

Programmable Triggers
of Event- Driven Services
(Adaptation Rates and Automation)

Smart Offices
Cisco Public

11
Key Factors

Description
IPv6 has better ability for auto configuring devices than IPv4

Enhanced
Technology support

IPv6 improves dramatically on the concept of anycast services, which is available, though
in a very minimal form in IPv4
IPv6 offers better mobility features than IPv4
With IPv6, mobility support is mandatory by the use of Mobile IPv6 (MIPv6).

Improved Security &
administration over
IPv4
IPv4 address
exhaustion

IPv6 ensures that there are end-to-end security mechanisms. This allows personalized
services to be deployed such as mobile e-commerce services that rely on secure
transactions.
almost all of IPv4 addresses only available

Increased device
support

IPv6 capable Devices increase to Smartphone's, tablets, and routers increases to over 6
billion by 2015-IDC

IPv6 content and
application
availability

New applications such as Internet-enabled wireless devices, home and industrial M2M
appliances, Internet-connected transportation, integrated telephony services, sensor
networks such as RFID, smart grids, cloud computing, and gaming, will be designed for and
enabled by IPv6 networks

Customer Experience

As IPv6 transition happens, most users won’t notice any change in their Internet use, but
those that are still operating on IPv4 will have a diminished experience sooner or later

© 2013 Cisco and/or its affiliates. All rights reserved.

Cisco Public

12
What	
  is	
  LISP	
  

What	
  LISP	
  Provides	
  

1.	
  Topology	
  independent	
  rouNng	
  

1. 

Mobility	
  à	
  IP	
  prefix	
  and	
  address	
  family	
  Portability	
  

2.	
  On-­‐demand	
  route	
  look	
  up	
  

2. 

Scalability	
  	
  à	
  	
  On-­‐demand	
  RouNng	
  and	
  aggregaNon	
  

3.	
  Map	
  and	
  Encapsulate	
  

3. 

Security	
  	
  à	
  Tenant	
  ID	
  based	
  segmentaNon	


Flexible	
  Distributed	
  
Database	


A"er	
  

Before	
  

Prefix	


  RLOC	
  
189.16.17.89	


  171.68.226.120	
  
22.78.190.64	


  171.68.226.121	
  
172.16.19.90	


  171.68.226.120	
  
22.78.190.64	


  171.68.226.121	
  

Prefix	


  Next-­‐hop	
  
189.16.17.89	


  171.68.226.120	
  
22.78.190.64	


  171.68.226.121	
  
172.16.19.90	


  171.68.226.120	
  
192.58.28.128	


  171.68.228.121	
  

Prefix	


  Next-­‐hop	
  
189.16.17.89	


  171.68.226.120	
  
22.78.190.64	


  171.68.226.121	
  
172.16.19.90	


  171.68.226.120	
  
192.58.28.128	


  171.68.228.121	
  
189.16.17.89	


  171.68.226.120	
  
22.78.190.64	


  171.68.226.121	
  
172.16.19.90	


  171.68.226.120	
  
192.58.28.128	


  171.68.228.121	
  
189.16.17.89	


  171.68.226.120	
  
22.78.190.64	


  171.68.226.121	
  
172.16.19.90	


  171.68.226.120	
  
192.58.28.128	


  171.68.228.121	
  
189.16.17.89	


  171.68.226.120	
  
22.78.190.64	


  171.68.226.121	
  
172.16.19.90	


  171.68.226.120	
  
192.58.28.128	


  171.68.228.121	
  

Prefix	


  Next-­‐hop	
  

Topology	
  +	
  end	
  
point	
  routes	
  

189.16.17.89	


  171.68.226.120	
  
22.78.190.64	


  171.68.226.121	
  
172.16.19.90	


  171.68.226.120	
  
192.58.28.128	


  171.68.228.121	
  
189.16.17.89	


  171.68.226.120	
  
22.78.190.64	


  171.68.226.121	
  
172.16.19.90	


  171.68.226.120	
  
192.58.28.128	


  171.68.228.121	
  
189.16.17.89	


  171.68.226.120	
  
22.78.190.64	


  171.68.226.121	
  
172.16.19.90	


  171.68.226.120	
  
192.58.28.128	


  171.68.228.121	
  
189.16.17.89	


  171.68.226.120	
  
22.78.190.64	


  171.68.226.121	
  
172.16.19.90	


  171.68.226.120	
  
192.58.28.128	


  171.68.228.121	
  

Topology	
  Routes	
  

© 2013 Cisco and/or its affiliates. All rights reserved.

End	
  Point	
  
Routes	
  
consolidated	
  to	
  
LISP	
  DB	
  

Prefix	


  Next-­‐hop	
  
189.16.17.89	


  171.68.226.120	
  
22.78.190.64	


  171.68.226.121	
  
172.16.19.90	


  171.68.226.120	
  
192.58.28.128	


  171.68.228.121	
  

Prefix	


  Next-­‐hop	
  
189.16.17.89	


  171.68.226.120	
  
22.78.190.64	


  171.68.226.121	
  
172.16.19.90	


  171.68.226.120	
  

Reduced	
  
Routes	
  

192.58.28.128	


  171.68.228.121	
  

End	
  	
  Point	
  Routes	
  

Cisco Public

13
•  Today CPUs power brings higher

computational availability
•  New computing and storage

virtualization technologies allow
resources aggregation and
segmentation
•  Higher Reliability for business continuity

and disaster recovery.

© 2013 Cisco and/or its affiliates. All rights reserved.

Cisco Public

14
Network
(Bandwidth)
Flexible, High-performance, Network Fabric

Tightly Integrated Network, Storage, Compute and Applications
Common Operational Model across All Environments
Data Centre
(Compute + Storage)

Open

Applications
(Control)

Programmable

© 2013 Cisco and/or its affiliates. All rights reserved.

Virtualized

Elastic

Resilient

Secure
Cisco Public

15
© 2013 Cisco and/or its affiliates. All rights reserved.

Cisco Public

16
The potential bottom-line value (higher revenues and lower
costs) that can be created or will migrate among companies
and industries based on their ability to harness IoE over the
next decade (2013-2022)
Includes
• 
• 
• 
• 
• 

Shifts of benefits among competing firms in an industry
Shifts of benefits among different industries
New-to-the-world revenue growth from innovation
Cost savings from more efficient processes
Allowances for implementation costs

Does not include
• 
• 
• 
• 

Extent of losses at firms that don’t transform
Consumer or government value creation (private-sector focus)
Social benefits
Value estimates for reduced risk of operations

Source: Cisco IBSG, 2013
© 2013 Cisco and/or its affiliates. All rights reserved.

Cisco Public

17
$14.4 trillion

$9.5 trillion

$4.9 trillion

From industry-specific
use cases (66%):
smart grid, connected
commercial vehicles, etc.

From cross-industry
use cases (34%):
future of work (telecommuting),
travel avoidance, etc.

IoE represents an opportunity to grow aggregate global
corporate profits ~21% by 2022
Source: Cisco IBSG, 2013
© 2013 Cisco and/or its affiliates. All rights reserved.

Cisco Public

18
Asset utilization:
$2.5T

IoE net
Value at
Stake
(2013-2022
10-year
NPV)*

•  SG&A and CoGS reduction from
improved business process execution
•  Improved capital efficiency

Employee productivity:
$2.5T

•  Improved labor efficiency
•  Fewer or more productive man-hours

Supply-chain / logistics
efficiency: $2.7T

•  Improved process efficiency
•  Reduced waste in supply chain

Improved customer
experience: $3.7T

* Net present value

Innovation: $3.0T

•  Improved customer lifetime value
•  Additional market share (more
customers)
•  Improved RD&E speed, reduced TTM
•  New business models and new sources
of revenue

Source: Cisco IBSG, 2013
© 2013 Cisco and/or its affiliates. All rights reserved.

Cisco Public

19
50.0%

Degree of impact
(Value at Stake / industry size)

45.0%

Japan
($0.7T)

40.0%

United States
($4.6T)

35.0%
Canada
($0.4T)

30.0%

Western and
Eastern Europe
($4.3T)

25.0%
20.0%
15.0%

China
($1.8T)

10.0%

Spheres sized by
amount of Value at Stake

5.0%

Rest of world
($2.6T)

0.0%
$0

$5,000

$10,000

$15,000

$20,000

$25,000

Geography size (value added $B)
Source: Cisco IBSG, 2013
© 2013 Cisco and/or its affiliates. All rights reserved.

Cisco Public

20
100.0%

Degree of impact
(Value at Stake / industry size)

90.0%
Information
services (9%)

80.0%

Spheres sized by
amount of Value at Stake

70.0%
60.0%
Administration

50.0%
40.0%

20.0%

Retail trade
(11%)

Education

30.0%

Manufacturing
(27%)

Finance and insurance (9%)

Company
management

Healthcare
Professional services
Wholesale

10.0%
0.0%
$0
Source: Cisco IBSG, 2013
© 2013 Cisco and/or its affiliates. All rights reserved.

$2,000

$4,000

$6,000

$8,000

$10,000

Industry size (value added $B)

$12,000

$14,000
Sample	
  Size	
  =	
  807	
  

Cisco Public

21
© 2013 Cisco and/or its affiliates. All rights reserved.

Cisco Public

22
•  21 use cases were used to

determine the amount of Value
at Stake (bottom-up approach)
•  Both industry-specific

Smart buildings

and cross-industry use
cases included
•  Use cases provide a guide

for business leaders to
transform their companies to
benefit from IoE

Connected private
education

•  The time to begin is now
Source: Cisco IBSG, 2013

Smart factories

© 2013 Cisco and/or its affiliates. All rights reserved.

Cisco Public

23
2013

2022

Current state

Potential with IoE

Automated assembly
machines are expensive
and complicated to create
and install

Reduced costs as automated
tools become less expensive
to manufacture / implement

Often inflexible and costly
product-line changes

Increased revenues from
greater product variations

Quality controls rely on
human perception and
dexterity

Sensors compliment humans
to improve product quality

Reliance on low-cost
manufacturing; employees
with IT and data interpretation
skills are costly, scarce
Inefficient use of key
inputs for production; lack
of flexibility among
assembly locations

More intelligent design of
machines; greater control
of instrumentation and
production conditions

Socialization of skills
knowledge flattens skills curve;
maximizes access to human
talent pools at lower costs
Reduced waste (materials,
energy); greater freedom
and agility to reallocate
production / optimize inputs

Source: Cisco IBSG, 2013
© 2013 Cisco and/or its affiliates. All rights reserved.

Cisco Public

24
2013

2022

Current state

Potential with IoE

Vulnerability to faults

Automated detection and
self-healing improve reliability
of the electric network

One-way flow of electricity

Ability to shape electric flows
enables more flexibility,
distributed generation

Production calibrated for peak
demand requires reserves,
causes inefficiencies

Demand-side management
improves generator utilization
and grid efficiency

Variability in renewable
energy sources prevents
adoption

Enables more sustainable
energy sources such as
wind and solar

Connecting sensing,
measurement, and controls
in real time improves
reliability, cost, and alignment
between supply and demand

Source: Cisco IBSG, 2013
© 2013 Cisco and/or its affiliates. All rights reserved.

Cisco Public

25
2013

2022

Current state

Potential with IoE

Time, money, and fuel lost due
to traffic congestion

Traffic management and
optimization of road network
lower congestion

Reduced fuel efficiency
due to sudden
acceleration and braking

Vehicles intelligently
adjust driving speeds,
improving fuel efficiency

High proportion of accidents

Vehicle-to-vehicle/
infrastructure communication
lowers accident rates

High vehicle insurance costs

Insurance premium based
on actual driving pattern
of individuals

Ad hoc routing of vehicles

Optimized delivery routes

Reduced time in traffic;
lower accident rate;
lower fuel, insurance,
and repair costs

Source: Cisco IBSG, 2013
© 2013 Cisco and/or its affiliates. All rights reserved.

Cisco Public

26
2013

Current state

2022

Potential with IoE

Long hospital stays to ensure
patients can thrive at home
after discharge

Shorter hospital stays with
home monitoring systems

Limited number of
conditions with home
monitoring capabilities

Wider number of
conditions with home
monitoring capabilities

Uncoordinated and
manual collection of
patient test records

Single, electronic collection
of patient records

Ad hoc interpretation of
medical test results and
conditions

Standardized treatments
that conform to best
practices

Multiple doctors offering
care in an uncoordinated
manner

Continuous monitoring of
health conditions in a less,
expensive home setting; all
care aspects consolidated
and coordinated

Consolidated, patient-centric
view of all treatment aspects

Source: Cisco IBSG, 2013
© 2013 Cisco and/or its affiliates. All rights reserved.

Cisco Public

27
•  Determine where your business

is today with regard to IoE
•  Understand the role of IT in

enabling your company to benefit
from IoE
•  Consider internal cultural changes

required to embrace IoE

•  Maximize your firm’s security

and privacy capabilities
•  Consider organizational structures

that will best support IoE
© 2013 Cisco and/or its affiliates. All rights reserved.

Cisco Public

28
Thank you.

CommTech Talks: CISCO Connecting the unconnected

  • 1.
    Connecting the Unconnected New opportunitiesenabled by the Internet of Everything Niccolò Aterini Network Consulting Engineer naterini@cisco.com © 2013 Cisco and/or its affiliates. All rights reserved. Fabrizio Pappalardo Product Manager fpappala@cisco.com Cisco Public 1
  • 2.
    © 2013 Ciscoand/or its affiliates. All rights reserved. Cisco Public 2
  • 3.
    A pervasive Networkconnecting “intelligent objects” and people Intelligent objects are sensors able to capture physical information and react upon it The connection between these sensors, people and processes lays the foundation for the IoE © 2013 Cisco and/or its affiliates. All rights reserved. Cisco Public 3
  • 4.
    Expectati ons More important Knowledge Information Data © 2013Cisco and/or its affiliates. All rights reserved. Less important Cisco Public 4
  • 5.
    99.4% of “things” are unconnected 96.5% ofthings are consumer objects 64% of things are in developed economies Source: Cisco IBSG, 2013 © 2013 Cisco and/or its affiliates. All rights reserved. Cisco Public 5
  • 6.
    IoE brings togetherpeople, process, data, and things to make networked connections more relevant and valuable than ever before—turning information into actions that create new capabilities, richer experiences, and unprecedented economic opportunity for businesses, individuals, and countries. Source: Cisco IBSG, 2013 © 2013 Cisco and/or its affiliates. All rights reserved. Cisco Public 6
  • 7.
    © 2013 Ciscoand/or its affiliates. All rights reserved. Cisco Public 7
  • 8.
    New things The Network Cloud ©2013 Cisco and/or its affiliates. All rights reserved. Cisco Public 8
  • 9.
    •  Smartphones&Tablets •  NewDevices&Sensors •  Open source © 2013 Cisco and/or its affiliates. All rights reserved. Cisco Public 9
  • 10.
    Smart Industry Smart Homes Established SmartOffices Growing from Trillions to Tens of Trillions Smart Car Smart Health Emerging Smart Agriculture Growing from Billions to Trillions Sources: Machina Research © 2013 Cisco and/or its affiliates. All rights reserved. Cisco Public 10
  • 11.
    Bits/ps Service Provider Voice Video Data Mobile Service Provider Smart Energy Smart Health SmartIndustry © 2013 Cisco and/or its affiliates. All rights reserved. Bandwidth (Cost Reduction and Speed) Multi-service Consumer (Prioritization and Agility) Smart Homes Service Provider Smart Car Programmable Triggers of Event- Driven Services (Adaptation Rates and Automation) Smart Offices Cisco Public 11
  • 12.
    Key Factors Description IPv6 hasbetter ability for auto configuring devices than IPv4 Enhanced Technology support IPv6 improves dramatically on the concept of anycast services, which is available, though in a very minimal form in IPv4 IPv6 offers better mobility features than IPv4 With IPv6, mobility support is mandatory by the use of Mobile IPv6 (MIPv6). Improved Security & administration over IPv4 IPv4 address exhaustion IPv6 ensures that there are end-to-end security mechanisms. This allows personalized services to be deployed such as mobile e-commerce services that rely on secure transactions. almost all of IPv4 addresses only available Increased device support IPv6 capable Devices increase to Smartphone's, tablets, and routers increases to over 6 billion by 2015-IDC IPv6 content and application availability New applications such as Internet-enabled wireless devices, home and industrial M2M appliances, Internet-connected transportation, integrated telephony services, sensor networks such as RFID, smart grids, cloud computing, and gaming, will be designed for and enabled by IPv6 networks Customer Experience As IPv6 transition happens, most users won’t notice any change in their Internet use, but those that are still operating on IPv4 will have a diminished experience sooner or later © 2013 Cisco and/or its affiliates. All rights reserved. Cisco Public 12
  • 13.
    What  is  LISP   What  LISP  Provides   1.  Topology  independent  rouNng   1.  Mobility  à  IP  prefix  and  address  family  Portability   2.  On-­‐demand  route  look  up   2.  Scalability    à    On-­‐demand  RouNng  and  aggregaNon   3.  Map  and  Encapsulate   3.  Security    à  Tenant  ID  based  segmentaNon       Flexible  Distributed   Database       A"er   Before   Prefix        RLOC   189.16.17.89                                    171.68.226.120   22.78.190.64                                    171.68.226.121   172.16.19.90                                    171.68.226.120   22.78.190.64                                    171.68.226.121   Prefix          Next-­‐hop   189.16.17.89                                    171.68.226.120   22.78.190.64                                    171.68.226.121   172.16.19.90                                    171.68.226.120   192.58.28.128                                171.68.228.121   Prefix          Next-­‐hop   189.16.17.89                                    171.68.226.120   22.78.190.64                                    171.68.226.121   172.16.19.90                                    171.68.226.120   192.58.28.128                                171.68.228.121   189.16.17.89                                    171.68.226.120   22.78.190.64                                    171.68.226.121   172.16.19.90                                    171.68.226.120   192.58.28.128                                171.68.228.121   189.16.17.89                                    171.68.226.120   22.78.190.64                                    171.68.226.121   172.16.19.90                                    171.68.226.120   192.58.28.128                                171.68.228.121   189.16.17.89                                    171.68.226.120   22.78.190.64                                    171.68.226.121   172.16.19.90                                    171.68.226.120   192.58.28.128                                171.68.228.121   Prefix          Next-­‐hop   Topology  +  end   point  routes   189.16.17.89                                    171.68.226.120   22.78.190.64                                    171.68.226.121   172.16.19.90                                    171.68.226.120   192.58.28.128                                171.68.228.121   189.16.17.89                                    171.68.226.120   22.78.190.64                                    171.68.226.121   172.16.19.90                                    171.68.226.120   192.58.28.128                                171.68.228.121   189.16.17.89                                    171.68.226.120   22.78.190.64                                    171.68.226.121   172.16.19.90                                    171.68.226.120   192.58.28.128                                171.68.228.121   189.16.17.89                                    171.68.226.120   22.78.190.64                                    171.68.226.121   172.16.19.90                                    171.68.226.120   192.58.28.128                                171.68.228.121   Topology  Routes   © 2013 Cisco and/or its affiliates. All rights reserved. End  Point   Routes   consolidated  to   LISP  DB   Prefix          Next-­‐hop   189.16.17.89                                    171.68.226.120   22.78.190.64                                    171.68.226.121   172.16.19.90                                    171.68.226.120   192.58.28.128                                171.68.228.121   Prefix          Next-­‐hop   189.16.17.89                                    171.68.226.120   22.78.190.64                                    171.68.226.121   172.16.19.90                                    171.68.226.120   Reduced   Routes   192.58.28.128                                171.68.228.121   End    Point  Routes   Cisco Public 13
  • 14.
    •  Today CPUspower brings higher computational availability •  New computing and storage virtualization technologies allow resources aggregation and segmentation •  Higher Reliability for business continuity and disaster recovery. © 2013 Cisco and/or its affiliates. All rights reserved. Cisco Public 14
  • 15.
    Network (Bandwidth) Flexible, High-performance, NetworkFabric Tightly Integrated Network, Storage, Compute and Applications Common Operational Model across All Environments Data Centre (Compute + Storage) Open Applications (Control) Programmable © 2013 Cisco and/or its affiliates. All rights reserved. Virtualized Elastic Resilient Secure Cisco Public 15
  • 16.
    © 2013 Ciscoand/or its affiliates. All rights reserved. Cisco Public 16
  • 17.
    The potential bottom-linevalue (higher revenues and lower costs) that can be created or will migrate among companies and industries based on their ability to harness IoE over the next decade (2013-2022) Includes •  •  •  •  •  Shifts of benefits among competing firms in an industry Shifts of benefits among different industries New-to-the-world revenue growth from innovation Cost savings from more efficient processes Allowances for implementation costs Does not include •  •  •  •  Extent of losses at firms that don’t transform Consumer or government value creation (private-sector focus) Social benefits Value estimates for reduced risk of operations Source: Cisco IBSG, 2013 © 2013 Cisco and/or its affiliates. All rights reserved. Cisco Public 17
  • 18.
    $14.4 trillion $9.5 trillion $4.9trillion From industry-specific use cases (66%): smart grid, connected commercial vehicles, etc. From cross-industry use cases (34%): future of work (telecommuting), travel avoidance, etc. IoE represents an opportunity to grow aggregate global corporate profits ~21% by 2022 Source: Cisco IBSG, 2013 © 2013 Cisco and/or its affiliates. All rights reserved. Cisco Public 18
  • 19.
    Asset utilization: $2.5T IoE net Valueat Stake (2013-2022 10-year NPV)* •  SG&A and CoGS reduction from improved business process execution •  Improved capital efficiency Employee productivity: $2.5T •  Improved labor efficiency •  Fewer or more productive man-hours Supply-chain / logistics efficiency: $2.7T •  Improved process efficiency •  Reduced waste in supply chain Improved customer experience: $3.7T * Net present value Innovation: $3.0T •  Improved customer lifetime value •  Additional market share (more customers) •  Improved RD&E speed, reduced TTM •  New business models and new sources of revenue Source: Cisco IBSG, 2013 © 2013 Cisco and/or its affiliates. All rights reserved. Cisco Public 19
  • 20.
    50.0% Degree of impact (Valueat Stake / industry size) 45.0% Japan ($0.7T) 40.0% United States ($4.6T) 35.0% Canada ($0.4T) 30.0% Western and Eastern Europe ($4.3T) 25.0% 20.0% 15.0% China ($1.8T) 10.0% Spheres sized by amount of Value at Stake 5.0% Rest of world ($2.6T) 0.0% $0 $5,000 $10,000 $15,000 $20,000 $25,000 Geography size (value added $B) Source: Cisco IBSG, 2013 © 2013 Cisco and/or its affiliates. All rights reserved. Cisco Public 20
  • 21.
    100.0% Degree of impact (Valueat Stake / industry size) 90.0% Information services (9%) 80.0% Spheres sized by amount of Value at Stake 70.0% 60.0% Administration 50.0% 40.0% 20.0% Retail trade (11%) Education 30.0% Manufacturing (27%) Finance and insurance (9%) Company management Healthcare Professional services Wholesale 10.0% 0.0% $0 Source: Cisco IBSG, 2013 © 2013 Cisco and/or its affiliates. All rights reserved. $2,000 $4,000 $6,000 $8,000 $10,000 Industry size (value added $B) $12,000 $14,000 Sample  Size  =  807   Cisco Public 21
  • 22.
    © 2013 Ciscoand/or its affiliates. All rights reserved. Cisco Public 22
  • 23.
    •  21 usecases were used to determine the amount of Value at Stake (bottom-up approach) •  Both industry-specific Smart buildings and cross-industry use cases included •  Use cases provide a guide for business leaders to transform their companies to benefit from IoE Connected private education •  The time to begin is now Source: Cisco IBSG, 2013 Smart factories © 2013 Cisco and/or its affiliates. All rights reserved. Cisco Public 23
  • 24.
    2013 2022 Current state Potential withIoE Automated assembly machines are expensive and complicated to create and install Reduced costs as automated tools become less expensive to manufacture / implement Often inflexible and costly product-line changes Increased revenues from greater product variations Quality controls rely on human perception and dexterity Sensors compliment humans to improve product quality Reliance on low-cost manufacturing; employees with IT and data interpretation skills are costly, scarce Inefficient use of key inputs for production; lack of flexibility among assembly locations More intelligent design of machines; greater control of instrumentation and production conditions Socialization of skills knowledge flattens skills curve; maximizes access to human talent pools at lower costs Reduced waste (materials, energy); greater freedom and agility to reallocate production / optimize inputs Source: Cisco IBSG, 2013 © 2013 Cisco and/or its affiliates. All rights reserved. Cisco Public 24
  • 25.
    2013 2022 Current state Potential withIoE Vulnerability to faults Automated detection and self-healing improve reliability of the electric network One-way flow of electricity Ability to shape electric flows enables more flexibility, distributed generation Production calibrated for peak demand requires reserves, causes inefficiencies Demand-side management improves generator utilization and grid efficiency Variability in renewable energy sources prevents adoption Enables more sustainable energy sources such as wind and solar Connecting sensing, measurement, and controls in real time improves reliability, cost, and alignment between supply and demand Source: Cisco IBSG, 2013 © 2013 Cisco and/or its affiliates. All rights reserved. Cisco Public 25
  • 26.
    2013 2022 Current state Potential withIoE Time, money, and fuel lost due to traffic congestion Traffic management and optimization of road network lower congestion Reduced fuel efficiency due to sudden acceleration and braking Vehicles intelligently adjust driving speeds, improving fuel efficiency High proportion of accidents Vehicle-to-vehicle/ infrastructure communication lowers accident rates High vehicle insurance costs Insurance premium based on actual driving pattern of individuals Ad hoc routing of vehicles Optimized delivery routes Reduced time in traffic; lower accident rate; lower fuel, insurance, and repair costs Source: Cisco IBSG, 2013 © 2013 Cisco and/or its affiliates. All rights reserved. Cisco Public 26
  • 27.
    2013 Current state 2022 Potential withIoE Long hospital stays to ensure patients can thrive at home after discharge Shorter hospital stays with home monitoring systems Limited number of conditions with home monitoring capabilities Wider number of conditions with home monitoring capabilities Uncoordinated and manual collection of patient test records Single, electronic collection of patient records Ad hoc interpretation of medical test results and conditions Standardized treatments that conform to best practices Multiple doctors offering care in an uncoordinated manner Continuous monitoring of health conditions in a less, expensive home setting; all care aspects consolidated and coordinated Consolidated, patient-centric view of all treatment aspects Source: Cisco IBSG, 2013 © 2013 Cisco and/or its affiliates. All rights reserved. Cisco Public 27
  • 28.
    •  Determine whereyour business is today with regard to IoE •  Understand the role of IT in enabling your company to benefit from IoE •  Consider internal cultural changes required to embrace IoE •  Maximize your firm’s security and privacy capabilities •  Consider organizational structures that will best support IoE © 2013 Cisco and/or its affiliates. All rights reserved. Cisco Public 28
  • 29.