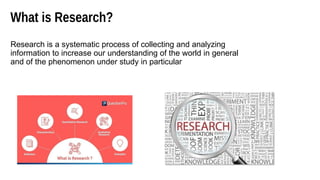
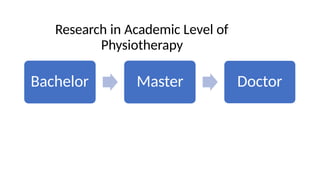
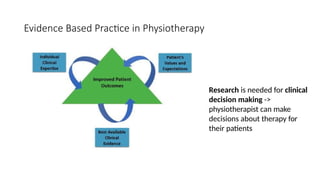
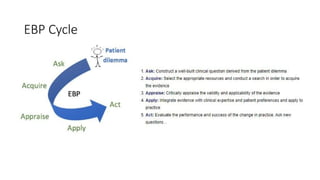
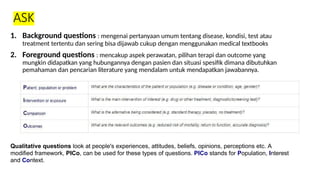
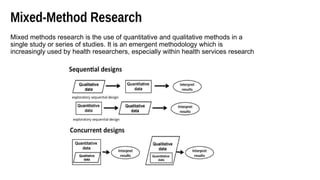
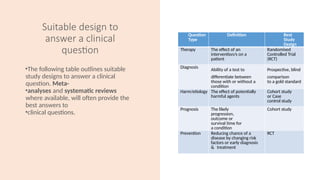
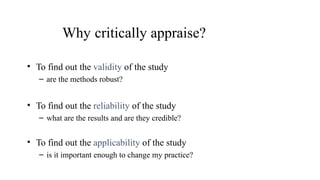
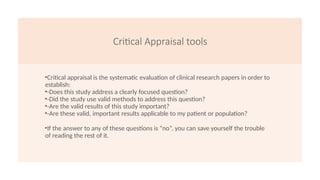
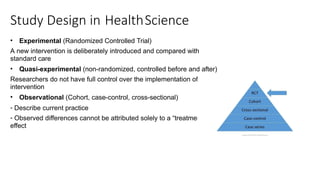
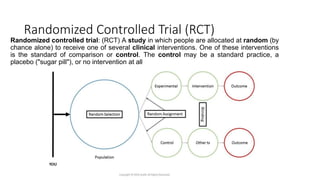
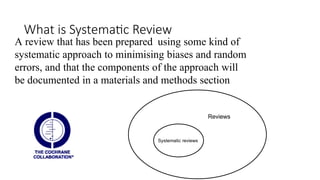
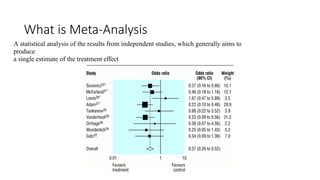
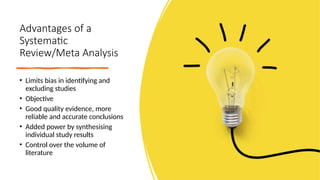
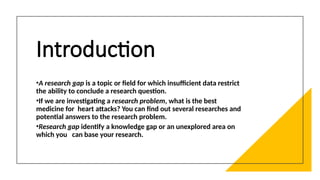
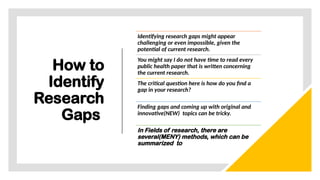
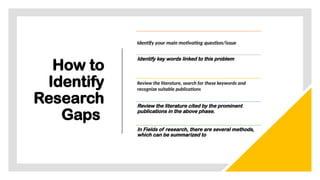
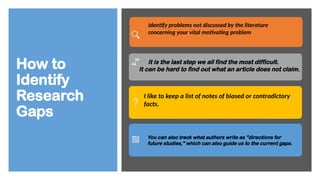
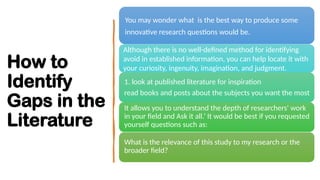
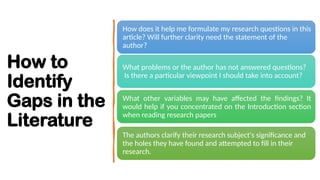
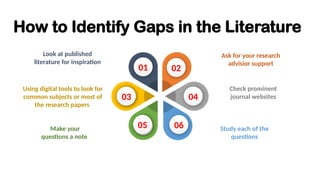
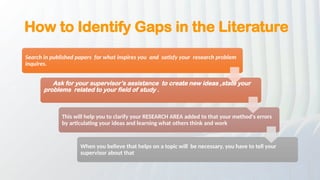
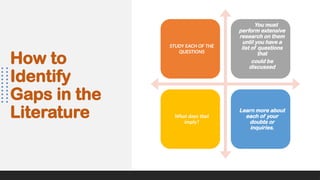
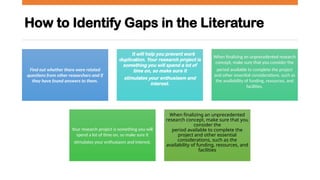
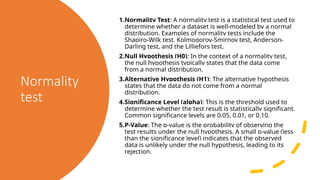
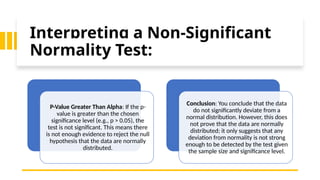
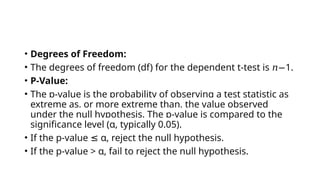
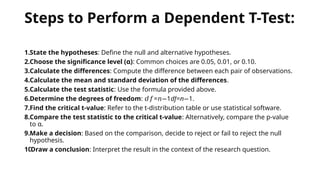
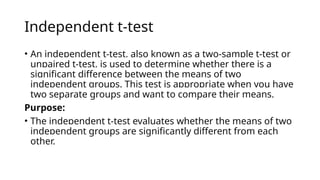
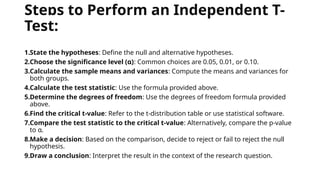
WORKSHOP ON RESEARCH
METHODOLOGY AND BIOSTISTICS
DR PRASANNA MOHAN
PROFESSOR/RESEARCH HEAD
KRUPANIDHI COLLEGE OF PHYSIOTHERAPY
DIRECTOR-REHAB ONE HEALTHCARE
DATE :23 AUGUST 2024
What one thing would you do if you were
invisible?
What is your favorite breakfast which
most people dislike it?
Is a randomized controlled trial
considered the gold standard for testing
the effectiveness of an intervention?
YES/NO
Does a p-value less than 0.05
always indicate a meaningful
and practical significance?
• YES/NO
Is it necessary to obtain informed
consent from participants in all
types of research involving
human subjects?
• YES/NO
Can qualitative research
methods be used to
quantify variables?
• YES/NO
Is the null hypothesis
always formulated as a
statement of no effect or
no difference?
• YES/NO
LEARNING OBJECTIVE
Grasp different research methodologies (quantitative, qualitative) and apply them to physiotherapy research.
Grasp
Search for, critically appraise, and synthesize relevant physiotherapy literature.
Search
Design and implement experimental, observational, and quasi-experimental studies.
Design and
implement
Understand and apply key biostatistical concepts, including hypothesis testing and selecting appropriate
statistical tests.
Understand and
apply
Gain hands-on experience with statistical software (e.g., SPSS, R) for data analysis and interpretation.
Gain
Why is Research
Important in
Physiotherapy
Overview
1. Why Do We Conduct Research?
2. Evidence-Based Practice
3. Level of Evidence
4. High Level Research: RCT & Systematic Review and Meta-Analysed
Study
Why do we conduct research??
What is Research?
Research is a systematic process of collecting and analyzing
information to increase our understanding of the world in general
and of the phenomenon under study in particular
We need to conduct research because
we need
to know, and knowing is important
Why do Research?
1. To invent new things
2. To solve a prevailing problem
3. To support development programmes of a country
4. To uplift living standards
5. Because we are inquisitive about things around us
6. Benefits society
Bachelor Master Doctor
Research in Academic Level of
Physiotherapy
Evidence-Based Practice
Evidence Based Practice in Physiotherapy
Research is needed for clinical
decision making ->
physiotherapist can make
decisions about therapy for
their patients
EBP Cycle
ASK
1. Background questions : mengenai pertanyaan umum tentang disease, kondisi, test atau
treatment tertentu dan sering bisa dijawab cukup dengan menggunakan medical textbooks
2. Foreground questions : mencakup aspek perawatan, pilihan terapi dan outcome yang
mungkin didapatkan yang hubungannya dengan pasien dan situasi spesifik dimana dibutuhkan
pemahaman dan pencarian literature yang mendalam untuk mendapatkan jawabannya.
Qualitative questions look at people's experiences, attitudes, beliefs, opinions, perceptions etc. A
modified framework, PICo, can be used for these types of questions. PICo stands for Population, Interest
and Context.
Level of
Evidence
Level of
Evidence
A meta-analysis uses statistical methods to synthesise the data from individual studies in a
systematic review
A systematic review is a review based on clearly formulated question. It uses systematic and
reproducible methods to identify, select and critically appraise all relevant research, and to collect and
analyse data from the studies that are included in the review
Randomised Control Trials (RCTs) are study designs that randomly assign participant to an
experimental group
(receives a clinical intervention) or a control group (receives placebo, the standard treatment or no
intervention).
Cohort studies are observational studies that identify 2 groups (cohorts) of patients, one which received
the
exposure of interest/intervention, and one which did not, and following them forward for the outcome
Case Control Studies identify patients with a specific condition (cases) and patients without the condition (controls)
and look back to see if they had an exposure of interest. They often rely on medical records and patient recall for data
collection.
Case reports/case series consist of a group or series of case reports involving patients with an outcome interest.
As they are reports of cases and use no control groups, they have no statistical validity.
Qualitative Research
Evidence
• Phenomenology looks at human perception and subjectivity and
focuses on the 'lived experience’ of of the individual concerned. Data
of the participant's experience is collected using a focused but non-
structured interview.
• Grounded Theory involves the discovery of a theory through the
analysis of data. It is a research method that is almost opposite to
the traditional social science research in that it does not begin with
a hypothesis but starts with data collection through a variety of
methods.
• Ethnography is used to study groups of people who share social and
cultural characteristics; think of themselves as a group;and share
common language, geographic locale and identity. Ethnography
provides a 'portrait of the people'. It involves participant observation,
the recording of field notes and interviewing key informants.
• Action research asks the question, "What is happening here and
how could it be different?" It is a process of reflecting on the
world to change it followed by evaluation. Data collected can be
both qualitative and quantitative. Themes, issues and concerns
are extracted and discussed by both the research team and the
participating group.
Mixed-Method Research
Mixed methods research is the use of quantitative and qualitative methods in a
single study or series of studies. It is an emergent methodology which is
increasingly used by health researchers, especially within health services research
Suitable design to
answer a clinical
question
•The following table outlines suitable
study designs to answer a clinical
question. Meta-
•analyses and systematic reviews
where available, will often provide the
best answers to
•clinical questions.
Question
Type
Definition Best
Study
Design
Therapy The effect of an
intervention/s on a
patient
Randomised
Controlled Trial
(RCT)
Diagnosis
Ability of a test to
differentiate between
those with or without a
condition
Prospective, blind
comparison
to a gold standard
Harm/etiology The effect of potentially
harmful agents
Cohort study
or Case
control study
Prognosis The likely
progression,
outcome or
survival time for
a condition
Cohort study
Prevention Reducing chance of a
disease by changing risk
factors or early diagnosis
& treatment
RCT
Why critically appraise?
• To find out the validity of the study
– are the methods robust?
• To find out the reliability of the study
– what are the results and are they credible?
• To find out the applicability of the study
– is it important enough to change my practice?
Critical Appraisal tools
•Critical appraisal is the systematic evaluation of clinical research papers in order to
establish:
•-Does this study address a clearly focused question?
•-Did the study use valid methods to address this question?
•-Are the valid results of this study important?
•-Are these valid, important results applicable to my patient or population?
•If the answer to any of these questions is “no”, you can save yourself the trouble
of reading the rest of it.
High Level of Research: Randomised
Controlled Trial (RCT), Systematic
Review and Meta-Analysis
Study Design in HealthScience
• Experimental (Randomized Controlled Trial)
A new intervention is deliberately introduced and compared with
standard care
• Quasi-experimental (non-randomized, controlled before and after)
Researchers do not have full control over the implementation of the
intervention
• Observational (Cohort, case-control, cross-sectional)
- Describe current practice
- Observed differences cannot be attributed solely to a “treatment”
effect
Randomized Controlled Trial (RCT)
Randomized controlled trial: (RCT) A study in which people are allocated at random (by
chance alone) to receive one of several clinical interventions. One of these interventions
is the standard of comparison or control. The control may be a standard practice, a
placebo ("sugar pill"), or no intervention at all
Feasibility
Study
• Acceptability Rate
• Recruitment Rate
• Adherence Rate
• Drop-Out Rate
• Adverse Event
• Retention Rate
What is Systematic Review
A review that has been prepared using some kind of
systematic approach to minimising biases and random
errors, and that the components of the approach will
be documented in a materials and methods section
Systematic reviews
Reviews
What is Meta-Analysis
A statistical analysis of the results from independent studies, which generally aims to
produce
a single estimate of the treatment effect
Advantages of a
Systematic
Review/Meta Analysis
• Limits bias in identifying and
excluding studies
• Objective
• Good quality evidence, more
reliable and accurate conclusions
• Added power by synthesising
individual study results
• Control over the volume of
literature
In Brief
• Research gap is a problem, which
is not covered properly. It may be
stemming from deficiency of
appropriate data to support the
thesis title and literature gap,
which means the lacking or
uncomplete piece of information in
the Academic research literature
which is not investigated or
studied.
•What is a research gap?
• A research gap means, there are
some areas that have significant
scope for more research, but they
have not been investigated by
other researchers. In other words,
no one has picked up or worked on
these ideas.
• A research gap refers to such
unexplored or underexplored areas
that have scope for further
research.
Introduction
•A research gap is a topic or field for which insufficient data restrict
the ability to conclude a research question.
•If we are investigating a research problem, what is the best
medicine for heart attacks? You can find out several researches and
potential answers to the research problem.
•Research gap identify a knowledge gap or an unexplored area on
which you can base your research.
How to
Identify
Research
Gaps
Identifying research gaps might appear
challenging or even impossible, given the
potential of current research.
You might say I do not have time to read every
public health paper that is written concerning
the current research.
The critical question here is how do you find a
gap in your research?
Finding gaps and coming up with original and
innovative(NEW) topics can be tricky.
In Fields of research, there are
several(MENY) methods, which can be
summarized to
How to
Identify
Research
Gaps
Identify your main motivating question/issue
Identify key words linked to this problem
Review the literature, search for these keywords and
recognize suitable publications
Review the literature cited by the prominent
publications in the above phase.
In Fields of research, there are several methods,
which can be summarized to
How to
Identify
Research
Gaps
Identify problems not discussed by the literature
concerning your vital motivating problem
It is the last step we all find the most difficult.
It can be hard to find out what an article does not claim.
I like to keep a list of notes of biased or contradictory
facts.
You can also track what authors write as "directions for
future studies," which can also guide us to the current gaps.
How to
Identify
Gaps in the
Literature
You may wonder what is the best way to produce some
innovative research questions would be.
Although there is no well-defined method for identifying
avoid in established information, you can help locate it with
your curiosity, ingenuity, imagination, and judgment.
1. look at published literature for inspiration
read books and posts about the subjects you want the most
It allows you to understand the depth of researchers' work
in your field and Ask it all.’ It would be best if you requested
yourself questions such as:
What is the relevance of this study to my research or the
broader field?
How to
Identify
Gaps in the
Literature
How does it help me formulate my research questions in this
article? Will further clarity need the statement of the
author?
What problems or the author has not answered questions?
Is there a particular viewpoint I should take into account?
What other variables may have affected the findings? It
would help if you concentrated on the Introduction section
when reading research papers
The authors clarify their research subject's significance and
the holes they have found and attempted to fill in their
research.
How to
Identify
Gaps in the
Literature
Also, look at the directions or recommendations that the
writers have made for more study as that could be highly
encouraging for PhD Literature Review Gap
Identification.
To learn more about the advancements and
developments in science over the years in the field of
your liking, read meta-analyses and review articles.
It will allow you to get acquainted with the issues studied
in the past and trending questions that you find curious
about specific subjects..
How to Identify Gaps in the Literature
Check prominent
journal websites
Study each of the
questions
Using digital tools to look for
common subjects or most of
the research papers
Make your
questions a note
Ask for your research
advisior support
Look at published
literature for inspiration
01 02
03 04
05 06
How to Identify Gaps in the Literature
Search in published papers for what inspires you and satisfy your research problem
inquires.
Ask for your supervisor’s assistance to create new ideas ,state your
problems related to your field of study .
This will help you to clarify your RESEARCH AREA added to that your method's errors
by articulating your ideas and learning what others think and work
When you believe that helps on a topic will be necessary, you have to tell your
supervisor about that
How to Identify Gaps in the Literature
You should use digital resources to
familiarize yourself with the trending
queries in your area, as they can bar
time and help you cast a broader net
in your quest for a research void
You can also use Google Trends to
study more about the current
questions relevant to your study area.
To know which topics are considered
significant, websites such as Critical
Science Indicator that classify the
most cited papers in a field and
emerging branches, prominent
authors, publications and countries in
that field can be beneficial.
There is always a segment called
'main concepts' on influential journals
where experts in a region highlight
the core ideas in that field.
How to Identify Gaps in the Literature
Reading through this
chapter will help you
gain a lot of knowledge
and create new ideas
Also, it would be best if
you observed through
these papers' reference
section, as it can lead
you to essential
resources on the topic
MAKE YOUR QUESTIONS A NOTE:
.It is a good idea to remember
reading any written literature all the
problems that cross your mind.
. You can map the query to the
resource it is centred on, if possible.
To maintain a record, you can use
tables, charts, photographs, or
software.
In the long run, this will benefit you
when you turn your idea into a
research issue or even when you
write your manuscript.
How to
Identify
Gaps in the
Literature
STUDY EACH OF THE
QUESTIONS
You must
perform extensive
research on them
until you have a
list of questions
that
could be
discussed
What does that
imply?
Learn more about
each of your
doubts or
inquiries.
How to Identify Gaps in the Literature
Find out whether there were related
questions from other researchers and if
they have found answers to them.
It will help you prevent work
duplication. Your research project is
something you will spend a lot of
time on, so make sure it
stimulates your enthusiasm and
interest.
When finalizing an unprecedented research
concept, make sure that you consider the
period available to complete the project
and other essential considerations, such as
the availability of funding, resources, and
facilities.
Your research project is something you will
spend a lot of time on, so make sure it
stimulates your enthusiasm and interest.
When finalizing an unprecedented
research concept, make sure that you
consider the
period available to complete the
project and other essential
considerations, such as the
availability of funding, resources, and
facilities
Normality
test
1.Normality Test: A normality test is a statistical test used to
determine whether a dataset is well-modeled by a normal
distribution. Examples of normality tests include the
Shapiro-Wilk test, Kolmogorov-Smirnov test, Anderson-
Darling test, and the Lilliefors test.
2.Null Hypothesis (H0): In the context of a normality test,
the null hypothesis typically states that the data come
from a normal distribution.
3.Alternative Hypothesis (H1): The alternative hypothesis
states that the data do not come from a normal
distribution.
4.Significance Level (alpha): This is the threshold used to
determine whether the test result is statistically significant.
Common significance levels are 0.05, 0.01, or 0.10.
5.P-Value: The p-value is the probability of observing the
test results under the null hypothesis. A small p-value (less
than the significance level) indicates that the observed
data is unlikely under the null hypothesis, leading to its
rejection.
Interpreting a Non-Significant
Normality Test:
P-Value Greater Than Alpha: If the p-
value is greater than the chosen
significance level (e.g., p > 0.05), the
test is not significant. This means there
is not enough evidence to reject the null
hypothesis that the data are normally
distributed.
Conclusion: You conclude that the data
do not significantly deviate from a
normal distribution. However, this does
not prove that the data are normally
distributed; it only suggests that any
deviation from normality is not strong
enough to be detected by the test given
the sample size and significance level.
Practical Implications:
In practice, this means you can
proceed with analyses that assume
normality (such as certain
parametric tests) with more
confidence.
It's important to consider other
factors such as sample size, as
normality tests can have low power
with small samples and may fail to
detect deviations from normality.
Conversely, with very large samples,
even trivial deviations can become
statistically significant.
One-Sample T-Test:
• Suppose a researcher wants to
determine if a new diet affects the
average cholesterol level in adults.
The known average cholesterol level
for the general population is 200
mg/dL. After implementing the new
diet, a sample of 15 adults has an
average cholesterol level of 190
mg/dL with a sample standard
deviation of 12 mg/dL. The researcher
wants to test if the diet significantly
changes the average cholesterol level
at a 0.05 significance level.
Steps to Perform a One-
Sample T-Test:
1. State the hypotheses: Define the null and
alternative hypotheses.
1. Null Hypothesis (H0): The mean cholesterol
level after the diet is 200 mg/dL. 0: =200
𝐻 𝜇 H0​
:μ=200
2. Alternative Hypothesis (H1): The mean
cholesterol level after the diet is not 200
mg/dL. 1: ≠200
𝐻 𝜇 H1​
:μ =200

2. Choose the significance level (α): 0.05.
3. Calculate the test statistic:
1. 𝑥ˉxˉ = 190 (sample mean)
2. 𝜇0 = 200 (hypothesized population mean)
3. 𝑠s = 12 (sample standard deviation)
4. 𝑛n = 15 (sample size)
4. 𝑡=190 20012/15= 1012/3.873= 103.1= 3.226
− − − − t=1
Steps to Perform a
One-Sample T-Test:
1. Determine the degrees of freedom:
= 1=15 1=14
𝑑𝑓 𝑛− − df=n 1=15 1=14
− −
2. Find the critical t-value: For a two-tailed test with α
= 0.05 and df = 14, the critical t-values are
approximately ±2.145 (from the t-distribution table).
3. Compare the test statistic to the critical t-value:
1. Test statistic = 3.226
𝑡 − t= 3.226
−
2. Critical t-values ±2.145±2.145
4. Since -3.226 is less than -2.145, the test statistic falls
in the critical region.p=0.006
5. Make a decision: Reject the null hypothesis.
Dependent t-test
• A dependent t-test, also known as a
paired samples t-test or matched
pairs t-test, is used to compare the
means of two related groups. This
test is appropriate when you have
two measurements taken on the
same subjects, such as before and
after an intervention, or when you
have matched pairs of subjects.
Purpose
• The dependent t-test evaluates
whether the mean difference
between the paired observations is
significantly different from zero.
Dependent t-test
Hypotheses:
• Null Hypothesis (H0): The mean difference between
the paired observations is zero.
𝐻0: =0
𝜇𝑑
• Alternative Hypothesis (H1): The mean difference
between the paired observations is not zero.
𝐻1: ≠0
𝜇𝑑
• Test Statistic:
• The test statistic for the dependent t-test is calculated
as:
• Where:
• 𝑑ˉ is the mean of the differences between paired
observations.
• 𝑠𝑑 is the standard deviation of the differences.
• 𝑛 is the number of pairs.
• Degrees of Freedom:
• The degrees of freedom (df) for the dependent t-test is 1
𝑛− .
• P-Value:
• The p-value is the probability of observing a test statistic as
extreme as, or more extreme than, the value observed
under the null hypothesis. The p-value is compared to the
significance level (α, typically 0.05).
• If the p-value α, reject the null hypothesis.
≤
• If the p-value > α, fail to reject the null hypothesis.
Steps to Perform a Dependent T-Test:
1.State the hypotheses: Define the null and alternative hypotheses.
2.Choose the significance level (α): Common choices are 0.05, 0.01, or 0.10.
3.Calculate the differences: Compute the difference between each pair of observations.
4.Calculate the mean and standard deviation of the differences.
5.Calculate the test statistic: Use the formula provided above.
6.Determine the degrees of freedom: = 1
𝑑𝑓 𝑛− df=n 1
− .
7.Find the critical t-value: Refer to the t-distribution table or use statistical software.
8.Compare the test statistic to the critical t-value: Alternatively, compare the p-value
to α.
9.Make a decision: Based on the comparison, decide to reject or fail to reject the null
hypothesis.
10.
Draw a conclusion: Interpret the result in the context of the research question.
Independent t-test
• An independent t-test, also known as a two-sample t-test or
unpaired t-test, is used to determine whether there is a
significant difference between the means of two
independent groups. This test is appropriate when you have
two separate groups and want to compare their means.
Purpose:
• The independent t-test evaluates whether the means of two
independent groups are significantly different from each
other.
Dependent t-test
• When to Use:
• You have two independent groups.
• The data in each group should be approximately normally distributed.
• The variances of the two groups should be approximately equal
(homogeneity of variances).
• Hypotheses:
• Null Hypothesis (H0): The means of the two groups are equal.
• 𝐻0: 1= 2
𝜇 𝜇
• Alternative Hypothesis (H1): The means of the two groups are not equal.
• 𝐻1: 1≠ 2
𝜇 𝜇
Steps to Perform an Independent T-
Test:
1.State the hypotheses: Define the null and alternative hypotheses.
2.Choose the significance level (α): Common choices are 0.05, 0.01, or 0.10.
3.Calculate the sample means and variances: Compute the means and variances for
both groups.
4.Calculate the test statistic: Use the formula provided above.
5.Determine the degrees of freedom: Use the degrees of freedom formula provided
above.
6.Find the critical t-value: Refer to the t-distribution table or use statistical software.
7.Compare the test statistic to the critical t-value: Alternatively, compare the p-value
to α.
8.Make a decision: Based on the comparison, decide to reject or fail to reject the null
hypothesis.
9.Draw a conclusion: Interpret the result in the context of the research question.
Conclusion
•It would help if you used the suggestions given in this
blog to find out what works for you because there is
no particular method to pick out outstanding or
fascinating research problems.
•Keep reading and asking questions before the
specific
issue you've been looking for is found!

comprehensive research and biostatistics workshop

  • 1.
    WORKSHOP ON RESEARCH METHODOLOGYAND BIOSTISTICS DR PRASANNA MOHAN PROFESSOR/RESEARCH HEAD KRUPANIDHI COLLEGE OF PHYSIOTHERAPY DIRECTOR-REHAB ONE HEALTHCARE DATE :23 AUGUST 2024
  • 2.
    What one thingwould you do if you were invisible?
  • 3.
    What is yourfavorite breakfast which most people dislike it?
  • 4.
    Is a randomizedcontrolled trial considered the gold standard for testing the effectiveness of an intervention? YES/NO
  • 5.
    Does a p-valueless than 0.05 always indicate a meaningful and practical significance? • YES/NO
  • 6.
    Is it necessaryto obtain informed consent from participants in all types of research involving human subjects? • YES/NO
  • 7.
    Can qualitative research methodsbe used to quantify variables? • YES/NO
  • 8.
    Is the nullhypothesis always formulated as a statement of no effect or no difference? • YES/NO
  • 9.
    LEARNING OBJECTIVE Grasp differentresearch methodologies (quantitative, qualitative) and apply them to physiotherapy research. Grasp Search for, critically appraise, and synthesize relevant physiotherapy literature. Search Design and implement experimental, observational, and quasi-experimental studies. Design and implement Understand and apply key biostatistical concepts, including hypothesis testing and selecting appropriate statistical tests. Understand and apply Gain hands-on experience with statistical software (e.g., SPSS, R) for data analysis and interpretation. Gain
  • 10.
    Why is Research Importantin Physiotherapy
  • 11.
    Overview 1. Why DoWe Conduct Research? 2. Evidence-Based Practice 3. Level of Evidence 4. High Level Research: RCT & Systematic Review and Meta-Analysed Study
  • 12.
    Why do weconduct research??
  • 13.
    What is Research? Researchis a systematic process of collecting and analyzing information to increase our understanding of the world in general and of the phenomenon under study in particular
  • 14.
    We need toconduct research because we need to know, and knowing is important
  • 15.
    Why do Research? 1.To invent new things 2. To solve a prevailing problem 3. To support development programmes of a country 4. To uplift living standards 5. Because we are inquisitive about things around us 6. Benefits society
  • 16.
    Bachelor Master Doctor Researchin Academic Level of Physiotherapy
  • 17.
  • 18.
    Evidence Based Practicein Physiotherapy Research is needed for clinical decision making -> physiotherapist can make decisions about therapy for their patients
  • 19.
  • 20.
    ASK 1. Background questions: mengenai pertanyaan umum tentang disease, kondisi, test atau treatment tertentu dan sering bisa dijawab cukup dengan menggunakan medical textbooks 2. Foreground questions : mencakup aspek perawatan, pilihan terapi dan outcome yang mungkin didapatkan yang hubungannya dengan pasien dan situasi spesifik dimana dibutuhkan pemahaman dan pencarian literature yang mendalam untuk mendapatkan jawabannya. Qualitative questions look at people's experiences, attitudes, beliefs, opinions, perceptions etc. A modified framework, PICo, can be used for these types of questions. PICo stands for Population, Interest and Context.
  • 21.
  • 22.
  • 23.
    A meta-analysis usesstatistical methods to synthesise the data from individual studies in a systematic review A systematic review is a review based on clearly formulated question. It uses systematic and reproducible methods to identify, select and critically appraise all relevant research, and to collect and analyse data from the studies that are included in the review Randomised Control Trials (RCTs) are study designs that randomly assign participant to an experimental group (receives a clinical intervention) or a control group (receives placebo, the standard treatment or no intervention). Cohort studies are observational studies that identify 2 groups (cohorts) of patients, one which received the exposure of interest/intervention, and one which did not, and following them forward for the outcome Case Control Studies identify patients with a specific condition (cases) and patients without the condition (controls) and look back to see if they had an exposure of interest. They often rely on medical records and patient recall for data collection. Case reports/case series consist of a group or series of case reports involving patients with an outcome interest. As they are reports of cases and use no control groups, they have no statistical validity.
  • 25.
    Qualitative Research Evidence • Phenomenologylooks at human perception and subjectivity and focuses on the 'lived experience’ of of the individual concerned. Data of the participant's experience is collected using a focused but non- structured interview. • Grounded Theory involves the discovery of a theory through the analysis of data. It is a research method that is almost opposite to the traditional social science research in that it does not begin with a hypothesis but starts with data collection through a variety of methods. • Ethnography is used to study groups of people who share social and cultural characteristics; think of themselves as a group;and share common language, geographic locale and identity. Ethnography provides a 'portrait of the people'. It involves participant observation, the recording of field notes and interviewing key informants. • Action research asks the question, "What is happening here and how could it be different?" It is a process of reflecting on the world to change it followed by evaluation. Data collected can be both qualitative and quantitative. Themes, issues and concerns are extracted and discussed by both the research team and the participating group.
  • 26.
    Mixed-Method Research Mixed methodsresearch is the use of quantitative and qualitative methods in a single study or series of studies. It is an emergent methodology which is increasingly used by health researchers, especially within health services research
  • 27.
    Suitable design to answera clinical question •The following table outlines suitable study designs to answer a clinical question. Meta- •analyses and systematic reviews where available, will often provide the best answers to •clinical questions. Question Type Definition Best Study Design Therapy The effect of an intervention/s on a patient Randomised Controlled Trial (RCT) Diagnosis Ability of a test to differentiate between those with or without a condition Prospective, blind comparison to a gold standard Harm/etiology The effect of potentially harmful agents Cohort study or Case control study Prognosis The likely progression, outcome or survival time for a condition Cohort study Prevention Reducing chance of a disease by changing risk factors or early diagnosis & treatment RCT
  • 28.
    Why critically appraise? •To find out the validity of the study – are the methods robust? • To find out the reliability of the study – what are the results and are they credible? • To find out the applicability of the study – is it important enough to change my practice?
  • 29.
    Critical Appraisal tools •Criticalappraisal is the systematic evaluation of clinical research papers in order to establish: •-Does this study address a clearly focused question? •-Did the study use valid methods to address this question? •-Are the valid results of this study important? •-Are these valid, important results applicable to my patient or population? •If the answer to any of these questions is “no”, you can save yourself the trouble of reading the rest of it.
  • 30.
    High Level ofResearch: Randomised Controlled Trial (RCT), Systematic Review and Meta-Analysis
  • 31.
    Study Design inHealthScience • Experimental (Randomized Controlled Trial) A new intervention is deliberately introduced and compared with standard care • Quasi-experimental (non-randomized, controlled before and after) Researchers do not have full control over the implementation of the intervention • Observational (Cohort, case-control, cross-sectional) - Describe current practice - Observed differences cannot be attributed solely to a “treatment” effect
  • 32.
    Randomized Controlled Trial(RCT) Randomized controlled trial: (RCT) A study in which people are allocated at random (by chance alone) to receive one of several clinical interventions. One of these interventions is the standard of comparison or control. The control may be a standard practice, a placebo ("sugar pill"), or no intervention at all
  • 33.
    Feasibility Study • Acceptability Rate •Recruitment Rate • Adherence Rate • Drop-Out Rate • Adverse Event • Retention Rate
  • 34.
    What is SystematicReview A review that has been prepared using some kind of systematic approach to minimising biases and random errors, and that the components of the approach will be documented in a materials and methods section Systematic reviews Reviews
  • 35.
    What is Meta-Analysis Astatistical analysis of the results from independent studies, which generally aims to produce a single estimate of the treatment effect
  • 36.
    Advantages of a Systematic Review/MetaAnalysis • Limits bias in identifying and excluding studies • Objective • Good quality evidence, more reliable and accurate conclusions • Added power by synthesising individual study results • Control over the volume of literature
  • 37.
    In Brief • Researchgap is a problem, which is not covered properly. It may be stemming from deficiency of appropriate data to support the thesis title and literature gap, which means the lacking or uncomplete piece of information in the Academic research literature which is not investigated or studied.
  • 38.
    •What is aresearch gap? • A research gap means, there are some areas that have significant scope for more research, but they have not been investigated by other researchers. In other words, no one has picked up or worked on these ideas. • A research gap refers to such unexplored or underexplored areas that have scope for further research.
  • 39.
    Introduction •A research gapis a topic or field for which insufficient data restrict the ability to conclude a research question. •If we are investigating a research problem, what is the best medicine for heart attacks? You can find out several researches and potential answers to the research problem. •Research gap identify a knowledge gap or an unexplored area on which you can base your research.
  • 40.
    How to Identify Research Gaps Identifying researchgaps might appear challenging or even impossible, given the potential of current research. You might say I do not have time to read every public health paper that is written concerning the current research. The critical question here is how do you find a gap in your research? Finding gaps and coming up with original and innovative(NEW) topics can be tricky. In Fields of research, there are several(MENY) methods, which can be summarized to
  • 41.
    How to Identify Research Gaps Identify yourmain motivating question/issue Identify key words linked to this problem Review the literature, search for these keywords and recognize suitable publications Review the literature cited by the prominent publications in the above phase. In Fields of research, there are several methods, which can be summarized to
  • 42.
    How to Identify Research Gaps Identify problemsnot discussed by the literature concerning your vital motivating problem It is the last step we all find the most difficult. It can be hard to find out what an article does not claim. I like to keep a list of notes of biased or contradictory facts. You can also track what authors write as "directions for future studies," which can also guide us to the current gaps.
  • 43.
    How to Identify Gaps inthe Literature You may wonder what is the best way to produce some innovative research questions would be. Although there is no well-defined method for identifying avoid in established information, you can help locate it with your curiosity, ingenuity, imagination, and judgment. 1. look at published literature for inspiration read books and posts about the subjects you want the most It allows you to understand the depth of researchers' work in your field and Ask it all.’ It would be best if you requested yourself questions such as: What is the relevance of this study to my research or the broader field?
  • 44.
    How to Identify Gaps inthe Literature How does it help me formulate my research questions in this article? Will further clarity need the statement of the author? What problems or the author has not answered questions? Is there a particular viewpoint I should take into account? What other variables may have affected the findings? It would help if you concentrated on the Introduction section when reading research papers The authors clarify their research subject's significance and the holes they have found and attempted to fill in their research.
  • 45.
    How to Identify Gaps inthe Literature Also, look at the directions or recommendations that the writers have made for more study as that could be highly encouraging for PhD Literature Review Gap Identification. To learn more about the advancements and developments in science over the years in the field of your liking, read meta-analyses and review articles. It will allow you to get acquainted with the issues studied in the past and trending questions that you find curious about specific subjects..
  • 46.
    How to IdentifyGaps in the Literature Check prominent journal websites Study each of the questions Using digital tools to look for common subjects or most of the research papers Make your questions a note Ask for your research advisior support Look at published literature for inspiration 01 02 03 04 05 06
  • 47.
    How to IdentifyGaps in the Literature Search in published papers for what inspires you and satisfy your research problem inquires. Ask for your supervisor’s assistance to create new ideas ,state your problems related to your field of study . This will help you to clarify your RESEARCH AREA added to that your method's errors by articulating your ideas and learning what others think and work When you believe that helps on a topic will be necessary, you have to tell your supervisor about that
  • 48.
    How to IdentifyGaps in the Literature You should use digital resources to familiarize yourself with the trending queries in your area, as they can bar time and help you cast a broader net in your quest for a research void You can also use Google Trends to study more about the current questions relevant to your study area. To know which topics are considered significant, websites such as Critical Science Indicator that classify the most cited papers in a field and emerging branches, prominent authors, publications and countries in that field can be beneficial. There is always a segment called 'main concepts' on influential journals where experts in a region highlight the core ideas in that field.
  • 49.
    How to IdentifyGaps in the Literature Reading through this chapter will help you gain a lot of knowledge and create new ideas Also, it would be best if you observed through these papers' reference section, as it can lead you to essential resources on the topic MAKE YOUR QUESTIONS A NOTE: .It is a good idea to remember reading any written literature all the problems that cross your mind. . You can map the query to the resource it is centred on, if possible. To maintain a record, you can use tables, charts, photographs, or software. In the long run, this will benefit you when you turn your idea into a research issue or even when you write your manuscript.
  • 50.
    How to Identify Gaps inthe Literature STUDY EACH OF THE QUESTIONS You must perform extensive research on them until you have a list of questions that could be discussed What does that imply? Learn more about each of your doubts or inquiries.
  • 51.
    How to IdentifyGaps in the Literature Find out whether there were related questions from other researchers and if they have found answers to them. It will help you prevent work duplication. Your research project is something you will spend a lot of time on, so make sure it stimulates your enthusiasm and interest. When finalizing an unprecedented research concept, make sure that you consider the period available to complete the project and other essential considerations, such as the availability of funding, resources, and facilities. Your research project is something you will spend a lot of time on, so make sure it stimulates your enthusiasm and interest. When finalizing an unprecedented research concept, make sure that you consider the period available to complete the project and other essential considerations, such as the availability of funding, resources, and facilities
  • 52.
    Normality test 1.Normality Test: Anormality test is a statistical test used to determine whether a dataset is well-modeled by a normal distribution. Examples of normality tests include the Shapiro-Wilk test, Kolmogorov-Smirnov test, Anderson- Darling test, and the Lilliefors test. 2.Null Hypothesis (H0): In the context of a normality test, the null hypothesis typically states that the data come from a normal distribution. 3.Alternative Hypothesis (H1): The alternative hypothesis states that the data do not come from a normal distribution. 4.Significance Level (alpha): This is the threshold used to determine whether the test result is statistically significant. Common significance levels are 0.05, 0.01, or 0.10. 5.P-Value: The p-value is the probability of observing the test results under the null hypothesis. A small p-value (less than the significance level) indicates that the observed data is unlikely under the null hypothesis, leading to its rejection.
  • 53.
    Interpreting a Non-Significant NormalityTest: P-Value Greater Than Alpha: If the p- value is greater than the chosen significance level (e.g., p > 0.05), the test is not significant. This means there is not enough evidence to reject the null hypothesis that the data are normally distributed. Conclusion: You conclude that the data do not significantly deviate from a normal distribution. However, this does not prove that the data are normally distributed; it only suggests that any deviation from normality is not strong enough to be detected by the test given the sample size and significance level.
  • 54.
    Practical Implications: In practice,this means you can proceed with analyses that assume normality (such as certain parametric tests) with more confidence. It's important to consider other factors such as sample size, as normality tests can have low power with small samples and may fail to detect deviations from normality. Conversely, with very large samples, even trivial deviations can become statistically significant.
  • 55.
    One-Sample T-Test: • Supposea researcher wants to determine if a new diet affects the average cholesterol level in adults. The known average cholesterol level for the general population is 200 mg/dL. After implementing the new diet, a sample of 15 adults has an average cholesterol level of 190 mg/dL with a sample standard deviation of 12 mg/dL. The researcher wants to test if the diet significantly changes the average cholesterol level at a 0.05 significance level.
  • 56.
    Steps to Performa One- Sample T-Test: 1. State the hypotheses: Define the null and alternative hypotheses. 1. Null Hypothesis (H0): The mean cholesterol level after the diet is 200 mg/dL. 0: =200 𝐻 𝜇 H0​ :μ=200 2. Alternative Hypothesis (H1): The mean cholesterol level after the diet is not 200 mg/dL. 1: ≠200 𝐻 𝜇 H1​ :μ =200  2. Choose the significance level (α): 0.05. 3. Calculate the test statistic: 1. 𝑥ˉxˉ = 190 (sample mean) 2. 𝜇0 = 200 (hypothesized population mean) 3. 𝑠s = 12 (sample standard deviation) 4. 𝑛n = 15 (sample size) 4. 𝑡=190 20012/15= 1012/3.873= 103.1= 3.226 − − − − t=1
  • 57.
    Steps to Performa One-Sample T-Test: 1. Determine the degrees of freedom: = 1=15 1=14 𝑑𝑓 𝑛− − df=n 1=15 1=14 − − 2. Find the critical t-value: For a two-tailed test with α = 0.05 and df = 14, the critical t-values are approximately ±2.145 (from the t-distribution table). 3. Compare the test statistic to the critical t-value: 1. Test statistic = 3.226 𝑡 − t= 3.226 − 2. Critical t-values ±2.145±2.145 4. Since -3.226 is less than -2.145, the test statistic falls in the critical region.p=0.006 5. Make a decision: Reject the null hypothesis.
  • 58.
    Dependent t-test • Adependent t-test, also known as a paired samples t-test or matched pairs t-test, is used to compare the means of two related groups. This test is appropriate when you have two measurements taken on the same subjects, such as before and after an intervention, or when you have matched pairs of subjects. Purpose • The dependent t-test evaluates whether the mean difference between the paired observations is significantly different from zero.
  • 59.
    Dependent t-test Hypotheses: • NullHypothesis (H0): The mean difference between the paired observations is zero. 𝐻0: =0 𝜇𝑑 • Alternative Hypothesis (H1): The mean difference between the paired observations is not zero. 𝐻1: ≠0 𝜇𝑑 • Test Statistic: • The test statistic for the dependent t-test is calculated as: • Where: • 𝑑ˉ is the mean of the differences between paired observations. • 𝑠𝑑 is the standard deviation of the differences. • 𝑛 is the number of pairs.
  • 60.
    • Degrees ofFreedom: • The degrees of freedom (df) for the dependent t-test is 1 𝑛− . • P-Value: • The p-value is the probability of observing a test statistic as extreme as, or more extreme than, the value observed under the null hypothesis. The p-value is compared to the significance level (α, typically 0.05). • If the p-value α, reject the null hypothesis. ≤ • If the p-value > α, fail to reject the null hypothesis.
  • 61.
    Steps to Performa Dependent T-Test: 1.State the hypotheses: Define the null and alternative hypotheses. 2.Choose the significance level (α): Common choices are 0.05, 0.01, or 0.10. 3.Calculate the differences: Compute the difference between each pair of observations. 4.Calculate the mean and standard deviation of the differences. 5.Calculate the test statistic: Use the formula provided above. 6.Determine the degrees of freedom: = 1 𝑑𝑓 𝑛− df=n 1 − . 7.Find the critical t-value: Refer to the t-distribution table or use statistical software. 8.Compare the test statistic to the critical t-value: Alternatively, compare the p-value to α. 9.Make a decision: Based on the comparison, decide to reject or fail to reject the null hypothesis. 10. Draw a conclusion: Interpret the result in the context of the research question.
  • 62.
    Independent t-test • Anindependent t-test, also known as a two-sample t-test or unpaired t-test, is used to determine whether there is a significant difference between the means of two independent groups. This test is appropriate when you have two separate groups and want to compare their means. Purpose: • The independent t-test evaluates whether the means of two independent groups are significantly different from each other.
  • 63.
    Dependent t-test • Whento Use: • You have two independent groups. • The data in each group should be approximately normally distributed. • The variances of the two groups should be approximately equal (homogeneity of variances). • Hypotheses: • Null Hypothesis (H0): The means of the two groups are equal. • 𝐻0: 1= 2 𝜇 𝜇 • Alternative Hypothesis (H1): The means of the two groups are not equal. • 𝐻1: 1≠ 2 𝜇 𝜇
  • 64.
    Steps to Performan Independent T- Test: 1.State the hypotheses: Define the null and alternative hypotheses. 2.Choose the significance level (α): Common choices are 0.05, 0.01, or 0.10. 3.Calculate the sample means and variances: Compute the means and variances for both groups. 4.Calculate the test statistic: Use the formula provided above. 5.Determine the degrees of freedom: Use the degrees of freedom formula provided above. 6.Find the critical t-value: Refer to the t-distribution table or use statistical software. 7.Compare the test statistic to the critical t-value: Alternatively, compare the p-value to α. 8.Make a decision: Based on the comparison, decide to reject or fail to reject the null hypothesis. 9.Draw a conclusion: Interpret the result in the context of the research question.
  • 66.
    Conclusion •It would helpif you used the suggestions given in this blog to find out what works for you because there is no particular method to pick out outstanding or fascinating research problems. •Keep reading and asking questions before the specific issue you've been looking for is found!

Editor's Notes

  • #46 © Copyright PresentationGO.com – The free PowerPoint and Google Slides template library