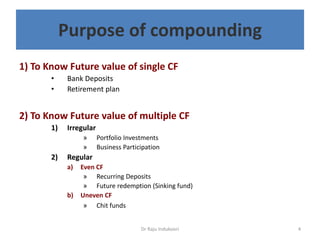
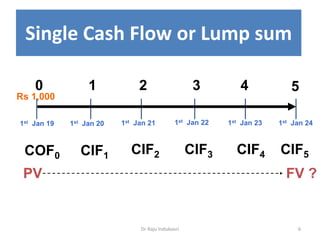
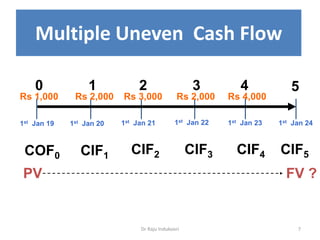
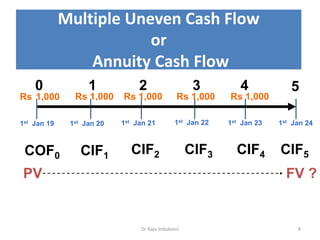
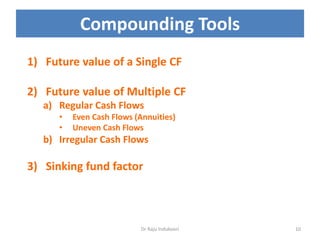
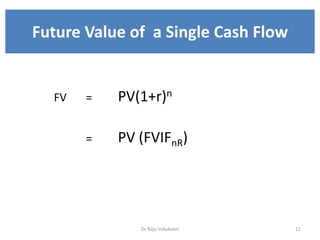
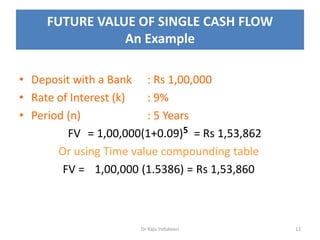
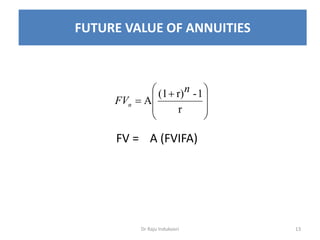
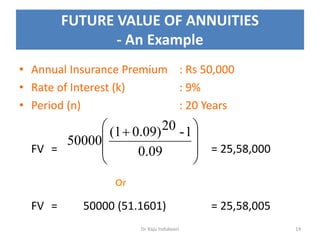
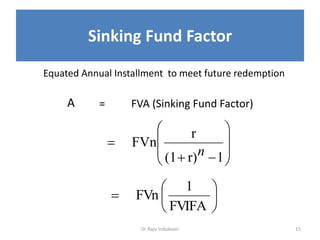
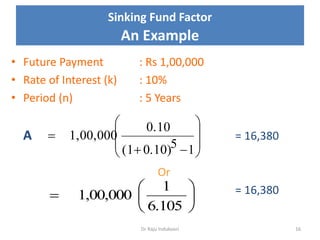
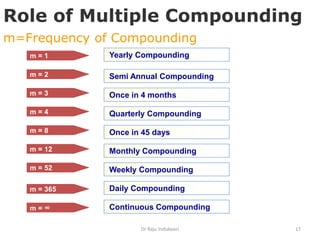
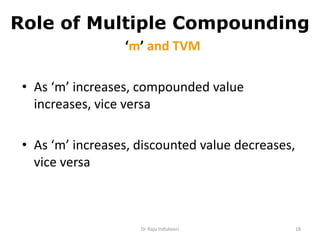
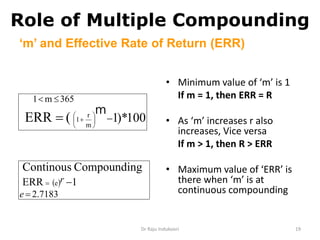
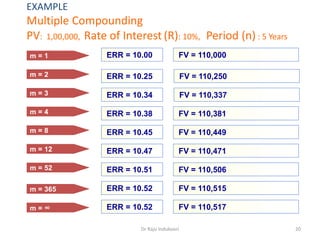
This analysis is an important tool used to optimize the capital structure for highest earnings for shareholders
It helps in understanding the sensitivity of EPS at given level of Earning before Interest & Tax under different sources of financing
It helps in analyzing how capital structure decision is important to raise the value of firm
An optimal financing structure minimizes the cost of capital and maximizes the earnings
Earning Per Share under different Capital structure plans
Plan 1 ( Only Equity Shares )
EPS = (EBIT (1−Tax rate))/(No. of Outstanding Shares)
Plan 2 ( Equity Shares & Debt )
EPS = ((EBIT −Interest) (1−Tax rate))/(No. of Outstanding Shares)
Plan 3 (Equity, Debt & Preference Shares)
EPS = ((EBIT −Interest) (1−Tax rate)−Pref. Dividend)/(No. of Outstanding Shares)
Plan 4 (Equity shares & Preference Shares)
EPS = (EBIT (1−Tax rate)−Pref. Dividend)/(No. of Outstanding Shares)
Thank You For Waching
Subscribe to DevTech Finance
Cost of Preference Capital Soved Problems-kpuma reur
The Preference Capital carries a cost. The Cost of Preference Capital is calculated as follows:
Preference Shares may be issued at Par, Premium, Discount.
Cost of Redeemable Preference Shares
time value of money
,
concept of time value of money
,
significance of time value of money
,
present value vs future value
,
solve for the present value
,
simple vs compound interest rate
,
nominal vs effective annual interest rates
,
future value of a lump sum
,
solve for the future value
,
present value of a lump sum
,
types of annuity
,
future value of an annuity
Weighted average cost is the average of the costs of specific sources of capital employed in a business, properly weighted by the proportion they hold in the firm’s capital structure.
Book Value :
Value shown in the balance sheet is called book value. Weightage to each source of finance is given on the basis of book value as recorded in the balance sheet.
Market Value :
Market value represent prices of prevailing in the stock market for securities. So current market price are applied in ascertaining the weightage.
Risk And Return In Financial Management PowerPoint Presentation SlidesSlideTeam
Analyze investment risk and profitability with this professionally designed Risk and Return in Financial Management PowerPoint Presentation Slides. The content ready portfolio risk-return trade-off PowerPoint compete deck comprises of PPT slides such as risk and return of stock bonds, and T-bills, investment strategies of predefined portfolios, risk and return of portfolio manager, measuring stock volatility proportionate, portfolio return analysis, calculating asset beta, portfolio value at risk, ranking the passive income streams impact to name a few. Explain the relationship between risk on investing in the financial market with potential return using portfolio risk analysis PPT slides. Utilize the visually appealing risk-reward relationship presentation design to structure your financial presentation. Furthermore, portfolio risk-return in security analysis PPT visuals are completely customizable. You can add or delete the content if needed. Download this visually appealing security analysis and portfolio management presentation deck to manage investment risk. Our Risk And Return In Financial Management PowerPoint Presentation Slides ensure you feel joyous. You will find the inspiration you desire.
This presentation covers the basics of Dividend Discount Model (DDM). Firstly, fundamental formula for valuing a stock using DDM is discussed. After that, 3 cases i.e DDM for zero growth, constant growth, and variable growth stocks, are discussed.
risk and return. Defining Return, Return Example, Defining Risk,Determining Expected Return , How to Determine the Expected Return and Standard Deviation, Determining Standard Deviation (Risk Measure), Portfolio Risk and Expected Return Example, Determining Portfolio Expected Return, Determining Portfolio Standard Deviation, Summary of the Portfolio Return and Risk Calculation, Total Risk = Systematic Risk + Unsystematic Risk,
TVM, Future Value Interest Factor (FVIF), Present Value Interest Factor (PVIF), present value interest factor of an annuity (PVIFA)
Using estimated rates of return, you can compare the value of the annuity payments to the lump sum.
The present value interest factor may only be calculated if the annuity payments are for a predetermined amount spanning a predetermined range of time.
Time Value of Money Formula
FV = PV x [ 1 + (i / n) ] (n x t)
Formula for Future Value Interest factor:
FVIF = (1+r)n
Formula for PVIF
PVIF = 1 / (1 + r)n
How to Split Bills in the Odoo 17 POS ModuleCeline George
Bills have a main role in point of sale procedure. It will help to track sales, handling payments and giving receipts to customers. Bill splitting also has an important role in POS. For example, If some friends come together for dinner and if they want to divide the bill then it is possible by POS bill splitting. This slide will show how to split bills in odoo 17 POS.
2024.06.01 Introducing a competency framework for languag learning materials ...Sandy Millin
http://sandymillin.wordpress.com/iateflwebinar2024
Published classroom materials form the basis of syllabuses, drive teacher professional development, and have a potentially huge influence on learners, teachers and education systems. All teachers also create their own materials, whether a few sentences on a blackboard, a highly-structured fully-realised online course, or anything in between. Despite this, the knowledge and skills needed to create effective language learning materials are rarely part of teacher training, and are mostly learnt by trial and error.
Knowledge and skills frameworks, generally called competency frameworks, for ELT teachers, trainers and managers have existed for a few years now. However, until I created one for my MA dissertation, there wasn’t one drawing together what we need to know and do to be able to effectively produce language learning materials.
This webinar will introduce you to my framework, highlighting the key competencies I identified from my research. It will also show how anybody involved in language teaching (any language, not just English!), teacher training, managing schools or developing language learning materials can benefit from using the framework.
Operation “Blue Star” is the only event in the history of Independent India where the state went into war with its own people. Even after about 40 years it is not clear if it was culmination of states anger over people of the region, a political game of power or start of dictatorial chapter in the democratic setup.
The people of Punjab felt alienated from main stream due to denial of their just demands during a long democratic struggle since independence. As it happen all over the word, it led to militant struggle with great loss of lives of military, police and civilian personnel. Killing of Indira Gandhi and massacre of innocent Sikhs in Delhi and other India cities was also associated with this movement.
Unit 8 - Information and Communication Technology (Paper I).pdfThiyagu K
This slides describes the basic concepts of ICT, basics of Email, Emerging Technology and Digital Initiatives in Education. This presentations aligns with the UGC Paper I syllabus.
Synthetic Fiber Construction in lab .pptxPavel ( NSTU)
Synthetic fiber production is a fascinating and complex field that blends chemistry, engineering, and environmental science. By understanding these aspects, students can gain a comprehensive view of synthetic fiber production, its impact on society and the environment, and the potential for future innovations. Synthetic fibers play a crucial role in modern society, impacting various aspects of daily life, industry, and the environment. ynthetic fibers are integral to modern life, offering a range of benefits from cost-effectiveness and versatility to innovative applications and performance characteristics. While they pose environmental challenges, ongoing research and development aim to create more sustainable and eco-friendly alternatives. Understanding the importance of synthetic fibers helps in appreciating their role in the economy, industry, and daily life, while also emphasizing the need for sustainable practices and innovation.
The Indian economy is classified into different sectors to simplify the analysis and understanding of economic activities. For Class 10, it's essential to grasp the sectors of the Indian economy, understand their characteristics, and recognize their importance. This guide will provide detailed notes on the Sectors of the Indian Economy Class 10, using specific long-tail keywords to enhance comprehension.
For more information, visit-www.vavaclasses.com
Students, digital devices and success - Andreas Schleicher - 27 May 2024..pptxEduSkills OECD
Andreas Schleicher presents at the OECD webinar ‘Digital devices in schools: detrimental distraction or secret to success?’ on 27 May 2024. The presentation was based on findings from PISA 2022 results and the webinar helped launch the PISA in Focus ‘Managing screen time: How to protect and equip students against distraction’ https://www.oecd-ilibrary.org/education/managing-screen-time_7c225af4-en and the OECD Education Policy Perspective ‘Students, digital devices and success’ can be found here - https://oe.cd/il/5yV
3. Dr Raju Indukoori 3
Future Value of Money
It is the Process of
Compounding
PV of money
for a
Future Period of Time
4. Dr Raju Indukoori 4
Purpose of compounding
1) To Know Future value of single CF
• Bank Deposits
• Retirement plan
2) To Know Future value of multiple CF
1) Irregular
» Portfolio Investments
» Business Participation
2) Regular
a) Even CF
» Recurring Deposits
» Future redemption (Sinking fund)
b) Uneven CF
» Chit funds
6. Dr Raju Indukoori 6
Single Cash Flow or Lump sum
0 1 2 3 54
1st Jan 19
CIF2 CIF3 CIF4CIF1 CIF5COF0
Rs 1,000
1st Jan 20 1st Jan 221st Jan 21 1st Jan 23 1st Jan 24
PV FV ?
7. Dr Raju Indukoori 7
Multiple Uneven Cash Flow
0 1 2 3 54
1st Jan 19
CIF2 CIF3 CIF4CIF1 CIF5COF0
Rs 1,000
1st Jan 20 1st Jan 221st Jan 21 1st Jan 23 1st Jan 24
PV FV ?
Rs 2,000 Rs 3,000 Rs 2,000 Rs 4,000
8. Dr Raju Indukoori 8
Multiple Uneven Cash Flow
or
Annuity Cash Flow
0 1 2 3 54
1st Jan 19
CIF2 CIF3 CIF4CIF1 CIF5COF0
Rs 1,000
1st Jan 20 1st Jan 221st Jan 21 1st Jan 23 1st Jan 24
PV FV ?
Rs 1,000 Rs 1,000 Rs 1,000 Rs 1,000
10. Dr Raju Indukoori 10
Compounding Tools
1) Future value of a Single CF
2) Future value of Multiple CF
a) Regular Cash Flows
• Even Cash Flows (Annuities)
• Uneven Cash Flows
b) Irregular Cash Flows
3) Sinking fund factor
11. Dr Raju Indukoori 11
Future Value of a Single Cash Flow
FV = PV(1+r)n
= PV (FVIFnR)
12. Dr Raju Indukoori 12
FUTURE VALUE OF SINGLE CASH FLOW
An Example
• Deposit with a Bank : Rs 1,00,000
• Rate of Interest (k) : 9%
• Period (n) : 5 Years
FV = 1,00,000(1+0.09)5 = Rs 1,53,862
Or using Time value compounding table
FV = 1,00,000 (1.5386) = Rs 1,53,860
13. Dr Raju Indukoori 13
FUTURE VALUE OF ANNUITIES
FV = A (FVIFA)
r
1-r)(1
A
n
FVn
14. Dr Raju Indukoori 14
FUTURE VALUE OF ANNUITIES
- An Example
• Annual Insurance Premium : Rs 50,000
• Rate of Interest (k) : 9%
• Period (n) : 20 Years
FV = = 25,58,000
Or
FV = 50000 (51.1601) = 25,58,005
0.09
1-200.09)(1
50000
15. Dr Raju Indukoori 15
Sinking Fund Factor
Equated Annual Installment to meet future redemption
A = FVA (Sinking Fund Factor)
1r)(1
r
FVn
n
FVIFA
1
FVn
16. Dr Raju Indukoori 16
Sinking Fund Factor
An Example
• Future Payment : Rs 1,00,000
• Rate of Interest (k) : 10%
• Period (n) : 5 Years
A = 16,380
Or
= 16,380
15.10)0(1
0.10
1,00,000
6.105
1
1,00,000
17. Dr Raju Indukoori 17
Yearly Compoundingm = 1
Role of Multiple Compounding
m=Frequency of Compounding
m = 2
m = 3
m = 4
m = 8
m = 12
m = 52
m = 365
m = ∞
Semi Annual Compounding
Once in 4 months
Quarterly Compounding
Once in 45 days
Monthly Compounding
Weekly Compounding
Daily Compounding
Continuous Compounding
18. Dr Raju Indukoori 18
Role of Multiple Compounding
‘m’ and TVM
• As ‘m’ increases, compounded value
increases, vice versa
• As ‘m’ increases, discounted value decreases,
vice versa
19. Dr Raju Indukoori 19
Role of Multiple Compounding
• Minimum value of ‘m’ is 1
If m = 1, then ERR = R
• As ‘m’ increases r also
increases, Vice versa
If m > 1, then R > ERR
• Maximum value of ‘ERR’ is
there when ‘m’ is at
continuous compounding
100*)1m
r
1(ERR
365m1
m
7183.2
1ERR e
gCompoundinContinous
e
r
‘m’ and Effective Rate of Return (ERR)
20. Dr Raju Indukoori 20
ERR = 10.00m = 1
EXAMPLE
Multiple Compounding
PV: 1,00,000, Rate of Interest (R): 10%, Period (n) : 5 Years
m = 2
m = 3
m = 4
m = 8
m = 12
m = 52
m = 365
m = ∞
FV = 110,000
FV = 110,337
FV = 110,381
FV = 110,449
FV = 110,471
FV = 110,506
FV = 110,515
FV = 110,517
FV = 110,250
ERR = 10.51
ERR = 10.52
ERR = 10.52
ERR = 10.38
ERR = 10.45
ERR = 10.47
ERR = 10.25
ERR = 10.34