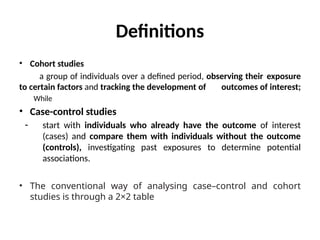
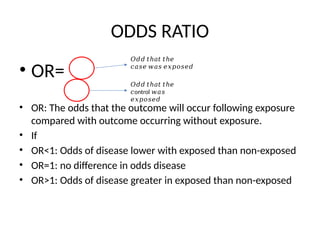
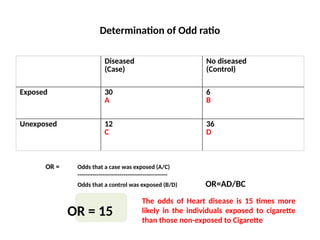
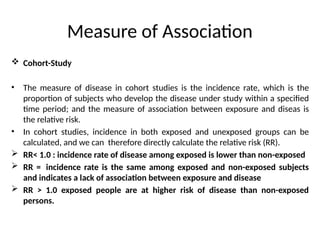
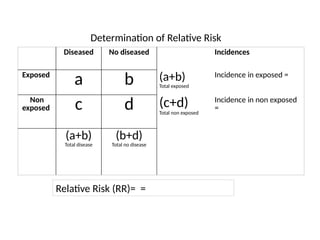
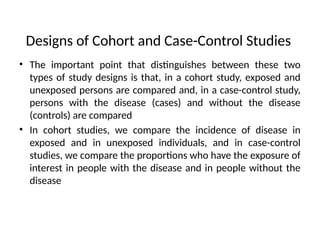
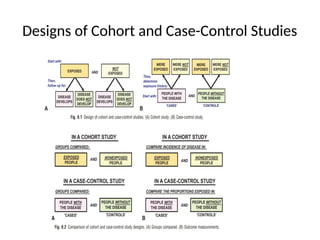
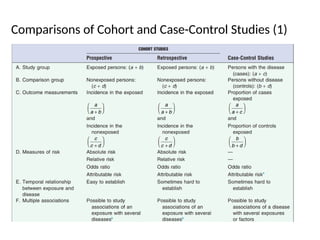
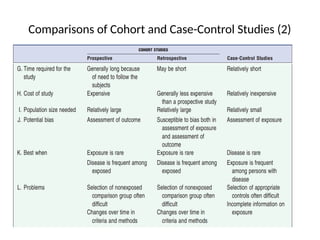
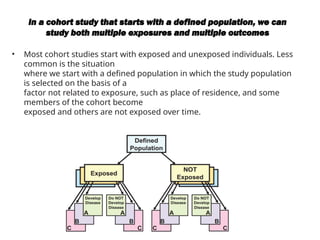
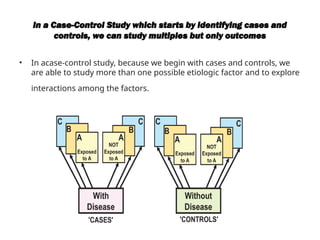
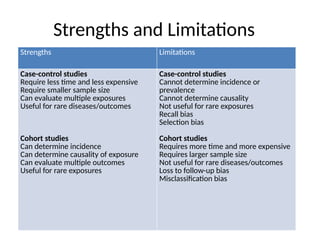
Comparing Cohort and
Case-Control Studies
Group 9
Supervisor: Dr. Umi, Dr. Moneer
Group members
1. Dr. Nimron Sekanabo 2024-08-31564
2. Dr. Suleiman
3. Dr. Fatuma
4. Dr. Segane Martin
Content Outline
• Introduction
• Cohort study and Case-Control study
• Measures of association
• Designs of Cohort and Case-Control Studies
• Strengths and Limitations
• Comparisons of Cohort and Case-Control
Studies
Introduction
• Cohort and case-control methodologies are the main
tools for analytical epidemiological research
• They have different approaches
Definitions
• Cohort studies
a group of individuals over a defined period, observing their exposure
to certain factors and tracking the development of outcomes of interest;
While
• Case-control studies
- start with individuals who already have the outcome of interest
(cases) and compare them with individuals without the outcome
(controls), investigating past exposures to determine potential
associations.
• The conventional way of analysing case–control and cohort
studies is through a 2×2 table
Cohort and Case-Control Studies
• Cohort Study Vs. Case-Contol Studies
The starting point of a cohort study is the recording of healthy subjects
with and without exposure to the putative agent or the characteristic
being studied.
Individuals exposed to the agent under study (index subjects) are
followed over time and their health status is observed and recorded
during the course of the study.
In order to compare the occurrence of disease in exposed subjects with
its occurrence in non-exposed subjects, the health status of a group of
individuals not exposed to the agent under study (control subjects) is
followed in the same way as that of the group of index subjects.
Case-Control Study
• Case-Control Study
The starting point of a case-control study is subjects with
the disease or condition under study (cases).
The cases’ history of exposure or other characteristics, or
both, prior to onset of the disease, is recorded through
interview and sometimes by means of records and other
sources.
A comparison group consisting of individuals without the
disease under study (controls) are assembled, and their
past history is recorded in the same way as for the cases.
Measure of Association
Case-Control
• The measure of association between
exposure and occurrence of disease in
case-control studies is the so-called
odds ratio:
– the ratio of odds of exposure in diseased
subjects to the odds of exposure in the
non-diseased.
Group 1
42 persons
Group 1
42 persons
Yes
No
Yes
No
?
? Non-Heart
(Controls)
Heart
Disease
(Cases)
Exposure
Exposur
e
Example
ODDS RATIO
• OR=
• OR: The odds that the outcome will occur following exposure
compared with outcome occurring without exposure.
• If
• OR<1: Odds of disease lower with exposed than non-exposed
• OR=1: no difference in odds disease
• OR>1: Odds of disease greater in exposed than non-exposed
𝑂𝑑𝑑 𝑡ℎ𝑎𝑡 𝑡ℎ𝑒
𝑐𝑎𝑠𝑒 𝑤𝑎𝑠 𝑒𝑥𝑝𝑜𝑠𝑒𝑑
𝑂𝑑𝑑 𝑡ℎ𝑎𝑡 𝑡ℎ𝑒
𝑐ontrol 𝑤𝑎𝑠
𝑒𝑥𝑝𝑜𝑠𝑒𝑑
Determination of Odd ratio
Diseased
(Case)
No diseased
(Control)
Exposed 30
A
6
B
Unexposed 12
C
36
D
OR = 15
The odds of Heart disease is 15 times more
likely in the individuals exposed to cigarette
than those non-exposed to Cigarette
OR = Odds that a case was exposed (A/C)
-----------------------------------------------
Odds that a control was exposed (B/D) OR=AD/BC
Measure of Association
 Cohort-Study
• The measure of disease in cohort studies is the incidence rate, which is the
proportion of subjects who develop the disease under study within a specified
time period; and the measure of association between exposure and diseas is
the relative risk.
• In cohort studies, incidence in both exposed and unexposed groups can be
calculated, and we can therefore directly calculate the relative risk (RR).
 RR< 1.0 : incidence rate of disease among exposed is lower than non-exposed
 RR = incidence rate is the same among exposed and non-exposed subjects
and indicates a lack of association between exposure and disease
 RR > 1.0 exposed people are at higher risk of disease than non-exposed
persons.
Determination of Relative Risk
Diseased No diseased Incidences
Exposed
a b (a+b)
Total exposed
Incidence in exposed =
Non
exposed c d (c+d)
Total non exposed
Incidence in non exposed
=
(a+b)
Total disease
(b+d)
Total no disease
Relative Risk (RR)= =
• Fourteen of the volunteers who were given the new medicine have an
upset stomach, and 42 of the volunteers who were given the new
medicine do not have an upset stomach. In volunteers who did not take
the medication, two people have an upset stomach, and 83 do not have
an upset stomach.
Diseased Non
diseased
Exposed 14
a
42
b
Non
exposed
2
c
83
d
Incidence in Non Exposed= =
0.024
Incidence in Exposed = =
0.25
Relative Risk (RR)= = = 10.42
Therefore, it is 10.4 times more likely to have an upset stomach after
taking the new medicine in this study than if you did not take the new
medicine in the study.
Example
Designs of Cohort and Case-Control Studies
• The important point that distinguishes between these two
types of study designs is that, in a cohort study, exposed and
unexposed persons are compared and, in a case-control study,
persons with the disease (cases) and without the disease
(controls) are compared
• In cohort studies, we compare the incidence of disease in
exposed and in unexposed individuals, and in case-control
studies, we compare the proportions who have the exposure of
interest in people with the disease and in people without the
disease
Designs of Cohort and Case-Control Studies
Comparisons of Cohort and Case-Control Studies (1)
Comparisons of Cohort and Case-Control Studies (2)
In a cohort study that starts with a defined population, we can
study both multiple exposures and multiple outcomes
• Most cohort studies start with exposed and unexposed individuals. Less
common is the situation
where we start with a defined population in which the study population
is selected on the basis of a
factor not related to exposure, such as place of residence, and some
members of the cohort become
exposed and others are not exposed over time.
In a Case-Control Study which starts by identifying cases and
controls, we can study multiples but only outcomes
• In acase-control study, because we begin with cases and controls, we
are able to study more than one possible etiologic factor and to explore
interactions among the factors.
Strengths and Limitations
Strengths Limitations
Case-control studies
Require less time and less expensive
Require smaller sample size
Can evaluate multiple exposures
Useful for rare diseases/outcomes
Cohort studies
Can determine incidence
Can determine causality of exposure
Can evaluate multiple outcomes
Useful for rare exposures
Case-control studies
Cannot determine incidence or
prevalence
Cannot determine causality
Not useful for rare exposures
Recall bias
Selection bias
Cohort studies
Requires more time and more expensive
Requires larger sample size
Not useful for rare diseases/outcomes
Loss to follow-up bias
Misclassification bias
THANK
YOU

Comparing Cohort and Case-Control Studies EDITED.pptx

  • 1.
    Comparing Cohort and Case-ControlStudies Group 9 Supervisor: Dr. Umi, Dr. Moneer
  • 2.
    Group members 1. Dr.Nimron Sekanabo 2024-08-31564 2. Dr. Suleiman 3. Dr. Fatuma 4. Dr. Segane Martin
  • 3.
    Content Outline • Introduction •Cohort study and Case-Control study • Measures of association • Designs of Cohort and Case-Control Studies • Strengths and Limitations • Comparisons of Cohort and Case-Control Studies
  • 4.
    Introduction • Cohort andcase-control methodologies are the main tools for analytical epidemiological research • They have different approaches
  • 5.
    Definitions • Cohort studies agroup of individuals over a defined period, observing their exposure to certain factors and tracking the development of outcomes of interest; While • Case-control studies - start with individuals who already have the outcome of interest (cases) and compare them with individuals without the outcome (controls), investigating past exposures to determine potential associations. • The conventional way of analysing case–control and cohort studies is through a 2×2 table
  • 6.
    Cohort and Case-ControlStudies • Cohort Study Vs. Case-Contol Studies The starting point of a cohort study is the recording of healthy subjects with and without exposure to the putative agent or the characteristic being studied. Individuals exposed to the agent under study (index subjects) are followed over time and their health status is observed and recorded during the course of the study. In order to compare the occurrence of disease in exposed subjects with its occurrence in non-exposed subjects, the health status of a group of individuals not exposed to the agent under study (control subjects) is followed in the same way as that of the group of index subjects.
  • 7.
    Case-Control Study • Case-ControlStudy The starting point of a case-control study is subjects with the disease or condition under study (cases). The cases’ history of exposure or other characteristics, or both, prior to onset of the disease, is recorded through interview and sometimes by means of records and other sources. A comparison group consisting of individuals without the disease under study (controls) are assembled, and their past history is recorded in the same way as for the cases.
  • 8.
    Measure of Association Case-Control •The measure of association between exposure and occurrence of disease in case-control studies is the so-called odds ratio: – the ratio of odds of exposure in diseased subjects to the odds of exposure in the non-diseased.
  • 9.
    Group 1 42 persons Group1 42 persons Yes No Yes No ? ? Non-Heart (Controls) Heart Disease (Cases) Exposure Exposur e Example
  • 10.
    ODDS RATIO • OR= •OR: The odds that the outcome will occur following exposure compared with outcome occurring without exposure. • If • OR<1: Odds of disease lower with exposed than non-exposed • OR=1: no difference in odds disease • OR>1: Odds of disease greater in exposed than non-exposed 𝑂𝑑𝑑 𝑡ℎ𝑎𝑡 𝑡ℎ𝑒 𝑐𝑎𝑠𝑒 𝑤𝑎𝑠 𝑒𝑥𝑝𝑜𝑠𝑒𝑑 𝑂𝑑𝑑 𝑡ℎ𝑎𝑡 𝑡ℎ𝑒 𝑐ontrol 𝑤𝑎𝑠 𝑒𝑥𝑝𝑜𝑠𝑒𝑑
  • 11.
    Determination of Oddratio Diseased (Case) No diseased (Control) Exposed 30 A 6 B Unexposed 12 C 36 D OR = 15 The odds of Heart disease is 15 times more likely in the individuals exposed to cigarette than those non-exposed to Cigarette OR = Odds that a case was exposed (A/C) ----------------------------------------------- Odds that a control was exposed (B/D) OR=AD/BC
  • 12.
    Measure of Association Cohort-Study • The measure of disease in cohort studies is the incidence rate, which is the proportion of subjects who develop the disease under study within a specified time period; and the measure of association between exposure and diseas is the relative risk. • In cohort studies, incidence in both exposed and unexposed groups can be calculated, and we can therefore directly calculate the relative risk (RR).  RR< 1.0 : incidence rate of disease among exposed is lower than non-exposed  RR = incidence rate is the same among exposed and non-exposed subjects and indicates a lack of association between exposure and disease  RR > 1.0 exposed people are at higher risk of disease than non-exposed persons.
  • 13.
    Determination of RelativeRisk Diseased No diseased Incidences Exposed a b (a+b) Total exposed Incidence in exposed = Non exposed c d (c+d) Total non exposed Incidence in non exposed = (a+b) Total disease (b+d) Total no disease Relative Risk (RR)= =
  • 14.
    • Fourteen ofthe volunteers who were given the new medicine have an upset stomach, and 42 of the volunteers who were given the new medicine do not have an upset stomach. In volunteers who did not take the medication, two people have an upset stomach, and 83 do not have an upset stomach. Diseased Non diseased Exposed 14 a 42 b Non exposed 2 c 83 d Incidence in Non Exposed= = 0.024 Incidence in Exposed = = 0.25 Relative Risk (RR)= = = 10.42 Therefore, it is 10.4 times more likely to have an upset stomach after taking the new medicine in this study than if you did not take the new medicine in the study. Example
  • 15.
    Designs of Cohortand Case-Control Studies • The important point that distinguishes between these two types of study designs is that, in a cohort study, exposed and unexposed persons are compared and, in a case-control study, persons with the disease (cases) and without the disease (controls) are compared • In cohort studies, we compare the incidence of disease in exposed and in unexposed individuals, and in case-control studies, we compare the proportions who have the exposure of interest in people with the disease and in people without the disease
  • 16.
    Designs of Cohortand Case-Control Studies
  • 17.
    Comparisons of Cohortand Case-Control Studies (1)
  • 18.
    Comparisons of Cohortand Case-Control Studies (2)
  • 19.
    In a cohortstudy that starts with a defined population, we can study both multiple exposures and multiple outcomes • Most cohort studies start with exposed and unexposed individuals. Less common is the situation where we start with a defined population in which the study population is selected on the basis of a factor not related to exposure, such as place of residence, and some members of the cohort become exposed and others are not exposed over time.
  • 20.
    In a Case-ControlStudy which starts by identifying cases and controls, we can study multiples but only outcomes • In acase-control study, because we begin with cases and controls, we are able to study more than one possible etiologic factor and to explore interactions among the factors.
  • 21.
    Strengths and Limitations StrengthsLimitations Case-control studies Require less time and less expensive Require smaller sample size Can evaluate multiple exposures Useful for rare diseases/outcomes Cohort studies Can determine incidence Can determine causality of exposure Can evaluate multiple outcomes Useful for rare exposures Case-control studies Cannot determine incidence or prevalence Cannot determine causality Not useful for rare exposures Recall bias Selection bias Cohort studies Requires more time and more expensive Requires larger sample size Not useful for rare diseases/outcomes Loss to follow-up bias Misclassification bias
  • 22.

Editor's Notes