Download as PDF, PPTX

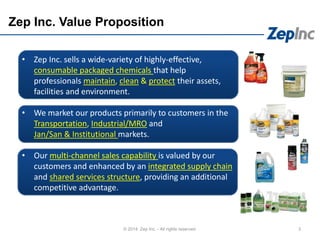
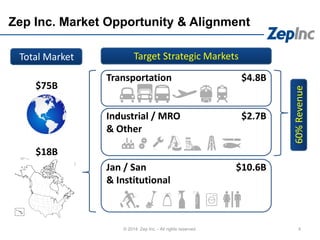
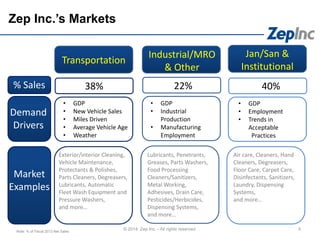
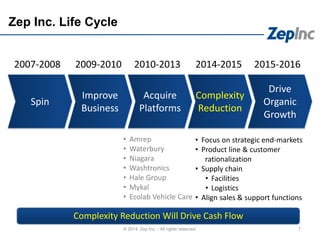
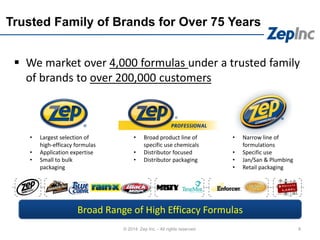
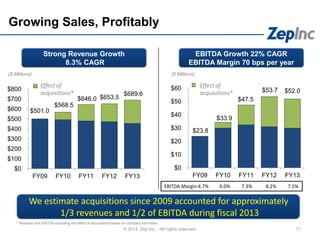
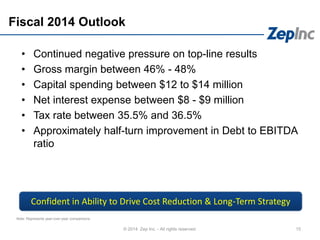
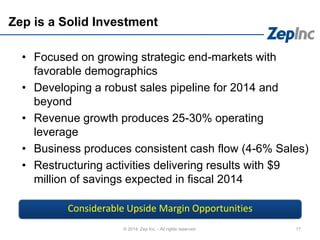

Zep Inc. sells highly-effective consumable chemicals that help professionals maintain, clean and protect assets and facilities. It markets over 4,000 formulas under trusted brands to over 200,000 customers. Zep aims to reduce complexity and drive organic growth through strategic initiatives like product line rationalization and supply chain optimization. It expects these actions to generate $9 million in cost savings in 2014 and profitably grow its business toward $1 billion in revenue within 5 years.