Download as PDF, PPTX


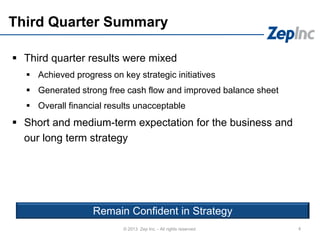
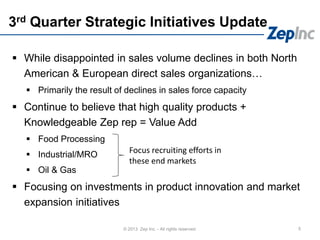


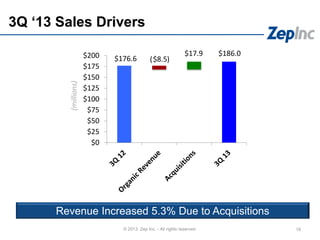
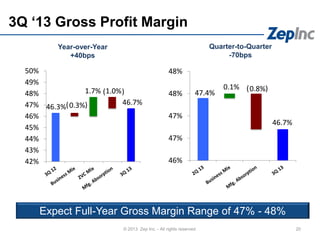
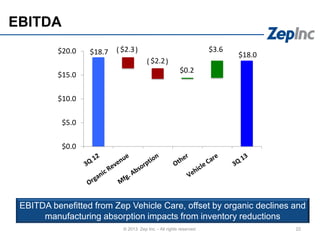
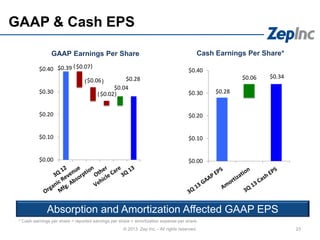


- Third quarter results were mixed with progress made on strategic initiatives but overall financial results were unacceptable. - Revenue increased due to acquisitions but was offset by declines in other areas, while gross profit margins grew. - Expectations are for flat to declining revenue in the near term as complexity reduction plans are accelerated, but these plans aim to improve free cash flow and margins.


