Download as PDF, PPTX

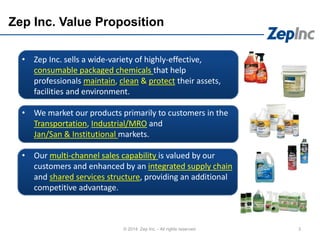
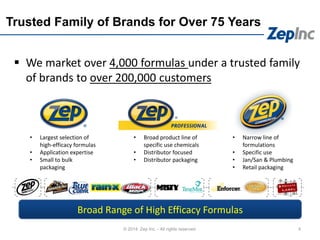
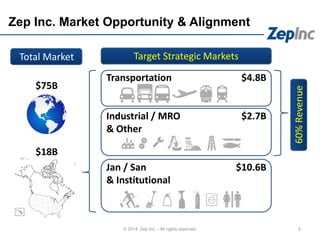
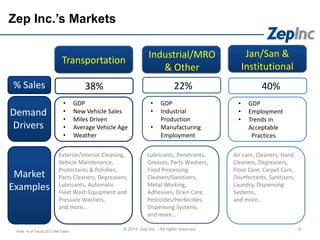
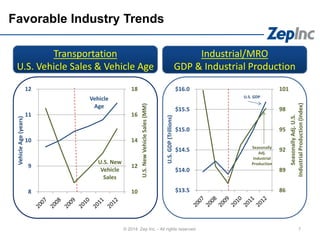
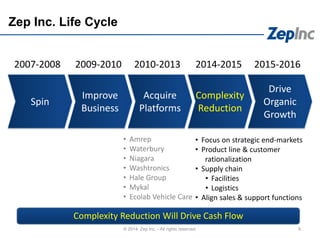
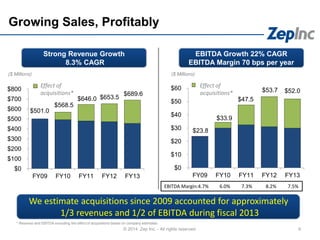
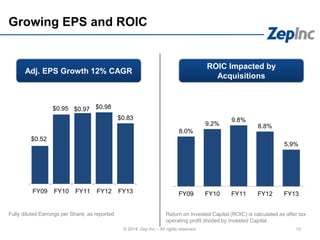
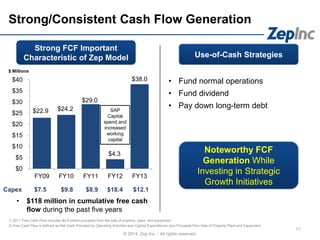
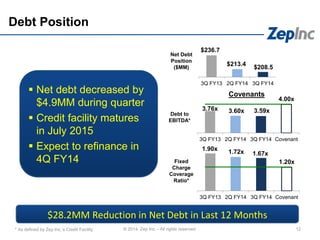
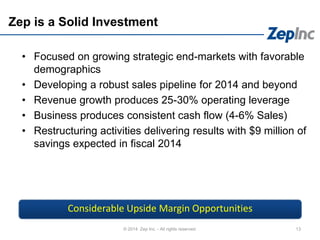
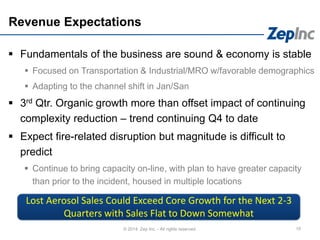
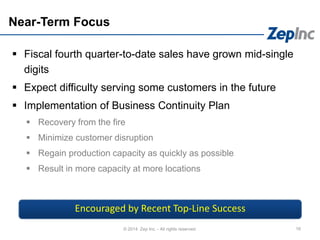
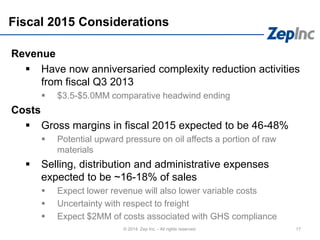
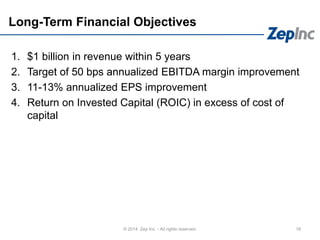
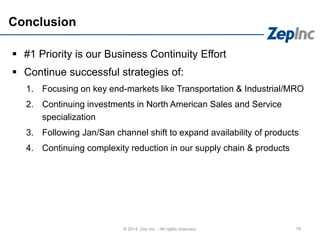

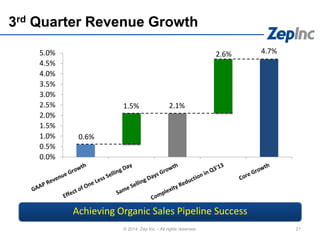
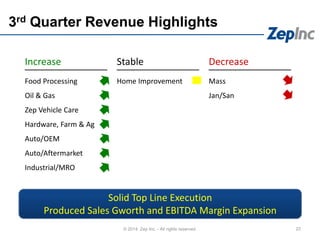
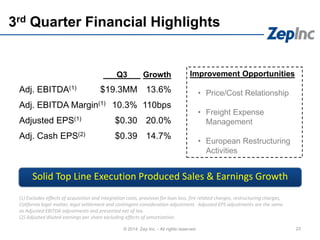
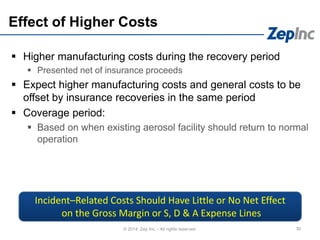


Zep Inc. held an investor presentation in August 2014 to provide an overview of the company and its outlook. The presentation discussed Zep's portfolio of brands serving transportation, industrial/MRO, and jan/san markets. It highlighted trends favoring these end markets as well as Zep's history of acquisitions and initiatives to streamline operations and reduce complexity. Zep has generated strong revenue and earnings growth but expects near-term challenges from a fire that impacted its aerosol production capacity. Overall sales are projected to be flat to down in the next 2-3 quarters before capacity is restored.


