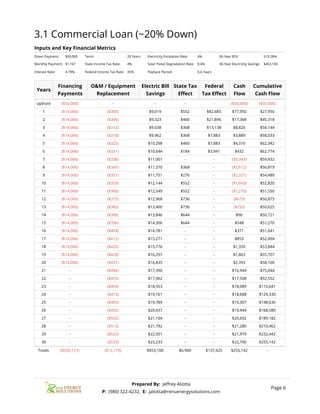
1. Prepared For
Sample
(704) 491-7850
Sample@gmail.com
This proposal describes costs and
benets of a solar photo voltaic
(PV) generating system for your
commercial property. This is an
initial estimate based upon
information gathered from your
utility bills, views of your property
from Google Earth. The nal solar
PV system size, design and
nancial numbers are pending (1)
Physical Site Survey and
Engineering (2) Financing
Application (if applicable) and (3)
Agreement with your Utility
concerning post-solar rate
structure and grid interconnection
terms. Renu Energy Licensing
Information - NC General
Contractor License: 76615 - NC
Electrical License: 20334u - SC
Prepared By
Je땚䋚rey Aliotta
(980) 322-4232
jaliotta@renuenergysolutions.com
3/21/2016
Sample
2. Table Of Contents
1. Project Summary 1
2. Project Details
2.1 PV System Details 2
2.2 Rebates and Incentives 3
2.3 Utility Rates 4
2.4 Current Electric Bill 4
2.5 New Electric Bill 5
3. Cash Flow Analysis
3.1 Commercial Loan (~20% Down) 6
3.2 Cash 7
3. 1. Project Summary
Payment Options Commercial Loan (~20% Down) Cash
Down Payment $50,000 $230,000
Monthly Payment $1,167 -
Interest Rate 4.79% 0%
Term 20 Years 1 Years
Rebates and Incentives $144,325 $144,325
30-Year Electricity Savings $453,100 $453,100
30-Year ROI 510.28% 154.46%
Payback Period 0.6 Years 9.00 Years
1
Combined Solar PV Rating
Power Rating: 100,000 W DC
Power Rating: 84,550 W AC-CEC
Cumulative Energy Costs By Payment Option
Avoided Utility Cost Commercial Loan (~20% Down) Cash
0 Year 5 Year 10 Year 15 Year 20 Year 25 Year 30
$0
$200,000
$400,000
Cumulative Energy Cost
Page 1
1. Incentive values are estimated and do not include tax e땚䋚ects. Tax deductions savings, if any, are estimated using the following income tax
rates: State - 4%, Federal - 35%.
Prepared By: Je땚䋚rey Aliotta
P: (980) 322-4232, E: jaliotta@renuenergysolutions.com
4. 2.1 PV System Details
General Information
Facility: Sample
Address: 2900 Gri惃ꎏth Street, 28203
Solar PV Equipment Description
Solar Panels: Standard Modules
Inverters: Standard Inverter
Solar PV Equipment Typical Lifespan
Solar Panels: Greater than 30 Years.
Inverters: 25 Years
Solar Power System Cost And Incentives
Solar Power System Cost: $230,000
Federal Tax Credit: -$69,000
Federal Depreciation: -$68,425
State (NC) Deprecation: -$6,900
Net Solar Power System Cost: $85,675
Solar PV System Rating
Power Rating: 100,000 W DC
Power Rating: 84,550 W AC-CEC
Energy Consumption Mix
Annual Energy Use: 235,459 kWh
Utility: 106,318 kWh (45%)
Solar: 129,141 kWh (55%)
Monthly Energy Consumption vs Production
Consumption (kWh) Solar Production (kWh)
1/25 2/25
2/25 3/25
3/25 4/25
4/25 5/25
5/25 6/25
6/25 7/25
7/25 8/25
8/25 9/25
9/25 10/25
10/25 11/25
11/25 12/25
12/25 1/25
0
10,000
20,000
30,000
40,000
Energy (kWh)
Page 2
Prepared By: Je땚䋚rey Aliotta
P: (980) 322-4232, E: jaliotta@renuenergysolutions.com
5. 2.2 Rebates and Incentives
This section summarizes all incentives available for this project. The actual rebate and incentive amounts
for this project are shown in each example.
Business Energy Investment Tax Credit (ITC)
Businesses that install solar photovoltaic (PV) systems are eligible to receive a tax credit in the amount of
30% of the total PV system cost. Unlike tax deductions, this tax credit can be used to directly o땚䋚set your tax
liability dollar for dollar. If your tax credit exceeds your tax liability you can roll the credit into future tax
periods for 20 years.
System Cost x 30% = Federal Tax Credit
$230,000 x 30% = $69,000
Federal Modied Accelerated Cost-Recovery System (MACRS)
Under the federal Modied Cost Recovery System (MACRS), businesses may recover investments in certain
property through depreciation deductions. The MACRS establishes a set of class lives for various types of
property over which the property may be depreciated. For PV systems, the taxable basis of the equipment
must be reduced by 50% of any federal tax credits associated with the system.
Year Federal Tax Deduction
1 $39,100
2 $62,560
3 $37,536
4 $22,522
5 $22,522
6 $11,261
Totals: $195,500
State (NC) North Carolina Deprecation Schedule
According to the North Carolina 2015 Cost Index and Depreciation Schedules
(http://www.dor.state.nc.us/publications/cost_archive/15archive/2015_costindex.pdf). Solar Photovoltaic
equipment has a specied life of 18 years. The annual deprecation schedule is as follows: 6%, 5%, 4%, 4%,
5%, 2%, 0 %, 4%, 3%, 6%, 6 %, 8%, 8 %, 7%, 7 %.
Year State Tax Deduction
1 $13,800
2 $11,500
3 $9,200
4 $9,200
5 $11,500
6 $4,600
7 $0
8 $9,200
9 $6,900
10 $13,800
11 $13,800
12 $18,400
13 $18,400
Page 3
Prepared By: Je땚䋚rey Aliotta
P: (980) 322-4232, E: jaliotta@renuenergysolutions.com
6. 2.3 Utility Rates
The table below shows the rates associate with your current utility rate schedule (LGS - 100 Billing
Demand).Your estimated electric bills after solar are shown on the following page.
Fixed Charges Energy Charges Demand Charges
Type
LGS - 100 Billing
Demand
Type
LGS - 100 Billing
Demand
Type
LGS - 100 Billing
Demand
A Monthly $23.91 A Tier 1 < 3000 $0.11479 A Tier 2 > 30 $3.81
N/A - A Tier 2 < 12500 $0.07037 N/A -
N/A - A Tier 3 < 18500 $0.06602 N/A -
N/A - A Tier 4 < 152500 $0.05818 N/A -
N/A - A Tier 5 > 152500 $0.05722 N/A -
2.4 Current Electric Bill
The table below shows your annual electricity costs based on the most current utility rates and your
previous 12 months of electrical usage.
Rate Schedule: DUKE - LGS - 100 Billing Demand
Time Periods Energy Use (kWh) Max Demand (kW) Charges
Bill Range & Season Total
NC
Max
Fixed Energy Demand Total
01/25/16 - 02/25/16 A 14,459 52 $25 $1,211 $89 $1,325
02/25/16 - 03/25/16 A 15,000 55 $25 $1,249 $101 $1,375
03/25/15 - 04/25/15 A 15,500 65 $25 $1,284 $141 $1,450
04/25/15 - 05/25/15 A 17,500 65 $25 $1,424 $141 $1,590
05/25/15 - 06/25/15 A 19,000 100 $25 $1,524 $283 $1,832
06/25/15 - 07/25/15 A 25,000 100 $25 $1,894 $283 $2,202
07/25/15 - 08/25/15 A 28,000 100 $25 $2,079 $283 $2,387
08/25/15 - 09/25/15 A 30,000 100 $25 $2,203 $283 $2,511
09/25/15 - 10/25/15 A 25,000 100 $25 $1,894 $283 $2,202
10/25/15 - 11/25/15 A 15,500 75 $25 $1,284 $182 $1,491
11/25/15 - 12/25/15 A 15,500 75 $25 $1,284 $182 $1,491
12/25/15 - 01/25/16 A 15,000 55 $25 $1,249 $101 $1,375
Totals: 235,459 $304 $18,577 $2,350 $21,231
Page 4
Prepared By: Je땚䋚rey Aliotta
P: (980) 322-4232, E: jaliotta@renuenergysolutions.com
7. 2.5 New Electric Bill
Rate Schedule: DUKE - LGS - 100 Billing Demand
Time Periods Energy Use (kWh) Max Demand (kW) Charges
Bill Range & Season Total
NC
Max
Fixed Energy Demand Total
01/25/16 - 02/25/16 A 5,408 52 $25 $545 $89 $659
02/25/16 - 03/25/16 A 4,572 55 $25 $482 $101 $609
03/25/15 - 04/25/15 A 2,745 65 $25 $334 $141 $501
04/25/15 - 05/25/15 A 4,275 65 $25 $460 $141 $627
05/25/15 - 06/25/15 A 4,143 100 $25 $450 $283 $758
06/25/15 - 07/25/15 A 11,592 100 $25 $1,006 $283 $1,314
07/25/15 - 08/25/15 A 15,667 100 $25 $1,295 $283 $1,603
08/25/15 - 09/25/15 A 18,667 100 $25 $1,504 $283 $1,812
09/25/15 - 10/25/15 A 14,796 100 $25 $1,234 $283 $1,542
10/25/15 - 11/25/15 A 7,342 75 $25 $689 $182 $896
11/25/15 - 12/25/15 A 9,007 75 $25 $813 $182 $1,020
12/25/15 - 01/25/16 A 8,104 55 $25 $746 $101 $872
Totals: 106,318 $304 $9,558 $2,350 $12,212
Max Annual Electricity Savings: $9,019
Page 5
Prepared By: Je땚䋚rey Aliotta
P: (980) 322-4232, E: jaliotta@renuenergysolutions.com