More Related Content
Similar to EnergyEastQ22007SupplementarySchedules
Similar to EnergyEastQ22007SupplementarySchedules (20)
EnergyEastQ22007SupplementarySchedules
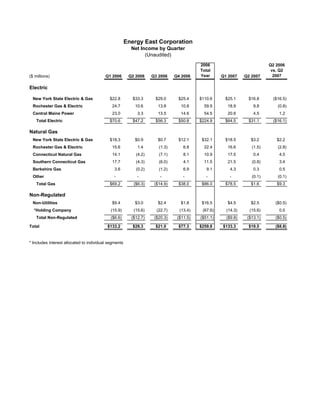
- 1. Energy East Corporation
Net Income by Quarter
(Unaudited)
2006 Q2 2006
Total vs. Q2
Year 2007
($ millions) Q1 2006 Q2 2006 Q3 2006 Q4 2006 Q1 2007 Q2 2007
Electric
New York State Electric & Gas $22.8 $33.3 $29.0 $25.4 $110.6 $25.1 $16.8 ($16.5)
Rochester Gas & Electric 24.7 10.6 13.8 10.8 59.9 18.9 9.8 (0.8)
Central Maine Power 23.0 3.3 13.5 14.6 54.5 20.6 4.5 1.2
Total Electric $70.6 $47.2 $56.3 $50.8 $224.9 $64.5 $31.1 ($16.1)
Natural Gas
New York State Electric & Gas $18.3 $0.9 $0.7 $12.1 $32.1 $18.5 $3.2 $2.2
Rochester Gas & Electric 15.6 1.4 (1.3) 6.8 22.4 16.6 (1.5) (2.8)
Connecticut Natural Gas 14.1 (4.2) (7.1) 8.1 10.9 17.5 0.4 4.5
Southern Connecticut Gas 17.7 (4.3) (6.0) 4.1 11.5 21.5 (0.8) 3.4
Berkshire Gas 3.6 (0.2) (1.2) 6.9 9.1 4.3 0.3 0.5
Other - - - - - - (0.1) (0.1)
Total Gas $69.2 ($6.3) ($14.9) $38.0 $86.0 $78.5 $1.6 $9.3
Non-Regulated
Non-Utilities $9.4 $3.0 $2.4 $1.8 $16.5 $4.5 $2.5 ($0.5)
*Holding Company (15.9) (15.6) (22.7) (13.4) (67.6) (14.3) (15.6) 0.0
Total Non-Regulated ($6.6) ($12.7) ($20.3) ($11.5) ($51.1) ($9.8) ($13.1) ($0.5)
Total $133.2 $28.3 $21.0 $77.3 $259.8 $133.3 $19.5 ($8.8)
* Includes interest allocated to individual segments
- 2. Energy East Corporation
Regulated Utility Sales, Revenue and Weather
(Unaudited)
Sales Revenues Heating Degree Days Cooling Degree Days
(Thousands of MWh for Electric) ($ millions)
(Thousands of dekatherms for Natural Gas)
Normal Normal
% % vs. Q2 % vs. Q2
% Change Change Change 2007 Change 2007
Q2 2006 Q2 2007 Q2 2006 Q2 2007 Q2 2006 Q2 2007 Normal Q2 2006 Q2 2007 Normal
Electric Sales
New York State Electric & Gas* 4,598 4,043 -12% 414 373 -10% 929 962 4% 999 -4% 100 156 56% 102 53%
Rochester Gas & Electric 2,763 2,901 5% 173 179 3% 763 858 12% 914 -6% 177 243 37% 147 65%
Central Maine Power 2,497 2,583 3% 131 133 1% 910 1,065 17% 1,026 4% 104 88 -15% 66 33%
Natural Gas
New York State Electric & Gas 10,342 10,195 -1% 82 82 0% 929 962 4% 999 -4% 100 156 56% 102 53%
Rochester Gas & Electric 7,427 8,566 15% 63 74 17% 763 858 12% 914 -6% 177 243 37% 147 65%
Connecticut Natural Gas 5,213 5,410 4% 61 59 -4% 630 710 13% 751 -5% 221 241 9% 144 67%
Southern Connecticut Gas 4,500 5,042 12% 63 66 4% 644 696 8% 728 -4% 173 178 3% 147 21%
Berkshire Gas 1,507 1,532 2% 14 14 0% 844 930 10% 953 -2% 133 152 14% 71 114%
* includes approximately 1,000 thousand MWh & 400 thousand MWh of wholesale sales in Q2 2006 and Q2 2007 respectively