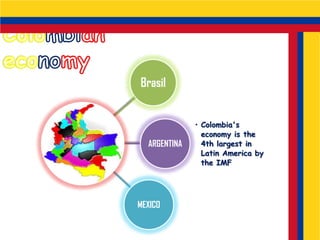
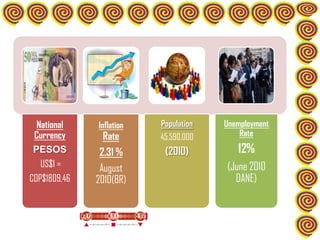
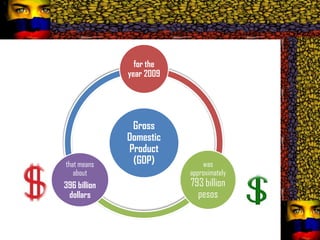
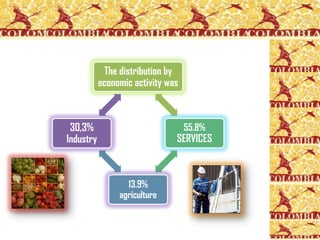
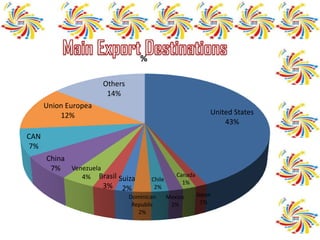
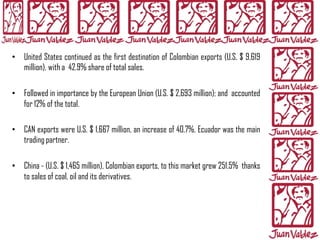
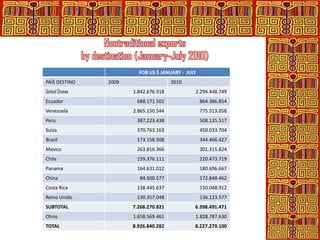
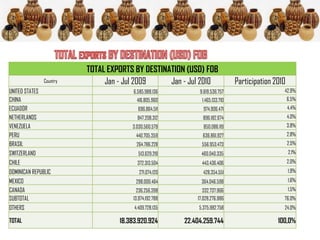
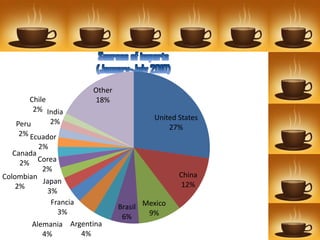
Brasil


              • Colombia's
                economy is the
  ARGENTINA     4th largest in
                Latin America by
                the IMF


MEXICO
National    Inflation   Population   Unemployment
 Currency       Rate      45,590,000       Rate
 PESOS         2.31 %      (2010)         12%
   US$1 =      August                  (June 2010
COP$1809,46   2010(BR)                   DANE)
for the
              year 2009


               Gross
              Domestic
              Product
that means     (GDP)          was
   about                  approximately
396 billion               793 billion
 dollars                    pesos
The distribution by
           economic activity was


 30,3%                             55.8%
Industry                       SERVICES


                  13.9%
                agriculture
,


    ,
•
EXPORTS
%

                      Others
                       14%
      Union Europea
          12%                                                 United States
                                                                  43%
CAN
 7%
      China
       7% Venezuela
             4% Brasil Suiza                     Canada
                                      Chile        1%
                    3% 2%              2%
                               Dominican      Mexico      Japan
                                Republic       2%          1%
                                  2%
• United States continued as the first destination of Colombian exports (U.S. $ 9,619
  million), with a 42.9% share of total sales.

• Followed in importance by the European Union (U.S. $ 2,693 million); and accounted
  for 12% of the total.

• CAN exports were U.S. $ 1,667 million, an increase of 40.7%. Ecuador was the main
  trading partner.

• China - (U.S. $ 1,465 million), Colombian exports, to this market grew 251.5% thanks
  to sales of coal, oil and its derivatives.
FOB US $ JANUARY - JULY
PAÍS DESTINO    2009                   2010
United States          1.842.676.918           2.294.448.749
Ecuador                 688.171.501                864.386.854
Venezuela              2.865.150.544               775.513.058
Peru                    387.223.438                508.135.517
Suiza                   370.763.163                450.033.704
Brasil                  173.158.508                344.466.427
Mexico                  263.816.366                301.315.824
Chile                   159.376.111                220.473.719
Panama                  164.631.012                180.696.667
China                    84.500.577                172.848.462
Costa Rica              138.445.637                150.048.912
Reino Unido             130.357.048                136.123.577
SUBTOTAL               7.268.270.821           6.398.491.471
Otros                  1.658.569.461           1.828.787.630
TOTAL                  8.926.840.282           8.227.279.100
FOB US $ JANUARY - JULY
DEPARTAMENTO DE      2009                   2010
ORIGEN
Antioquia                   2.157.865.606          2.462.642.741
Bogotá                      1.544.647.430          1.545.352.239
Valle del Cauca             1.079.401.193          1.172.040.705
Cundinamarca                 950.970.491            884.526.378
Bolivar                      595.572.579            687.706.011
Atlantico                    652.367.676            577.056.628
Caldas                       265.367.676            196.735.435
Magdalena                    203.969.951            175.008.840
Cauca                        111..729.900           119.542.562
Risaralda                    109.011.488             88.915.393
Santander                    360.555.793             87.664.796
Boyaca                        50.997.562             68.189.782
Norte de Santander           562.539.221             52.977.862
Sucre                         68.412.274             25.461.784
Cordoba                       76.867.666             25.038.783
Tolima                        18.875.514             11.383.953
Huila                          3.796.741             10.323.221
Quindio                       30.210.066                9.096.305
Cesar                         52.066.533                8.981.974
Choco                           8.372481                7.311.852
SUBTOTAL                    8.903.632.385          8.215.956.883
Otros                         23.207.897             11.322.217
TOTAL                       8.926.840.282          8.227.279.100
TOTAL EXPORTS BY DESTINATION (USD) FOB
               Country        Jan - Jul 2009     Jan - Jul 2010               Participation 2010
UNITED STATES                          6.585.988.136         9.619.536.757                     42,9%
CHINA                                   416.805.960           1.465.133.710                        6,5%
ECUADOR                                  696.864.511           974.906.471                         4,4%
NETHERLANDS                              847.208.312           896.182.674                         4,0%
VENEZUELA                             3.030.560.579            850.086.119                         3,8%
PERU                                    440.705.359           636.861.927                          2,8%
BRASIL                                  264.786.228           556.953.473                          2,5%
SWITZERLAND                              513.629.219          460.040.335                          2,1%
CHILE                                    372.313.504          443.436.406                          2,0%
DOMINICAN REPUBLIC                        271.074.120          428.354.551                         1,9%
MEXICO                                  298.000.464           364.046.598                          1,6%
CANADA                                   236.256.398           332.737.966                         1,5%
SUBTOTAL                               13.974.192.788       17.028.276.986                     76,0%
OTHERS                                 4.409.728.135         5.375.982.758                     24,0%

TOTAL                             18.383.920.924        22.404.259.744                       100,0%
COLOMBIAN EXPORTS JANUARY - JULY 2010 (USD) FOB

                       Jan - Jul 2009    Jan - Jul 2010    Participation   Variation
                                                               2010           %

No Tradicional                                                 36,7%         -7,8%
                         8.926.840.282     8.227.279.100

Tradicional                                                    63,3%         49,9%
                         9.457.080.642    14.176.980.643

TOTAL                                                         100,0%         21,9%
                        18.383.920.924    22.404.259.744
Other
       Chile           18%
        2% India
                                        United States
   Peru       2%
                                            27%
    2% Ecuador
         2%
   Canada
     2% Corea
           2%
Colombian                                      China
           Japan                                12%
    2%
            3%
             Francia
                               Brasil Mexico
               3%                      9%
                                6%
        Alemania Argentina
           4%        4%
• From China increased imports of computers, Telecommunication
  equipment, electrical machinery industrial machinery, textiles

• from Argentina increased cereal purchases, vegetables and
  fruits, oils and vegetable fats

• In Latin America, Colombian imports decreased Venezuela (-
  54.1%), Nicaragua (-45.4%) and Paraguay (-14.3%).
WEB-GRAFIA
• http://www.turiscolombia.com/colombia_economi
  a.html
• http://www.proexport.com.co/vbecontent/library/
  documents/DocNewsNo9976DocumentNo8856.pdf
• http://www.proexport.com.co/vbecontent/NewsD
  etail.asp?ID=9971&IDCompany=16

Colombia -Economy

  • 3.
    Brasil • Colombia's economy is the ARGENTINA 4th largest in Latin America by the IMF MEXICO
  • 4.
    National Inflation Population Unemployment Currency Rate 45,590,000 Rate PESOS 2.31 % (2010) 12% US$1 = August (June 2010 COP$1809,46 2010(BR) DANE)
  • 5.
    for the year 2009 Gross Domestic Product that means (GDP) was about approximately 396 billion 793 billion dollars pesos
  • 6.
    The distribution by economic activity was 30,3% 55.8% Industry SERVICES 13.9% agriculture
  • 7.
    , , •
  • 8.
  • 9.
    % Others 14% Union Europea 12% United States 43% CAN 7% China 7% Venezuela 4% Brasil Suiza Canada Chile 1% 3% 2% 2% Dominican Mexico Japan Republic 2% 1% 2%
  • 10.
    • United Statescontinued as the first destination of Colombian exports (U.S. $ 9,619 million), with a 42.9% share of total sales. • Followed in importance by the European Union (U.S. $ 2,693 million); and accounted for 12% of the total. • CAN exports were U.S. $ 1,667 million, an increase of 40.7%. Ecuador was the main trading partner. • China - (U.S. $ 1,465 million), Colombian exports, to this market grew 251.5% thanks to sales of coal, oil and its derivatives.
  • 11.
    FOB US $JANUARY - JULY PAÍS DESTINO 2009 2010 United States 1.842.676.918 2.294.448.749 Ecuador 688.171.501 864.386.854 Venezuela 2.865.150.544 775.513.058 Peru 387.223.438 508.135.517 Suiza 370.763.163 450.033.704 Brasil 173.158.508 344.466.427 Mexico 263.816.366 301.315.824 Chile 159.376.111 220.473.719 Panama 164.631.012 180.696.667 China 84.500.577 172.848.462 Costa Rica 138.445.637 150.048.912 Reino Unido 130.357.048 136.123.577 SUBTOTAL 7.268.270.821 6.398.491.471 Otros 1.658.569.461 1.828.787.630 TOTAL 8.926.840.282 8.227.279.100
  • 12.
    FOB US $JANUARY - JULY DEPARTAMENTO DE 2009 2010 ORIGEN Antioquia 2.157.865.606 2.462.642.741 Bogotá 1.544.647.430 1.545.352.239 Valle del Cauca 1.079.401.193 1.172.040.705 Cundinamarca 950.970.491 884.526.378 Bolivar 595.572.579 687.706.011 Atlantico 652.367.676 577.056.628 Caldas 265.367.676 196.735.435 Magdalena 203.969.951 175.008.840 Cauca 111..729.900 119.542.562 Risaralda 109.011.488 88.915.393 Santander 360.555.793 87.664.796 Boyaca 50.997.562 68.189.782 Norte de Santander 562.539.221 52.977.862 Sucre 68.412.274 25.461.784 Cordoba 76.867.666 25.038.783 Tolima 18.875.514 11.383.953 Huila 3.796.741 10.323.221 Quindio 30.210.066 9.096.305 Cesar 52.066.533 8.981.974 Choco 8.372481 7.311.852 SUBTOTAL 8.903.632.385 8.215.956.883 Otros 23.207.897 11.322.217 TOTAL 8.926.840.282 8.227.279.100
  • 13.
    TOTAL EXPORTS BYDESTINATION (USD) FOB Country Jan - Jul 2009 Jan - Jul 2010 Participation 2010 UNITED STATES 6.585.988.136 9.619.536.757 42,9% CHINA 416.805.960 1.465.133.710 6,5% ECUADOR 696.864.511 974.906.471 4,4% NETHERLANDS 847.208.312 896.182.674 4,0% VENEZUELA 3.030.560.579 850.086.119 3,8% PERU 440.705.359 636.861.927 2,8% BRASIL 264.786.228 556.953.473 2,5% SWITZERLAND 513.629.219 460.040.335 2,1% CHILE 372.313.504 443.436.406 2,0% DOMINICAN REPUBLIC 271.074.120 428.354.551 1,9% MEXICO 298.000.464 364.046.598 1,6% CANADA 236.256.398 332.737.966 1,5% SUBTOTAL 13.974.192.788 17.028.276.986 76,0% OTHERS 4.409.728.135 5.375.982.758 24,0% TOTAL 18.383.920.924 22.404.259.744 100,0%
  • 14.
    COLOMBIAN EXPORTS JANUARY- JULY 2010 (USD) FOB Jan - Jul 2009 Jan - Jul 2010 Participation Variation 2010 % No Tradicional 36,7% -7,8% 8.926.840.282 8.227.279.100 Tradicional 63,3% 49,9% 9.457.080.642 14.176.980.643 TOTAL 100,0% 21,9% 18.383.920.924 22.404.259.744
  • 16.
    Other Chile 18% 2% India United States Peru 2% 27% 2% Ecuador 2% Canada 2% Corea 2% Colombian China Japan 12% 2% 3% Francia Brasil Mexico 3% 9% 6% Alemania Argentina 4% 4%
  • 17.
    • From Chinaincreased imports of computers, Telecommunication equipment, electrical machinery industrial machinery, textiles • from Argentina increased cereal purchases, vegetables and fruits, oils and vegetable fats • In Latin America, Colombian imports decreased Venezuela (- 54.1%), Nicaragua (-45.4%) and Paraguay (-14.3%).
  • 18.
    WEB-GRAFIA • http://www.turiscolombia.com/colombia_economi a.html • http://www.proexport.com.co/vbecontent/library/ documents/DocNewsNo9976DocumentNo8856.pdf • http://www.proexport.com.co/vbecontent/NewsD etail.asp?ID=9971&IDCompany=16