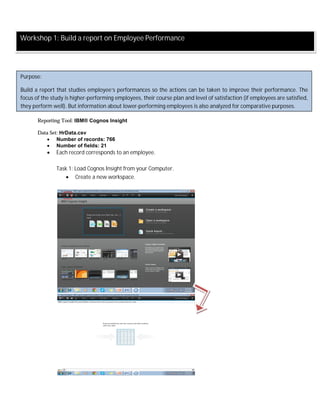
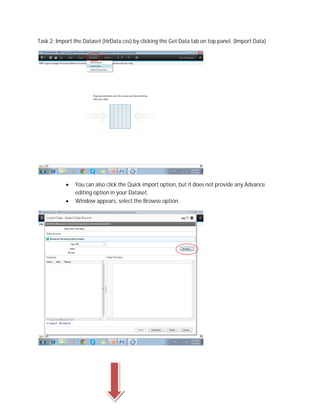
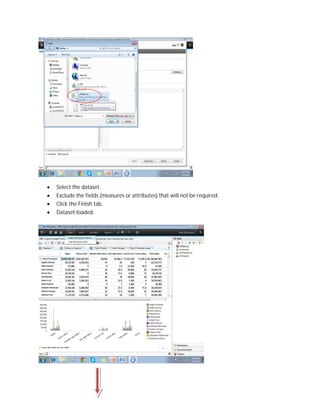
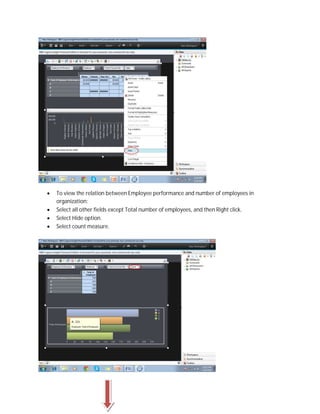
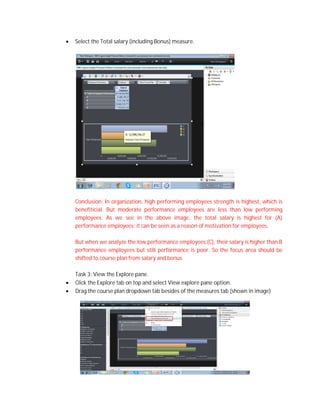
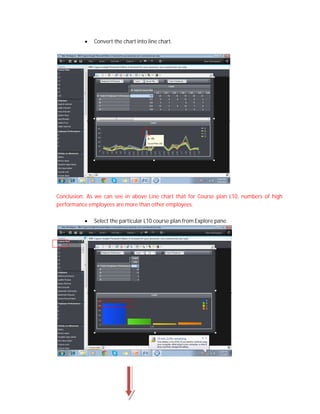
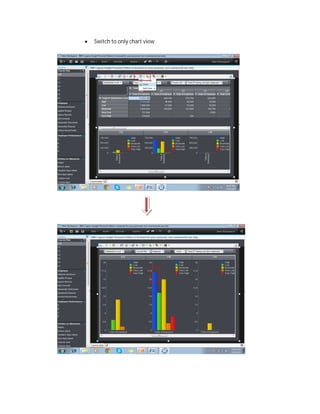
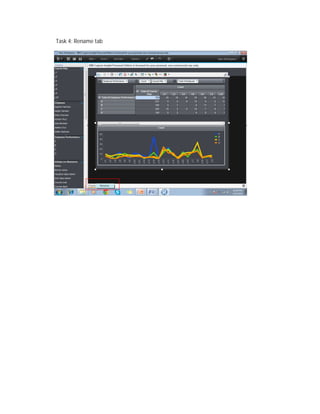
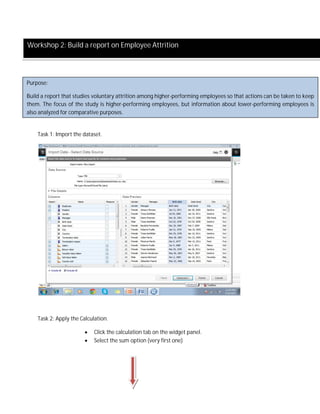
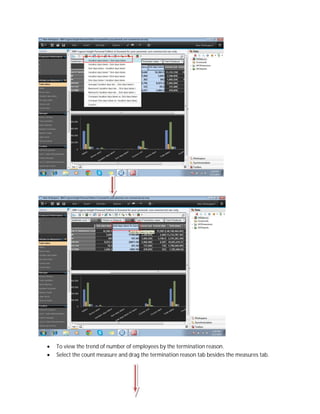
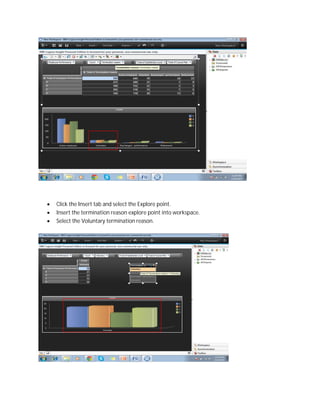
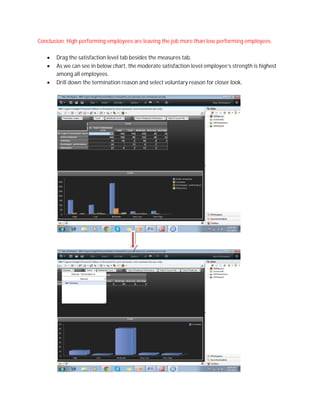
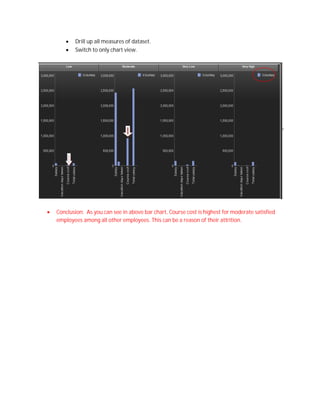
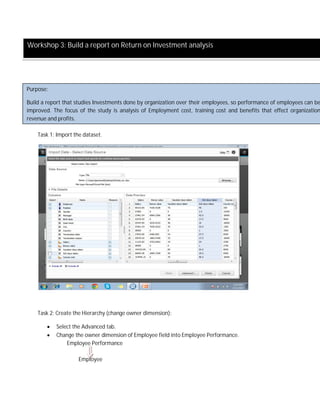
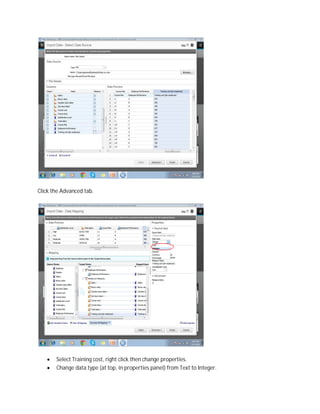
SlideShare a Scribd company logo
Reporting Tool: IBM® Cognos Insight
Data Set: HrData.csv
 Number of records: 766
 Number of fields: 21
 Each record corresponds to an employee.
Task 1: Load Cognos Insight from your Computer.
 Create a new workspace.
Workshop 1: Build a report on Employee Performance
Purpose:
Build a report that studies employee’s performances so the actions can be taken to improve their performance. The
focus of the study is higher-performing employees, their course plan and level of satisfaction (if employees are satisfied,
they perform well). But information about lower-performing employees is also analyzed for comparative purposes.
Task 2: Import the Dataset (HrData.csv) by clicking the Get Data tab on top panel. (Import Data)
 You can also click the Quick import option, but it does not provide any Advance
editing option in your Dataset.
 Window appears, select the Browse option.
 Select the dataset.
 Exclude the fields (measures or attributes) that will not be required.
 Click the Finish tab.
 Dataset loaded.
 To view the relation between Employee performance and number of employees in
organization:
 Select all other fields except Total number of employees, and then Right click.
 Select Hide option.
 Select count measure.
 Select the Total salary (including Bonus) measure.
Conclusion: In organization, high performing employees strength is highest, which is
benefiticial. But moderate performance employees are less than low performing
employees. As we see in the above image, the total salary is highest for (A)
performance employees; it can be seen as a reason of motivation for employees.
But when we analyze the low performance employees (C), their salary is higher than B
performance employees but still performance is poor. So the focus area should be
shifted to course plan from salary and bonus.
Task 3: View the Explore pane.
 Click the Explore tab on top and select View explore pane option.
 Drag the course plan dropdown tab besides of the measures tab (shown in image)
 Convert the chart into line chart.
Conclusion: As we can see in above Line chart that for Course plan L10, numbers of high
performance employees are more than other employees.
 Select the particular L10 course plan from Explore pane.
 Switch to only chart view.
Task 4: Rename tab
Task 1: Import the dataset.
Task 2: Apply the Calculation.
 Click the calculation tab on the widget panel.
 Select the sum option (very first one)
Workshop 2: Build a report on Employee Attrition
Purpose:
Build a report that studies voluntary attrition among higher-performing employees so that actions can be taken to keep
them. The focus of the study is higher-performing employees, but information about lower-performing employees is
also analyzed for comparative purposes.
 To view the trend of number of employees by the termination reason.
 Select the count measure and drag the termination reason tab besides the measures tab.
 Click the Insert tab and select the Explore point.
 Insert the termination reason explore point into workspace.
 Select the Voluntary termination reason.
Conclusion: High performing employees are leaving the job more than low performing employees.
 Drag the satisfaction level tab besides the measures tab.
 As we can see in below chart, the moderate satisfaction level employee’s strength is highest
among all employees.
 Drill down the termination reason and select voluntary reason for closer look.
 Drill up all measures of dataset.
 Switch to only chart view.
 Conclusion: As you can see in above bar chart, Course cost is highest for moderate satisfied
employees among all other employees. This can be a reason of their attrition.
Task 1: Import the dataset.
Task 2: Create the Hierarchy (change owner dimension):
 Select the Advanced tab.
 Change the owner dimension of Employee field into Employee Performance.
Employee Performance
Employee
Workshop 3: Build a report on Return on Investment analysis
Purpose:
Build a report that studies Investments done by organization over their employees, so performance of employees can be
improved. The focus of the study is analysis of Employment cost, training cost and benefits that effect organization
revenue and profits.
 Dataset loaded in new workspace.
Can drill up or drill down
the performances A, B, C
and D, it gives out the list
of employee names fall
into that category.
 Select Bonus value measure.
 Change visualization into Tree map.
Conclusion: As we can see in above tree map, Bonus value provided by organization to their
employees of lower performance is higher than average performance employees.
 Training cost is not available in the list of measures; we need to convert its data type.
 From Data Sliding panel (at right hand side), click the All imports.
 Select your dataset, right click and then choose edit import.
Click the Advanced tab.
 Select Training cost, right click then change properties.
 Change data type (at top, in properties panel) from Text to Integer.
 Now training cost will also be treated as Measure.
 Analyze the training investment against performance of employees; organization is doing over
their employees.
Conclusion: Training cost invested over the lower performance employees is higher than average
performance employees. So this is one of the focus areas where organization should work (such as
change course plan or course days etc).

More Related Content

Similar to Lab Report on Cognos Insight

1 Business Intelligence Case Project Backgro.docx
1  Business Intelligence Case    Project Backgro.docx1  Business Intelligence Case    Project Backgro.docx
1 Business Intelligence Case Project Backgro.docx
oswald1horne84988
 
Review the SHRM case Designing a Pay Structure” You will p.docx
Review the SHRM case Designing a Pay Structure” You will p.docxReview the SHRM case Designing a Pay Structure” You will p.docx
Review the SHRM case Designing a Pay Structure” You will p.docx
fathwaitewalter
 
Calculated Columns and Measures in Power BI.pptx
Calculated Columns and Measures in Power BI.pptxCalculated Columns and Measures in Power BI.pptx
Calculated Columns and Measures in Power BI.pptx
Select Distinct Limited
 
Sheet1HCM3002 Economics of HealthcareChoose a Health Plan (Part 2).docx
Sheet1HCM3002 Economics of HealthcareChoose a Health Plan (Part 2).docxSheet1HCM3002 Economics of HealthcareChoose a Health Plan (Part 2).docx
Sheet1HCM3002 Economics of HealthcareChoose a Health Plan (Part 2).docx
maoanderton
 
Project Web Access Quick Reference Guide For Team Members
Project Web Access Quick Reference Guide For Team MembersProject Web Access Quick Reference Guide For Team Members
Project Web Access Quick Reference Guide For Team Members
Toney Sisk
 
vdocuments.mx_oracle-hrms-payroll-setup-ppt.ppt
vdocuments.mx_oracle-hrms-payroll-setup-ppt.pptvdocuments.mx_oracle-hrms-payroll-setup-ppt.ppt
vdocuments.mx_oracle-hrms-payroll-setup-ppt.ppt
HusseinWassof
 
HR analysis
HR analysisHR analysis
HR analysis
Shaily Dubey
 
Jan 2010 Tutorial 3 Teamwork Work Plan Performance Evaluation And...
Jan 2010    Tutorial 3    Teamwork    Work  Plan  Performance  Evaluation And...Jan 2010    Tutorial 3    Teamwork    Work  Plan  Performance  Evaluation And...
Jan 2010 Tutorial 3 Teamwork Work Plan Performance Evaluation And...
Clearvale Connect
 
Jan 2010 Tutorial 3 Teamwork Work Plan Performance Evaluation And Bonus...
Jan 2010   Tutorial 3   Teamwork   Work Plan Performance Evaluation And Bonus...Jan 2010   Tutorial 3   Teamwork   Work Plan Performance Evaluation And Bonus...
Jan 2010 Tutorial 3 Teamwork Work Plan Performance Evaluation And Bonus...
Clearvale Connect
 
Eloqua Admint Guide
Eloqua Admint GuideEloqua Admint Guide
Eloqua Admint Guide
Jitender Singh
 
How to create S-Curve by MS Project 2013
How to create S-Curve by MS Project 2013How to create S-Curve by MS Project 2013
How to create S-Curve by MS Project 2013
Ong-Art Sanpinit
 
How to Create S Curve by MS Project 2013
How to Create S Curve by MS Project 2013How to Create S Curve by MS Project 2013
How to Create S Curve by MS Project 2013
Ong-Art Sanpinit
 
Bell curve appraisal
Bell curve appraisalBell curve appraisal
Bell curve appraisal
dhiraj2hrd
 
MS Project - Lesson #2 - Managing Project ResourcesObjectives - .docx
MS Project - Lesson #2 - Managing Project ResourcesObjectives - .docxMS Project - Lesson #2 - Managing Project ResourcesObjectives - .docx
MS Project - Lesson #2 - Managing Project ResourcesObjectives - .docx
rosemarybdodson23141
 
Project Management Quick Reference Guide
Project Management Quick Reference GuideProject Management Quick Reference Guide
Project Management Quick Reference Guide
Ahmad Hammoud,CPM,IBA,MSE,NLP
 
Project Management Quick Reference Guide For Microsoft Project 2007
Project Management Quick Reference Guide For Microsoft Project 2007Project Management Quick Reference Guide For Microsoft Project 2007
Project Management Quick Reference Guide For Microsoft Project 2007
Toney Sisk
 
DM_01 28_16_How-To-Use-Digital-Measures_v01
DM_01 28_16_How-To-Use-Digital-Measures_v01DM_01 28_16_How-To-Use-Digital-Measures_v01
DM_01 28_16_How-To-Use-Digital-Measures_v01
ATPaceU
 
ACTG Tableau intro labDownload the TableauLab file and look ov.docx
ACTG   Tableau intro labDownload the TableauLab file and look ov.docxACTG   Tableau intro labDownload the TableauLab file and look ov.docx
ACTG Tableau intro labDownload the TableauLab file and look ov.docx
nettletondevon
 
Calculations for your Equity Analysis assignmentTo start, put .docx
Calculations for your Equity Analysis assignmentTo start, put .docxCalculations for your Equity Analysis assignmentTo start, put .docx
Calculations for your Equity Analysis assignmentTo start, put .docx
RAHUL126667
 
Final Presenation
Final Presenation Final Presenation
Final Presenation
Patrick Montgomery
 

Similar to Lab Report on Cognos Insight (20)

1 Business Intelligence Case Project Backgro.docx
1  Business Intelligence Case    Project Backgro.docx1  Business Intelligence Case    Project Backgro.docx
1 Business Intelligence Case Project Backgro.docx
 
Review the SHRM case Designing a Pay Structure” You will p.docx
Review the SHRM case Designing a Pay Structure” You will p.docxReview the SHRM case Designing a Pay Structure” You will p.docx
Review the SHRM case Designing a Pay Structure” You will p.docx
 
Calculated Columns and Measures in Power BI.pptx
Calculated Columns and Measures in Power BI.pptxCalculated Columns and Measures in Power BI.pptx
Calculated Columns and Measures in Power BI.pptx
 
Sheet1HCM3002 Economics of HealthcareChoose a Health Plan (Part 2).docx
Sheet1HCM3002 Economics of HealthcareChoose a Health Plan (Part 2).docxSheet1HCM3002 Economics of HealthcareChoose a Health Plan (Part 2).docx
Sheet1HCM3002 Economics of HealthcareChoose a Health Plan (Part 2).docx
 
Project Web Access Quick Reference Guide For Team Members
Project Web Access Quick Reference Guide For Team MembersProject Web Access Quick Reference Guide For Team Members
Project Web Access Quick Reference Guide For Team Members
 
vdocuments.mx_oracle-hrms-payroll-setup-ppt.ppt
vdocuments.mx_oracle-hrms-payroll-setup-ppt.pptvdocuments.mx_oracle-hrms-payroll-setup-ppt.ppt
vdocuments.mx_oracle-hrms-payroll-setup-ppt.ppt
 
HR analysis
HR analysisHR analysis
HR analysis
 
Jan 2010 Tutorial 3 Teamwork Work Plan Performance Evaluation And...
Jan 2010    Tutorial 3    Teamwork    Work  Plan  Performance  Evaluation And...Jan 2010    Tutorial 3    Teamwork    Work  Plan  Performance  Evaluation And...
Jan 2010 Tutorial 3 Teamwork Work Plan Performance Evaluation And...
 
Jan 2010 Tutorial 3 Teamwork Work Plan Performance Evaluation And Bonus...
Jan 2010   Tutorial 3   Teamwork   Work Plan Performance Evaluation And Bonus...Jan 2010   Tutorial 3   Teamwork   Work Plan Performance Evaluation And Bonus...
Jan 2010 Tutorial 3 Teamwork Work Plan Performance Evaluation And Bonus...
 
Eloqua Admint Guide
Eloqua Admint GuideEloqua Admint Guide
Eloqua Admint Guide
 
How to create S-Curve by MS Project 2013
How to create S-Curve by MS Project 2013How to create S-Curve by MS Project 2013
How to create S-Curve by MS Project 2013
 
How to Create S Curve by MS Project 2013
How to Create S Curve by MS Project 2013How to Create S Curve by MS Project 2013
How to Create S Curve by MS Project 2013
 
Bell curve appraisal
Bell curve appraisalBell curve appraisal
Bell curve appraisal
 
MS Project - Lesson #2 - Managing Project ResourcesObjectives - .docx
MS Project - Lesson #2 - Managing Project ResourcesObjectives - .docxMS Project - Lesson #2 - Managing Project ResourcesObjectives - .docx
MS Project - Lesson #2 - Managing Project ResourcesObjectives - .docx
 
Project Management Quick Reference Guide
Project Management Quick Reference GuideProject Management Quick Reference Guide
Project Management Quick Reference Guide
 
Project Management Quick Reference Guide For Microsoft Project 2007
Project Management Quick Reference Guide For Microsoft Project 2007Project Management Quick Reference Guide For Microsoft Project 2007
Project Management Quick Reference Guide For Microsoft Project 2007
 
DM_01 28_16_How-To-Use-Digital-Measures_v01
DM_01 28_16_How-To-Use-Digital-Measures_v01DM_01 28_16_How-To-Use-Digital-Measures_v01
DM_01 28_16_How-To-Use-Digital-Measures_v01
 
ACTG Tableau intro labDownload the TableauLab file and look ov.docx
ACTG   Tableau intro labDownload the TableauLab file and look ov.docxACTG   Tableau intro labDownload the TableauLab file and look ov.docx
ACTG Tableau intro labDownload the TableauLab file and look ov.docx
 
Calculations for your Equity Analysis assignmentTo start, put .docx
Calculations for your Equity Analysis assignmentTo start, put .docxCalculations for your Equity Analysis assignmentTo start, put .docx
Calculations for your Equity Analysis assignmentTo start, put .docx
 
Final Presenation
Final Presenation Final Presenation
Final Presenation
 

More from Shaily Dubey

Netsuite e commerce training doc
Netsuite e commerce training docNetsuite e commerce training doc
Netsuite e commerce training doc
Shaily Dubey
 
Site builder
Site builderSite builder
Site builder
Shaily Dubey
 
Text Adventure
Text AdventureText Adventure
Text Adventure
Shaily Dubey
 
Simple Calculator with PhP
Simple Calculator with PhPSimple Calculator with PhP
Simple Calculator with PhP
Shaily Dubey
 
Tic tac toe with IBM DevOps
Tic tac toe with IBM DevOpsTic tac toe with IBM DevOps
Tic tac toe with IBM DevOps
Shaily Dubey
 
Environment analysis
Environment analysisEnvironment analysis
Environment analysis
Shaily Dubey
 
Visa srs
Visa srsVisa srs
Visa srs
Shaily Dubey
 
System design document visa
System design document visaSystem design document visa
System design document visa
Shaily Dubey
 
Visa processing system
Visa processing systemVisa processing system
Visa processing system
Shaily Dubey
 
Catering buisness PPT
Catering buisness PPTCatering buisness PPT
Catering buisness PPT
Shaily Dubey
 
Watson Analytic
Watson AnalyticWatson Analytic
Watson Analytic
Shaily Dubey
 

More from Shaily Dubey (11)

Netsuite e commerce training doc
Netsuite e commerce training docNetsuite e commerce training doc
Netsuite e commerce training doc
 
Site builder
Site builderSite builder
Site builder
 
Text Adventure
Text AdventureText Adventure
Text Adventure
 
Simple Calculator with PhP
Simple Calculator with PhPSimple Calculator with PhP
Simple Calculator with PhP
 
Tic tac toe with IBM DevOps
Tic tac toe with IBM DevOpsTic tac toe with IBM DevOps
Tic tac toe with IBM DevOps
 
Environment analysis
Environment analysisEnvironment analysis
Environment analysis
 
Visa srs
Visa srsVisa srs
Visa srs
 
System design document visa
System design document visaSystem design document visa
System design document visa
 
Visa processing system
Visa processing systemVisa processing system
Visa processing system
 
Catering buisness PPT
Catering buisness PPTCatering buisness PPT
Catering buisness PPT
 
Watson Analytic
Watson AnalyticWatson Analytic
Watson Analytic
 

Recently uploaded

A presentation that explain the Power BI Licensing
A presentation that explain the Power BI LicensingA presentation that explain the Power BI Licensing
A presentation that explain the Power BI Licensing
AlessioFois2
 
State of Artificial intelligence Report 2023
State of Artificial intelligence Report 2023State of Artificial intelligence Report 2023
State of Artificial intelligence Report 2023
kuntobimo2016
 
06-04-2024 - NYC Tech Week - Discussion on Vector Databases, Unstructured Dat...
06-04-2024 - NYC Tech Week - Discussion on Vector Databases, Unstructured Dat...06-04-2024 - NYC Tech Week - Discussion on Vector Databases, Unstructured Dat...
06-04-2024 - NYC Tech Week - Discussion on Vector Databases, Unstructured Dat...
Timothy Spann
 
在线办理(英国UCA毕业证书)创意艺术大学毕业证在读证明一模一样
在线办理(英国UCA毕业证书)创意艺术大学毕业证在读证明一模一样在线办理(英国UCA毕业证书)创意艺术大学毕业证在读证明一模一样
在线办理(英国UCA毕业证书)创意艺术大学毕业证在读证明一模一样
v7oacc3l
 
06-12-2024-BudapestDataForum-BuildingReal-timePipelineswithFLaNK AIM
06-12-2024-BudapestDataForum-BuildingReal-timePipelineswithFLaNK AIM06-12-2024-BudapestDataForum-BuildingReal-timePipelineswithFLaNK AIM
06-12-2024-BudapestDataForum-BuildingReal-timePipelineswithFLaNK AIM
Timothy Spann
 
4th Modern Marketing Reckoner by MMA Global India & Group M: 60+ experts on W...
4th Modern Marketing Reckoner by MMA Global India & Group M: 60+ experts on W...4th Modern Marketing Reckoner by MMA Global India & Group M: 60+ experts on W...
4th Modern Marketing Reckoner by MMA Global India & Group M: 60+ experts on W...
Social Samosa
 
Challenges of Nation Building-1.pptx with more important
Challenges of Nation Building-1.pptx with more importantChallenges of Nation Building-1.pptx with more important
Challenges of Nation Building-1.pptx with more important
Sm321
 
Udemy_2024_Global_Learning_Skills_Trends_Report (1).pdf
Udemy_2024_Global_Learning_Skills_Trends_Report (1).pdfUdemy_2024_Global_Learning_Skills_Trends_Report (1).pdf
Udemy_2024_Global_Learning_Skills_Trends_Report (1).pdf
Fernanda Palhano
 
一比一原版(爱大毕业证书)爱丁堡大学毕业证如何办理
一比一原版(爱大毕业证书)爱丁堡大学毕业证如何办理一比一原版(爱大毕业证书)爱丁堡大学毕业证如何办理
一比一原版(爱大毕业证书)爱丁堡大学毕业证如何办理
g4dpvqap0
 
Intelligence supported media monitoring in veterinary medicine
Intelligence supported media monitoring in veterinary medicineIntelligence supported media monitoring in veterinary medicine
Intelligence supported media monitoring in veterinary medicine
AndrzejJarynowski
 
The Ipsos - AI - Monitor 2024 Report.pdf
The  Ipsos - AI - Monitor 2024 Report.pdfThe  Ipsos - AI - Monitor 2024 Report.pdf
The Ipsos - AI - Monitor 2024 Report.pdf
Social Samosa
 
一比一原版(Chester毕业证书)切斯特大学毕业证如何办理
一比一原版(Chester毕业证书)切斯特大学毕业证如何办理一比一原版(Chester毕业证书)切斯特大学毕业证如何办理
一比一原版(Chester毕业证书)切斯特大学毕业证如何办理
74nqk8xf
 
一比一原版(UCSF文凭证书)旧金山分校毕业证如何办理
一比一原版(UCSF文凭证书)旧金山分校毕业证如何办理一比一原版(UCSF文凭证书)旧金山分校毕业证如何办理
一比一原版(UCSF文凭证书)旧金山分校毕业证如何办理
nuttdpt
 
The Building Blocks of QuestDB, a Time Series Database
The Building Blocks of QuestDB, a Time Series DatabaseThe Building Blocks of QuestDB, a Time Series Database
The Building Blocks of QuestDB, a Time Series Database
javier ramirez
 
Influence of Marketing Strategy and Market Competition on Business Plan
Influence of Marketing Strategy and Market Competition on Business PlanInfluence of Marketing Strategy and Market Competition on Business Plan
Influence of Marketing Strategy and Market Competition on Business Plan
jerlynmaetalle
 
Learn SQL from basic queries to Advance queries
Learn SQL from basic queries to Advance queriesLearn SQL from basic queries to Advance queries
Learn SQL from basic queries to Advance queries
manishkhaire30
 
Experts live - Improving user adoption with AI
Experts live - Improving user adoption with AIExperts live - Improving user adoption with AI
Experts live - Improving user adoption with AI
jitskeb
 
Beyond the Basics of A/B Tests: Highly Innovative Experimentation Tactics You...
Beyond the Basics of A/B Tests: Highly Innovative Experimentation Tactics You...Beyond the Basics of A/B Tests: Highly Innovative Experimentation Tactics You...
Beyond the Basics of A/B Tests: Highly Innovative Experimentation Tactics You...
Aggregage
 
一比一原版(Glasgow毕业证书)格拉斯哥大学毕业证如何办理
一比一原版(Glasgow毕业证书)格拉斯哥大学毕业证如何办理一比一原版(Glasgow毕业证书)格拉斯哥大学毕业证如何办理
一比一原版(Glasgow毕业证书)格拉斯哥大学毕业证如何办理
g4dpvqap0
 
Everything you wanted to know about LIHTC
Everything you wanted to know about LIHTCEverything you wanted to know about LIHTC
Everything you wanted to know about LIHTC
Roger Valdez
 

Recently uploaded (20)

A presentation that explain the Power BI Licensing
A presentation that explain the Power BI LicensingA presentation that explain the Power BI Licensing
A presentation that explain the Power BI Licensing
 
State of Artificial intelligence Report 2023
State of Artificial intelligence Report 2023State of Artificial intelligence Report 2023
State of Artificial intelligence Report 2023
 
06-04-2024 - NYC Tech Week - Discussion on Vector Databases, Unstructured Dat...
06-04-2024 - NYC Tech Week - Discussion on Vector Databases, Unstructured Dat...06-04-2024 - NYC Tech Week - Discussion on Vector Databases, Unstructured Dat...
06-04-2024 - NYC Tech Week - Discussion on Vector Databases, Unstructured Dat...
 
在线办理(英国UCA毕业证书)创意艺术大学毕业证在读证明一模一样
在线办理(英国UCA毕业证书)创意艺术大学毕业证在读证明一模一样在线办理(英国UCA毕业证书)创意艺术大学毕业证在读证明一模一样
在线办理(英国UCA毕业证书)创意艺术大学毕业证在读证明一模一样
 
06-12-2024-BudapestDataForum-BuildingReal-timePipelineswithFLaNK AIM
06-12-2024-BudapestDataForum-BuildingReal-timePipelineswithFLaNK AIM06-12-2024-BudapestDataForum-BuildingReal-timePipelineswithFLaNK AIM
06-12-2024-BudapestDataForum-BuildingReal-timePipelineswithFLaNK AIM
 
4th Modern Marketing Reckoner by MMA Global India & Group M: 60+ experts on W...
4th Modern Marketing Reckoner by MMA Global India & Group M: 60+ experts on W...4th Modern Marketing Reckoner by MMA Global India & Group M: 60+ experts on W...
4th Modern Marketing Reckoner by MMA Global India & Group M: 60+ experts on W...
 
Challenges of Nation Building-1.pptx with more important
Challenges of Nation Building-1.pptx with more importantChallenges of Nation Building-1.pptx with more important
Challenges of Nation Building-1.pptx with more important
 
Udemy_2024_Global_Learning_Skills_Trends_Report (1).pdf
Udemy_2024_Global_Learning_Skills_Trends_Report (1).pdfUdemy_2024_Global_Learning_Skills_Trends_Report (1).pdf
Udemy_2024_Global_Learning_Skills_Trends_Report (1).pdf
 
一比一原版(爱大毕业证书)爱丁堡大学毕业证如何办理
一比一原版(爱大毕业证书)爱丁堡大学毕业证如何办理一比一原版(爱大毕业证书)爱丁堡大学毕业证如何办理
一比一原版(爱大毕业证书)爱丁堡大学毕业证如何办理
 
Intelligence supported media monitoring in veterinary medicine
Intelligence supported media monitoring in veterinary medicineIntelligence supported media monitoring in veterinary medicine
Intelligence supported media monitoring in veterinary medicine
 
The Ipsos - AI - Monitor 2024 Report.pdf
The  Ipsos - AI - Monitor 2024 Report.pdfThe  Ipsos - AI - Monitor 2024 Report.pdf
The Ipsos - AI - Monitor 2024 Report.pdf
 
一比一原版(Chester毕业证书)切斯特大学毕业证如何办理
一比一原版(Chester毕业证书)切斯特大学毕业证如何办理一比一原版(Chester毕业证书)切斯特大学毕业证如何办理
一比一原版(Chester毕业证书)切斯特大学毕业证如何办理
 
一比一原版(UCSF文凭证书)旧金山分校毕业证如何办理
一比一原版(UCSF文凭证书)旧金山分校毕业证如何办理一比一原版(UCSF文凭证书)旧金山分校毕业证如何办理
一比一原版(UCSF文凭证书)旧金山分校毕业证如何办理
 
The Building Blocks of QuestDB, a Time Series Database
The Building Blocks of QuestDB, a Time Series DatabaseThe Building Blocks of QuestDB, a Time Series Database
The Building Blocks of QuestDB, a Time Series Database
 
Influence of Marketing Strategy and Market Competition on Business Plan
Influence of Marketing Strategy and Market Competition on Business PlanInfluence of Marketing Strategy and Market Competition on Business Plan
Influence of Marketing Strategy and Market Competition on Business Plan
 
Learn SQL from basic queries to Advance queries
Learn SQL from basic queries to Advance queriesLearn SQL from basic queries to Advance queries
Learn SQL from basic queries to Advance queries
 
Experts live - Improving user adoption with AI
Experts live - Improving user adoption with AIExperts live - Improving user adoption with AI
Experts live - Improving user adoption with AI
 
Beyond the Basics of A/B Tests: Highly Innovative Experimentation Tactics You...
Beyond the Basics of A/B Tests: Highly Innovative Experimentation Tactics You...Beyond the Basics of A/B Tests: Highly Innovative Experimentation Tactics You...
Beyond the Basics of A/B Tests: Highly Innovative Experimentation Tactics You...
 
一比一原版(Glasgow毕业证书)格拉斯哥大学毕业证如何办理
一比一原版(Glasgow毕业证书)格拉斯哥大学毕业证如何办理一比一原版(Glasgow毕业证书)格拉斯哥大学毕业证如何办理
一比一原版(Glasgow毕业证书)格拉斯哥大学毕业证如何办理
 
Everything you wanted to know about LIHTC
Everything you wanted to know about LIHTCEverything you wanted to know about LIHTC
Everything you wanted to know about LIHTC
 

Lab Report on Cognos Insight

  • 1. Reporting Tool: IBM® Cognos Insight Data Set: HrData.csv  Number of records: 766  Number of fields: 21  Each record corresponds to an employee. Task 1: Load Cognos Insight from your Computer.  Create a new workspace. Workshop 1: Build a report on Employee Performance Purpose: Build a report that studies employee’s performances so the actions can be taken to improve their performance. The focus of the study is higher-performing employees, their course plan and level of satisfaction (if employees are satisfied, they perform well). But information about lower-performing employees is also analyzed for comparative purposes.
  • 2. Task 2: Import the Dataset (HrData.csv) by clicking the Get Data tab on top panel. (Import Data)  You can also click the Quick import option, but it does not provide any Advance editing option in your Dataset.  Window appears, select the Browse option.
  • 3.  Select the dataset.  Exclude the fields (measures or attributes) that will not be required.  Click the Finish tab.  Dataset loaded.
  • 4.  To view the relation between Employee performance and number of employees in organization:  Select all other fields except Total number of employees, and then Right click.  Select Hide option.  Select count measure.
  • 5.  Select the Total salary (including Bonus) measure. Conclusion: In organization, high performing employees strength is highest, which is benefiticial. But moderate performance employees are less than low performing employees. As we see in the above image, the total salary is highest for (A) performance employees; it can be seen as a reason of motivation for employees. But when we analyze the low performance employees (C), their salary is higher than B performance employees but still performance is poor. So the focus area should be shifted to course plan from salary and bonus. Task 3: View the Explore pane.  Click the Explore tab on top and select View explore pane option.  Drag the course plan dropdown tab besides of the measures tab (shown in image)
  • 6.  Convert the chart into line chart. Conclusion: As we can see in above Line chart that for Course plan L10, numbers of high performance employees are more than other employees.  Select the particular L10 course plan from Explore pane.
  • 7.  Switch to only chart view.
  • 9. Task 1: Import the dataset. Task 2: Apply the Calculation.  Click the calculation tab on the widget panel.  Select the sum option (very first one) Workshop 2: Build a report on Employee Attrition Purpose: Build a report that studies voluntary attrition among higher-performing employees so that actions can be taken to keep them. The focus of the study is higher-performing employees, but information about lower-performing employees is also analyzed for comparative purposes.
  • 10.  To view the trend of number of employees by the termination reason.  Select the count measure and drag the termination reason tab besides the measures tab.
  • 11.  Click the Insert tab and select the Explore point.  Insert the termination reason explore point into workspace.  Select the Voluntary termination reason.
  • 12. Conclusion: High performing employees are leaving the job more than low performing employees.  Drag the satisfaction level tab besides the measures tab.  As we can see in below chart, the moderate satisfaction level employee’s strength is highest among all employees.  Drill down the termination reason and select voluntary reason for closer look.
  • 13.  Drill up all measures of dataset.  Switch to only chart view.  Conclusion: As you can see in above bar chart, Course cost is highest for moderate satisfied employees among all other employees. This can be a reason of their attrition.
  • 14. Task 1: Import the dataset. Task 2: Create the Hierarchy (change owner dimension):  Select the Advanced tab.  Change the owner dimension of Employee field into Employee Performance. Employee Performance Employee Workshop 3: Build a report on Return on Investment analysis Purpose: Build a report that studies Investments done by organization over their employees, so performance of employees can be improved. The focus of the study is analysis of Employment cost, training cost and benefits that effect organization revenue and profits.
  • 15.  Dataset loaded in new workspace. Can drill up or drill down the performances A, B, C and D, it gives out the list of employee names fall into that category.
  • 16.  Select Bonus value measure.  Change visualization into Tree map. Conclusion: As we can see in above tree map, Bonus value provided by organization to their employees of lower performance is higher than average performance employees.  Training cost is not available in the list of measures; we need to convert its data type.  From Data Sliding panel (at right hand side), click the All imports.  Select your dataset, right click and then choose edit import.
  • 17. Click the Advanced tab.  Select Training cost, right click then change properties.  Change data type (at top, in properties panel) from Text to Integer.
  • 18.  Now training cost will also be treated as Measure.  Analyze the training investment against performance of employees; organization is doing over their employees. Conclusion: Training cost invested over the lower performance employees is higher than average performance employees. So this is one of the focus areas where organization should work (such as change course plan or course days etc).