SlideShare a Scribd company logo
1 of 24
Practical Project - Carolyn Sonter
Assessment of lead and zinc levels of sediments in
Cockle Creek - New South Wales, Australia
Introduction
Cockle Creek in New South Wales (NSW), Australia, flows into Lake Macquarie (Fig 1) and
is of significance in the investigation of lead and zinc levels in sediments due to its close
proximity to a now discontinued lead and zinc smelter. Constructed in 1897 the Pasminco
Cockle Creek Smelter (PCCS) was a major lead processing plant until its closure in late
2003. During the smelter’s operation, stack and fugitive emissions and dust from ore and
slag covered an area extending to Glendale in the north, Macquarie Hills in the east,
Speers Point in the south with the adjoining suburbs of Boolaroo and Argenton to the west
receiving the greatest contamination (NSW Health Department 1991). Cockle Creek flows
through the suburbs of Argenton and Boolaroo before entering Lake Macquarie (Fig 1).
Creeks act as contamination ‘sinks’ due to the fine silt and clay component which is washed
into creeks during rain events from run off thus making the creek sediments an accurate
indicator of the persistence of contaminants in an area (Encyclopedia of Water Science
2005).
Fig 1. Map of Pasminco Cockle Creek Smelter and Cockle Creek (NSW), showing the
geographical relationship to the surrounding suburbs and Lake Macquarie (Willmore
et al. 2006).
Cockle Creek
Lead (Pb) is a metal, bluish grey in colour and found in the earth’s crust in small amounts
usually in ore which also contains zinc, silver and copper (Geoscience Australia 2014).
Lead may take several forms depending on the pH, salinity and humic content of the
medium (Agency for Toxic Substances and Disease Registry 2014). Exposure to Pb can
occur from the inhalation or ingestion of lead dust, particles or exhaust emissions from lead
being burnt (Australian Government Department of the Environment 2014). Lead is found in
air, water and soil in a range of compounds with the bioavailability and persistence largely
determined by the compound formed, with organic lead the most toxic (Alloway and Ayres
1997). The health effects of exposure to Pb can be both acute and chronic (Australian
Government Department of the Environment 2014). In children, exposure to Pb can result
in reduced intelligence, slowed growth and hearing problems while in adults, increased
blood pressure, brain and kidney damage and damage to the reproductive organs is
common (Agency for Toxic Substances and Disease Registry 2014).
Zinc (Zn) is a relatively abundant bluish-white, lustrous, diamagnetic metal, often found in
association with other base metals such as lead, silver and copper (Geoscience Australia
2014). Zinc may take several forms depending on the pH of the medium and temperature
with acidic conditions increasing availability. Due to an electrochemical reaction known as
galvanic action, Zn is commonly used as an anti-corrosion coating in the construction,
transport and appliance manufacturing industries (Geoscience Australia 2014). Zinc is also
used to create alloys such as bronze, pigments, salts, oxide additives to rubber and in
fertilizers (Geoscience Australia 2014). While Zn is a mineral essential for human, animal
and plant health, the absorption of excessive Zn in humans results in Iron (Fe) and Copper
(Cu) deficiencies which cease with a reduction in exposure (Harmaza & Slobozhanina
2014; Department of Human Services 1997). Excess Zn in soil water results in plants
exhibiting Phosphorous (P) and Fe deficiencies and eventual death if exposure is not
reduced (Reichman 2002).
A 1973 survey of ceiling dust, room dust and soil in Boolaroo and Argenton revealed that
Pb levels ranged from 2759-30,764 parts per million (ppm), 23-35,870 ppm and 8-26,794
ppm respectively (NSW Health Department 1991). As Zn was not a focus of the 1973
survey, no information is provided by the 1973 survey. The Australian guidelines for the
assessment of contaminated sites recommend further investigation if soil levels are above
300 ppm (former Standing Council on Environment and Water 2014). Information regarding
if the sediments of Cockle Creek were tested at this time is not available. Since 1973
regular testing has occurred in the suburbs surrounding the PCCS largely related to a Lead
Abatement Strategy (LAS) which was developed in conjunction with Department of
Environment, Climate Change and Water New South Wales and Lake Macquarie City
Council Health in response to the high levels found in humans and soil (Pasminco 2014).
The LAS concluded in February 2013. Kim, Owens and Naidu (2009) conducted an
independent heavy metal distribution, bioaccessibility and phytoavailability study of the
suburbs considered contaminated and others further afield. Lead levels of between 79
mg/Kg and 58,000 mg/Kg were found in the suburbs previously tested in 1973 and levels
between 8 mg/Kg and 235 mg/Kg were found in those areas outside of the 1973 test area
(Kim et al. 2009). Zinc levels of between 310 mg/Kg and 90,000 mg/Kg were found in the
suburbs tested for Pb in 1973 and levels of between 5 mg/Kg and 660 mg/Kg were found
outside of the 1973 Pb test area (Kim et al. 2009).
The NSW Department of Public Works and Services conducted a study in 2002 which
involved the testing of Pb and Zn levels from sediment cores taken from 21 sites
surrounding PCCS, including Cockle Creek, Cockle Bay and Lake Macquarie. That study
provided Pb levels of 326 to 1360 mg/kg and Zn levels of 1003 to 2700 mg/kg (NSW
Department of Public Works and Services 2002) which are in excess of the Australian
guidelines (former Standing Council on Environment and Water 2014). Chariton, Maher
and Roach (2011) tested sediment pore water from Cockle Bay in Lake Macquarie. Their
results indicated Pb of 260 mg/kg and Zn of 550 mg/Kg, however, these levels do not
indicate the Pb and Zn level of the sediment particles but rather the Pb and Zn available for
extraction by water from the sediment (Chariton et al. 2011).
The proposed study will test the Pb and Zn levels in sediment cores from five sites in
Cockle Creek. Testing will be performed upstream from PCCS and the remainder at evenly
distributed points between PCCS and Cockle Bay. It is expected that the Pb and Zn results
will be consistent with results of the studies performed by the NSW Department of Public
Works and Services (2002), Kim, Owens and Naidu in 2009 and Chariton, Maher and
Roach in 2011.
Methods
Sampling site and procedure
Samples were collected from five sites, upstream from (Site 1 (control site)), level with (Site
2) and downstream from (Sites 3, 4 and 5) the smelter site (Figure 2). Sampling was
performed by the author and an assistant during clear weather on Sunday 27 July 2014,
between 1.00 pm to 3.00 pm. Each sample was collected at least 100 cm from the bank
and from submerged sediments. When collecting the sampler would walk into the creek,
find a location free of rocks and thrust the sediment core sampler into the creek bed until
the sampler reached an impenetrable surface. After excess water was allowed to drain from
the sediment core sampler, the sampler was opened and the sediment core was halved
using a stainless steel trowel with the upper and lower halves placed in a labelled plastic
collection containers. On collection samples were immediately placed in an esky with
icebricks for transportation to refridgeration where they were stored until analysis.
Fig 2. Map showing the location of sample collection for the testing of Pb and Zn levels
from sediments of Cockle Creek, NSW (Google Maps 2014).
GPS coordinates and general site details were recorded for each site (Appendix A, Table
1). All equipment was decontaminated prior to collection at the first site and after collection
at each site by rinsing any visible debris from the equipment with creek water, then rinsing
with Decon 90 followed by rinsing with distilled water. One field and two rinsate blanks were
taken during collection.
Sample preparation for analysis
Samples were kept refridgerated for a period of one week prior to processing for analysis.
To ensure analysis of a representative sample the contents of each of the ten samples
collected were mixed prior to sample removal and weighing.
To prepare samples for analysis by x-ray fluorescence spectroscopy, approximately 10
grams of each sediment sample was measured into labelled beakers and oven dried at
110oC (Figure 3) for a period of one week.
Fig 3. Oven drying of sediment samples.
Following dessication large debris was removed and each sample ground to a fine powder
by mortar and pestle (Figure 4).
Fig 4. Grinding of oven dried soil.
Labelled x-ray cannisters (Figure 5) were filled with sufficient sample to cover the bottom of
the cannister for analysis.
Fig 5. Sediment samples in x-ray canisters
ready for analysis.
For analysis by Inductively Coupled Plasma Atomic Emission Spectroscopy (ICP-AES),
approximately 10 grams of each sediment sample was measured into labelled beakers for
digestion (Figure 6).
Fig 6. Weighed sediment samples ready for
digestion.
Additions of 5 mL each of concentrated nitric acid and concentrated hydrochloric acid were
made to each sample. Beakers were covered with watchglasses and placed on a hotplate
and boiled approximately 18 hours (Figure 7). During the digestion process further additions
were made of nitric and hydrochloric acid and of concentrated hydrogen peroxide. Each
hour the condensation on the watchglasses were rinsed into the beakers using distilled
water. Sulfuric acid (18 M) was added to samples from Site 4 to digest the remaining
organic matter.
Fig 7. Digestion of samples on a hotplate.
Following digestion the samples were cooled and then filtered through 45 filter paper to
remove sediment (Figure 8).
Fig 8. Filtering of sediment from samples.
To ensure all sediment was removed from the samples they were vacuum filtered through
Millepore (Figure 9).
Fig 9. Vacuum filtering samples through
Millepore.
Following filtering, samples were placed into volumetric flasks and made up to 100ml with
distilled water (Figure 10). Standards of 1 mg/L, 10 mg/L and 100 mg/L of Pb and Zn were
prepared from 1000 mg/L Pb and 1000 mg/L Zn (Figure 10) and analysed to obtain the
standard curve of absorbancy.
Fig 10. Standards of 1 mg/L, 10 mg/L and
100 mg/L of Pb and Zn in the
foreground with filtered samples
ready for ICP analysis.
Sample analysis
X-ray fluorescence analysis of oven dried sediment was performed on an X-ray MiniPal4
PANalytical (Figure 11).
Fig 11. Sediment prepared for x-ray
analysis.
ICP analysis of the digested sediment samples and Pb and Zn standards was performed on
a Varian Liberty AX Sequential ICP-AES (Figure 12).
Fig 12. ICP analysis of sediment samples
and Pb and Zn standards.
Data Analysis
Data obtained from the analysis of the samples by x-ray fluorescence was initially reviewed
to determine the presence and identity of metals. As x-ray fluorescence is a quantitative
rather than qualitative analysis tool the presence of each element identified can only be
reported as present and it’s quantity in relation to the other elements present.
Data obtained from analysis of the standards by ICP was entered into an excel spreadsheet
and graphed to find the standard curve. The absorbancy equation obtained for Pb: y =
1350.1x - 580.85 (R2 = 1) and for Zn: y = 9562x - 53963 (R2 = 0.9924). Following analysis
of the sediment samples, this equation was used to determine the concentration of Pb and
Zn and the results calculated (Appendix B, Table 1) and graphed in Excel (Figures 13 and
14).
Results
Analysis by x-ray fluorescence indicates that the number of elements present in the
sediments increased in both number and readable amount with the progression of the creek
from Site 1 to Site 5 (Appendix B, Figures 1 to 10). The elements identified are displayed in
Table 1.
Table 1. Elements identified in Cockle Creek sediments.
Element Site 1 Site 2 Site 3 Site 4 Site 5
B T B T B T B T B T
Al          
Br          
Ca          
Cr          
Cu          
Fe          
K          
Mn          
Mo          
S          
Sc          
Si          
Sr          
Ti          
V          
Zn          
B: Bottom of sediment core
T: Top of sediment core
: Element not present
: Element present
No Pb was detected by x-ray fluorescence spectroscopy in any of the samples.
Analysis by ICP of Pb concentration indicates that on average higher levels were retained
in the deeper sediments of Cockle Creek (Figure 13). The mean concentrations of Pb found
cores were 284.68 mg/kg in the bottom half of the sediment cores and 226.12 mg/kg in the
top half of the sediment cores.
Fig 13. Concentration of Pb found in sediment of Cockle Creek, NSW, as determined by
ICP analysis.
Analysis by ICP of Zn concentration indicates that on average higher levels were retained in
the deeper sediments of Cockle Creek (Figure 14). The mean concentrations of Zn found
cores were 683.86 mg/kg in the bottom half of the sediment cores and 587.96 mg/kg in the
top half of the sediment cores.
Fig 14. Concentration of Zn found in sediment of Cockle Creek, NSW, as determined by
ICP analysis.
0
100
200
300
400
500
600
700
800
900
1 2 3 4 5
Pbmg/kg
Site
Bottom
Top
0
100
200
300
400
500
600
700
800
900
1000
1 2 3 4 5
Znmg/kg
Site
Bottom
Top
Differences were also found in the concentration of Pb and Zn between sites. From the
samples taken, Sites 1, 2, 3 and 4 contained Pb concentrations below the 600 mg/kg
Health Investigation Level (HIL) maximum recommended by National Environment
Protection Measures (NEPM) 2013 for open space areas (Appendix C, Table 1). Lead
concentration of the sediment in the top half of the core sample taken from Site 5 was
below the NEPM HILs, however sediment in the bottom half of the core exceeded the
NEPM HILs at 848.31 mg/kg. Zinc levels across all sites were within the maximum NEPM
HILs with Site 3 providing the lowest concentration and Site 4 the highest.
Discussion
The aim of this study was to determine if Pb and Zn concentrations in Cockle Creek are
consistent with the results of the studies performed by the NSW Department of Public
Works and Services (2002), Kim, Owens and Naidu in 2009 and Chariton, Maher and
Roach in 2011. As expected our study found that sediments analysed by ICP-AES
displayed the lowest Pb levels at Site 1 (control site) and highest at Site 5. The variation
found at Sites 2, 3 and 4 could be due to the thickness of the riparian vegetation trapping
sediments prior to entry to the creek, the side of the creek sampled in relation to creek flow
and the taking of one sediment core only from each site. However, while zinc levels did not
exceed the NEPM HILs at any of the sites, Site 3 provided the lowest concentrations and
Site 4 the highest. The reasons for this variation could be similar to the findings for Pb such
as riparian vegetation, the side of the creek sampled and the taking of one sediment core
from each site.
Analysis by x-ray fluorescence spectroscopy did not provide results consistent with previous
studies or the results of this study from ICP-AES analysis with regards to Pb levels. This
inconsistency may be due to the amount of energy employed during x-ray analysis or the
broadness of the spectrum used. A different result may have been obtained if the x-ray
analysis was repeated with a spectrum specific to Pb at a higher energy level.
Of note is the variation in sampling that occurred between this study and previous studies.
The NSW Department of Public Works and Services did not conduct sampling but drew
from previous studies which had utilised a range of sampling techniques at a range of
locations. Kim, Owens and Naidu (2009) collected surface soil samples while Chariton,
Maher and Roach (2011) collected the top 10 cm of creek sediment from Cockle Creek
which they considered representative of sediment deposition over the past 15-20 years.
This study collected sediment samples to a depth of 25 cm at Sites 1, 2 and 3 and to a
depth of 50 cm at Sites 4 and 5. At each site the corer was sunk to the deepest depth
permitted by the underlying bedrock. This method was considered appropriate due to the
underlying bedrock restricting the depth of the sediment profile.
However, overall the study results are consistent with previous studies when considered in
context with the sampling locations and methods. The NSW Department of Public Works
and Services refers to the Pb and Zn concentrations in sediments taken from Cockle Creek.
While it is not known the exact location or the depth of sampling and the levels reported,
are greater than our study obtained, the studies referred to were conducted between 1982
and 2001.
Of the locations sampled by Kim, Owens and Naidu (2009), two were closely located to the
creek sediments collected in this study. Surface soil collected upstream from Site 4 and 5 of
this study, provided Pb concentration levels that were much higher than the NEPM HILs.
Creek sediments collected from Site 4 were close to the maximum NEPM HILs permitted
for residential use with soil access but below the levels permitted for open area use. The
top of the sediment core for Site 5 was within the maximum NEPM HILs permitted for open
area use but would have exceeded the levels for residential use with soil access if it had still
been surface soil. Of note is the high level of Pb found in the bottom of the sediment core
for Site 5 which exceeded both the maximum NEPM HILs permitted for open area use and
residential use with soil access.
Chariton, Maher and Roach (2011) sampled sediment from Cockle Bay which is the inlet
area where Cockle Creek flows into Lake Macquarie, close to Site 5 of our study. The high
results obtained in our study may have two explanations. Sampling in the 2011 study may
have occurred further into the lake where the sediment from the creek may have been
deposited over a greater area and so was thinner at any one point, thus providing a lower
concentration per kg of sediment. Secondly, the sediment core collected was to a depth of
50 cm and does not appear to have been mixed prior to analysis which could potentially
result in only the top of the core being tested. With the expected rate of deposition into lake
Macquarie being between 1 to 7 mm per year (Hollins et al. 2011), the sediments tested
may have been deposited after the smelter closed.
Sediment deposition rate explains the higher concentration of Pb and Zn in the bottom half
of almost all of the sediment cores across Sites 2, 3, 4 and 5. Riparian vegetation reduced
at each site which would explain the reduction in sediment with the progression of the creek
towards Lake Macquarie. It is likely that the bottom half of the sediment cores represent
deposition from over 25 years ago (Hollins et al. 2011), prior to a reduction in contaminants
released by the smelter. As the top half of the sediment cores contained lower levels of Pb
and Zn it would appear that less contaminated sediments have entered Cockle Creek in the
past 25 years.
Conclusion
Our results are consistent with previous studies and with what would be expected eleven
years after the smelter ceased operation. While Pb levels are in excess of the NEPL HILs
for open space in the bottom half of the sediment core from Site 5, it is unlikely that the Pb
is bioaccessible unless the deep creek sediments are dredged or the creek develops an
acidic environment. However, without any further addition of contaminants and or
disturbance of the creekbed, Cockle Creek can be considered environmentally safe and
stable after 106 years of contamination.
Appendix A
Table 1. Site specific information for sampling of sediments from Cockle Creek, NSW.
Site 1
(control site)
The Weir Rd
Bridge, Barnsley
Site 2
Northern end of
Racecourse Rd,
Teralba
Site 3
Raceourse Rd,
Teralba
Site 4
Creek Reserve
Road, Boolaroo
Site 5
Speers Point Park
at junction of
Cockle Creek and
Lake Macquarie
GPS Coordinates 32o56’7” 151o35’44” 32o58’38” 151o32’27” 32o57’11” 151o37’1” 32o57’11” 151o37’1” 32o58’1” 151o36’48”
Distance from bank 200 cm 100 cm 150 cm 200 cm 250 cm
Water flow rate Slow Medium Medium Medium Medium
Depth of sample 25 cm 25 cm 25 cm 50 cm 50 cm
Sample colour Black Black Black Black Black
Sample texture Clayey fine gravel Fine clay Fine clay Fine silty clay with
some pebbles
Sandy with large
pebbles
Sample odour Strong sulfur Sulfurous and oily Slightly sulfurous Slightly sulfurous None
Riparian vegetation Thick vegetation of
river ash, she oaks
and sedges
Mangroves, grasses
and reeds approx 2
metres thick along
creek bank
Mangroves, she
oaks, reeds and
grasses approx 2
metres thick along
creek bank
Mangroves, reeds
and grasses approx
2 metres thick along
creek bank
Grass
Features of site Inside curve of
eastern bank
Near railway line Close to Lucky’s
Scrap Metals
Across from the Five
Islands
Inner edge of
peninsula
Appendix B
Fig 1. X-ray fluorescence analysis of the bottom of the sediment core from Site 1.
Fig 2. X-ray fluorescence analysis of the top of the sediment core from Site 1.
Fig 3. X-ray fluorescence analysis of the bottom of the sediment core from Site 2.
Fig 4. X-ray fluorescence analysis of the top of the sediment core from Site 2.
Fig 5. X-ray fluorescence analysis of the bottom of the sediment core from Site 3.
.
Fig 6. X-ray fluorescence analysis of the top of the sediment core from Site 3.
Fig 7. X-ray fluorescence analysis of the bottom of the sediment core from Site 4.
Fig 8. X-ray fluorescence analysis of the top of the sediment core from Site 4.
Fig 9. X-ray fluorescence analysis of the bottom of the sediment core from Site 5.
Fig 10. X-ray fluorescence analysis of the top of the sediment core from Site 5.
Appendix C
Table 1. Absorbancies obtained by ICP analysis with conversion to mg/Kg
Sample Zn absorb Pb absorb
Zn conc
mg/100 mL
Pb conc
mg/100 mL Soil wght (gm) Zn mg/Kg Pb mg/Kg
1B 671027 6626.24 64.53294 5.33819 11.204 575.9813 47.64539
1T 871699 11304.4 85.51935 8.803237 11.5106 742.9617 76.47939
2B 887375 34780.5 87.15875 26.19165 11.0551 788.4031 236.9192
2T 692406 15637.9 66.76877 12.013 10.8507 615.3407 110.7117
3B 505610 11987.6 47.23353 9.309273 11.864 398.1248 78.46657
3T 150163 2535.2 10.06066 2.308014 10.0911 99.69832 22.87178
4B 906097 28974.4 89.11671 21.89116 10.3231 863.2747 212.0599
4T 968724 52697 95.66628 39.46215 11.271 848.7826 350.1211
5B 940183 133190 92.68145 99.08218 11.68 793.5055 848.3063
5T 765444 89942 74.40713 67.049 11.7544 633.0151 570.4162
Appendix D
Table 1. Health Investigation values in mg kg-1 for soil from NEPM 2013
Substance
Health Investigation Levels
values in mg kg-1
A B C D
Arsenic2 100 500 300 3 000
Beryllium 60 90 90 500
Boron 4500 40 000 20 000 300 000
Cadmium 20 150 90 900
Chromium (VI) 100 500 300 3600
Cobalt 100 600 300 4000
Copper 6000 30 000 17 000 240 000
Lead3 300 1200 600 1 500
Manganese 3800 14 000 19 000 60 000
Mercury (inorganic)5 40 120 80 730
Methyl mercury4 10 30 13 180
Nickel 400 1200 1200 6 000
Selenium 200 1400 700 10 000
Zinc 7400 60 000 30 000 400 000
Cyanide (free) 250 300 240 1 500
A Residential use with garden/accessible soil
B Residential with minimal opportunities for soil access
C Parks, recreational open space and playing fields
D Commercial/industrial use
(Australian Government ComLaw 2013)
References
Agency for Toxic Substances and Disease Registry (2014) Lead. Available at:
http://www.atsdr.cdc.gov/toxprofiles/tp13-c6.pdf (accessed 20 July 2014).
Alloway BJ, Ayres DC (1997) Chemical Principles of Environmental Pollution. Blackie
Academic & Professional Publishers (Melbourne)
Australian Government ComLaw (2013). Schedule B1: National Environment Protection
(Assessment of Site Contamination) Measure 1999 (as amended).
http://www.comlaw.gov.au/Details/F2013C00288/Html/Volume_2 (accessed 6
November 2014).
Australian Government Department of the Environment (2014) Lead Alert. Available at:
http://www.environment.gov.au/resource/lead-alert-facts-lead-house-paint (accessed
on 20 July 2014).
Australian Government Geoscience (2014) Australian Mines Atlas - Lead Factsheet.
Available at: http://www.australianminesatlas.gov.au/education/fact_sheets/lead.html
(accessed 20 July 2014).
Chariton AA, Maher WA, Roach AC (2011) Recolonisation of translocated metal-
contaminated sediments by estuaring macrobenthic assemblages. Exotoxicology 20,
706-718. doi: 10.1007/s10646-011-0612-6
Department of Human Services (1997). National Environmental Health Forum Monographs
- Metal Series No. 2.
http://www.health.vic.gov.au/archive/archive2014/nphp/enhealth/council/pubs/pdf/zinc.
pdf (accessed 9 November 2014).
Department of Primary Industries NSW (2000). Understanding Soil pH.
http://www.dpi.nsw.gov.au/__data/assets/pdf_file/0003/167187/soil-ph.pdf (accessed
9 November 2014).
Former Standing Council on Environment and Water (2014) ASC NEPM Toolbox. Available
at: http://www.scew.gov.au/node/941(accessed 20 July 2014).
Google Maps (2014). Cockle Creek. https://www.google.com.au/maps/@-
32.9422728,151.6124086,14z (accessed 1 November 2014).
Harmaza YM, Slobozhanina (2014). Zinc essentiality and toxicity. Biophysical aspects.
Biophysics 59(2), 264-275. doi: 10.1134/S0006350914020092
Hildebrandt A, Lacorte S & Barcelo D (2006). Sampling of water, soil and sediment to trace
organic pollutants at a river-basin scale. Analytical and Bioanalytical Chemistry 386,
1075-1088. doi:10.1007/s00216-006-0486-2
Hollins SE, Harrison JJ, Jones BG, Zawadzki A, Heijinis H & Hankin S (2011).
Reconstructing recent sedimentation in two urbanised coastal lagoons (NSW,
Australia) using radioisotopes and geochemistry. Journal of Paleolimnology 46, 579-
596. doi: 10.1007/s10933-011-9555-4
Hoyle B (2005) Sediment Contamination. UXL Encyclopedia of Water Science 3, 438-442.
Available at:
http://go.galegroup.com.ezproxy.une.edu.au/ps/i.do?action=interpret&id=GALE%7CC
X3437400119&v=2.1&u=dixson&it=r&p=GVRL&sw=w&authCount=1 (accessed 20
July 2014).
Kim KR, Owens G, Naidu R (2009). Heavy metal distribution, bioaccessibility and
phytoavailability in long-term contaminated soils from Lake Macquarie, Australia.
Australian Journal of Soil Research 47, 166-176. Available at:
http://go.galegroup.com/ps/i.do?id=GALE% (accessed 20 July 2014).
NSW Department of Public Works and Services (2002) Feasibility Study Environmental
Improvements/Management of Cockle Bay. Available at:
http://www.livinglakemacquarie.org/files/dwnlds/archives/dnarch02/Cockle-
May2002.pdf (accessed 20 July 2014).
NSW Health Department (1991) Taking Childhood Lead Poisoning. Public Health Bulletin 2,
98-99. Available at: http://www.publish.csiro.au/?act=view_file&file_id=NB91044.pdf
(accessed 20 July 2014).
Pasminco (2014) Lead Abatement Strategy. Available at:
http://www.pasminco.com.au/index.php/pasminco-cockle-creek/history (accessed 20
July 2014).
Reichman SM (2002). The Responses of Plants to Metal Toxicity: A review focusing on
Copper, Manganese and Zinc. Australian Minerals & Energy Environment Foundation.
http://plantstress.com/Articles/toxicity_i/Metal_toxicity.pdf (accessed 9 November
2014).
Willmore A, Sladden T, Bates L, Dalton CB (2006) Use of a geographic information system
to track smelter-related lead exposures in children: North Lake Macquarie, Australia,
1991–2002. International Journal of Health Geographics 5, 1-14. doi:
doi:10.1186/1476-072X-5-30
WorkCover Authority of NSW (2013) Personal protective equipment. Available at:
http://www.workcover.nsw.gov.au/newlegislation2012/general-risk-
management/Pages/personal-protective-equipment.aspx (accessed 20 July 2014).

More Related Content

What's hot

Oladimeji akinsile seminar presentation
Oladimeji akinsile seminar presentationOladimeji akinsile seminar presentation
Oladimeji akinsile seminar presentationoladimeji akinsile
 
Soil organic carbon analysis techniques
Soil organic carbon analysis techniquesSoil organic carbon analysis techniques
Soil organic carbon analysis techniquesIkj Irum
 
Spatial distribution and environmental geochemistry of zinc metal in water an...
Spatial distribution and environmental geochemistry of zinc metal in water an...Spatial distribution and environmental geochemistry of zinc metal in water an...
Spatial distribution and environmental geochemistry of zinc metal in water an...Javier Quesada Duque
 
IJGES_A024_(41-58) (1)
IJGES_A024_(41-58) (1)IJGES_A024_(41-58) (1)
IJGES_A024_(41-58) (1)rakeshsucks
 
Isotope Presentation By Maggie Ziriax
Isotope Presentation By  Maggie  ZiriaxIsotope Presentation By  Maggie  Ziriax
Isotope Presentation By Maggie ZiriaxEcomuseum Cavalleria
 
Assessment of impact of climatic change on groundwater quality around igbokod...
Assessment of impact of climatic change on groundwater quality around igbokod...Assessment of impact of climatic change on groundwater quality around igbokod...
Assessment of impact of climatic change on groundwater quality around igbokod...Alexander Decker
 
7 stable isotopes-1
7 stable isotopes-17 stable isotopes-1
7 stable isotopes-1yuvaraja2009
 
HEAVY METALS OF LEAD (PB) ACCUMULATION IN SEAWEED (GRACILARIA SP) CULTIVATION...
HEAVY METALS OF LEAD (PB) ACCUMULATION IN SEAWEED (GRACILARIA SP) CULTIVATION...HEAVY METALS OF LEAD (PB) ACCUMULATION IN SEAWEED (GRACILARIA SP) CULTIVATION...
HEAVY METALS OF LEAD (PB) ACCUMULATION IN SEAWEED (GRACILARIA SP) CULTIVATION...IAEME Publication
 
Poster watershed FINAL
Poster watershed FINALPoster watershed FINAL
Poster watershed FINALBritney Wells
 
Denitrification within Saturated Riparian Buffers Re-designed to Remove Nitra...
Denitrification within Saturated Riparian Buffers Re-designed to Remove Nitra...Denitrification within Saturated Riparian Buffers Re-designed to Remove Nitra...
Denitrification within Saturated Riparian Buffers Re-designed to Remove Nitra...National Institute of Food and Agriculture
 
Yvonne Wetzig_AGU Poster 2015
Yvonne Wetzig_AGU Poster 2015Yvonne Wetzig_AGU Poster 2015
Yvonne Wetzig_AGU Poster 2015Yvonne Wetzig
 
Building Soil Carbon: Benefits, Possibilities, and Modeling
Building Soil Carbon: Benefits, Possibilities, and ModelingBuilding Soil Carbon: Benefits, Possibilities, and Modeling
Building Soil Carbon: Benefits, Possibilities, and ModelingCarbon Coalition
 
Effect of global warming on soil organic Carbon
Effect of global warming on soil organic CarbonEffect of global warming on soil organic Carbon
Effect of global warming on soil organic CarbonP.K. Mani
 
FINAL PRINT - PXRF Soil Salinity SS
FINAL PRINT - PXRF Soil Salinity SSFINAL PRINT - PXRF Soil Salinity SS
FINAL PRINT - PXRF Soil Salinity SSCourtney Nelson
 

What's hot (20)

Oladimeji akinsile seminar presentation
Oladimeji akinsile seminar presentationOladimeji akinsile seminar presentation
Oladimeji akinsile seminar presentation
 
Soil organic carbon analysis techniques
Soil organic carbon analysis techniquesSoil organic carbon analysis techniques
Soil organic carbon analysis techniques
 
Arctic change 2017
Arctic change 2017Arctic change 2017
Arctic change 2017
 
Casi Poster final 2016
Casi Poster final 2016Casi Poster final 2016
Casi Poster final 2016
 
Spatial distribution and environmental geochemistry of zinc metal in water an...
Spatial distribution and environmental geochemistry of zinc metal in water an...Spatial distribution and environmental geochemistry of zinc metal in water an...
Spatial distribution and environmental geochemistry of zinc metal in water an...
 
IJGES_A024_(41-58) (1)
IJGES_A024_(41-58) (1)IJGES_A024_(41-58) (1)
IJGES_A024_(41-58) (1)
 
Isotope Presentation By Maggie Ziriax
Isotope Presentation By  Maggie  ZiriaxIsotope Presentation By  Maggie  Ziriax
Isotope Presentation By Maggie Ziriax
 
Assessment of impact of climatic change on groundwater quality around igbokod...
Assessment of impact of climatic change on groundwater quality around igbokod...Assessment of impact of climatic change on groundwater quality around igbokod...
Assessment of impact of climatic change on groundwater quality around igbokod...
 
J045035767
J045035767J045035767
J045035767
 
7 stable isotopes-1
7 stable isotopes-17 stable isotopes-1
7 stable isotopes-1
 
Stable carbon isotopes
Stable carbon isotopesStable carbon isotopes
Stable carbon isotopes
 
Carbon cycles lecture
Carbon cycles lectureCarbon cycles lecture
Carbon cycles lecture
 
HEAVY METALS OF LEAD (PB) ACCUMULATION IN SEAWEED (GRACILARIA SP) CULTIVATION...
HEAVY METALS OF LEAD (PB) ACCUMULATION IN SEAWEED (GRACILARIA SP) CULTIVATION...HEAVY METALS OF LEAD (PB) ACCUMULATION IN SEAWEED (GRACILARIA SP) CULTIVATION...
HEAVY METALS OF LEAD (PB) ACCUMULATION IN SEAWEED (GRACILARIA SP) CULTIVATION...
 
Poster watershed FINAL
Poster watershed FINALPoster watershed FINAL
Poster watershed FINAL
 
Denitrification within Saturated Riparian Buffers Re-designed to Remove Nitra...
Denitrification within Saturated Riparian Buffers Re-designed to Remove Nitra...Denitrification within Saturated Riparian Buffers Re-designed to Remove Nitra...
Denitrification within Saturated Riparian Buffers Re-designed to Remove Nitra...
 
Yvonne Wetzig_AGU Poster 2015
Yvonne Wetzig_AGU Poster 2015Yvonne Wetzig_AGU Poster 2015
Yvonne Wetzig_AGU Poster 2015
 
Building Soil Carbon: Benefits, Possibilities, and Modeling
Building Soil Carbon: Benefits, Possibilities, and ModelingBuilding Soil Carbon: Benefits, Possibilities, and Modeling
Building Soil Carbon: Benefits, Possibilities, and Modeling
 
Effect of global warming on soil organic Carbon
Effect of global warming on soil organic CarbonEffect of global warming on soil organic Carbon
Effect of global warming on soil organic Carbon
 
FINAL PRINT - PXRF Soil Salinity SS
FINAL PRINT - PXRF Soil Salinity SSFINAL PRINT - PXRF Soil Salinity SS
FINAL PRINT - PXRF Soil Salinity SS
 
Universiteit utrecht
Universiteit utrechtUniversiteit utrecht
Universiteit utrecht
 

Similar to Pb, Zn Levels in Cockle Creek Sediments

GEOSCIENCE 08 Carey et al 437-444
GEOSCIENCE 08 Carey et al 437-444GEOSCIENCE 08 Carey et al 437-444
GEOSCIENCE 08 Carey et al 437-444Anita Carey
 
Cation Concentrations of Anaocha, Ekwusigo And Ogbaru Local Government Areas ...
Cation Concentrations of Anaocha, Ekwusigo And Ogbaru Local Government Areas ...Cation Concentrations of Anaocha, Ekwusigo And Ogbaru Local Government Areas ...
Cation Concentrations of Anaocha, Ekwusigo And Ogbaru Local Government Areas ...IJRESJOURNAL
 
A Study of Application of Tracers in Groundwater Hydrology
A Study of Application of Tracers in Groundwater HydrologyA Study of Application of Tracers in Groundwater Hydrology
A Study of Application of Tracers in Groundwater HydrologyAJSERJournal
 
Trace metals concentration determination in domestic water
Trace metals concentration determination in domestic waterTrace metals concentration determination in domestic water
Trace metals concentration determination in domestic waterAlexander Decker
 
Heavy metals in langkawi corals
Heavy metals in langkawi coralsHeavy metals in langkawi corals
Heavy metals in langkawi coralsMasrisazlin Bakri
 
Evaluation of some heavy metals in roadside soil along Samaru-Giwa road, Zari...
Evaluation of some heavy metals in roadside soil along Samaru-Giwa road, Zari...Evaluation of some heavy metals in roadside soil along Samaru-Giwa road, Zari...
Evaluation of some heavy metals in roadside soil along Samaru-Giwa road, Zari...Innspub Net
 
Auckland Volcanic Field Olivine Research Poster for AGU Fall 2013_Smid
Auckland Volcanic Field Olivine Research Poster for AGU Fall 2013_SmidAuckland Volcanic Field Olivine Research Poster for AGU Fall 2013_Smid
Auckland Volcanic Field Olivine Research Poster for AGU Fall 2013_Smidelainesmid
 
Science_Coale_Roberts_2004
Science_Coale_Roberts_2004Science_Coale_Roberts_2004
Science_Coale_Roberts_2004phyto
 
final dissertation report
final dissertation reportfinal dissertation report
final dissertation reportLuis Duprat
 
Impact of contaminants on groundwater quality in patcham, south east england.
Impact of contaminants on groundwater quality in patcham, south east england.Impact of contaminants on groundwater quality in patcham, south east england.
Impact of contaminants on groundwater quality in patcham, south east england.Alexander Decker
 
Trace Metals Concentration in Shallow Well Water in Enugu Metropolis
Trace Metals Concentration in Shallow Well Water in Enugu MetropolisTrace Metals Concentration in Shallow Well Water in Enugu Metropolis
Trace Metals Concentration in Shallow Well Water in Enugu Metropolispaperpublications3
 
HHMI April 2015 Poster
HHMI April 2015 PosterHHMI April 2015 Poster
HHMI April 2015 PosterConnor Daniel
 

Similar to Pb, Zn Levels in Cockle Creek Sediments (20)

Eubanks-Poster Final
Eubanks-Poster FinalEubanks-Poster Final
Eubanks-Poster Final
 
GEOSCIENCE 08 Carey et al 437-444
GEOSCIENCE 08 Carey et al 437-444GEOSCIENCE 08 Carey et al 437-444
GEOSCIENCE 08 Carey et al 437-444
 
Cation Concentrations of Anaocha, Ekwusigo And Ogbaru Local Government Areas ...
Cation Concentrations of Anaocha, Ekwusigo And Ogbaru Local Government Areas ...Cation Concentrations of Anaocha, Ekwusigo And Ogbaru Local Government Areas ...
Cation Concentrations of Anaocha, Ekwusigo And Ogbaru Local Government Areas ...
 
groundwater arsenic
groundwater arsenicgroundwater arsenic
groundwater arsenic
 
A Study of Application of Tracers in Groundwater Hydrology
A Study of Application of Tracers in Groundwater HydrologyA Study of Application of Tracers in Groundwater Hydrology
A Study of Application of Tracers in Groundwater Hydrology
 
Trace metals concentration determination in domestic water
Trace metals concentration determination in domestic waterTrace metals concentration determination in domestic water
Trace metals concentration determination in domestic water
 
Heavy metals in langkawi corals
Heavy metals in langkawi coralsHeavy metals in langkawi corals
Heavy metals in langkawi corals
 
Evaluation of some heavy metals in roadside soil along Samaru-Giwa road, Zari...
Evaluation of some heavy metals in roadside soil along Samaru-Giwa road, Zari...Evaluation of some heavy metals in roadside soil along Samaru-Giwa road, Zari...
Evaluation of some heavy metals in roadside soil along Samaru-Giwa road, Zari...
 
Auckland Volcanic Field Olivine Research Poster for AGU Fall 2013_Smid
Auckland Volcanic Field Olivine Research Poster for AGU Fall 2013_SmidAuckland Volcanic Field Olivine Research Poster for AGU Fall 2013_Smid
Auckland Volcanic Field Olivine Research Poster for AGU Fall 2013_Smid
 
2019-09-19 - Richard Greene - The effect of dust borne salt and sodium on lan...
2019-09-19 - Richard Greene - The effect of dust borne salt and sodium on lan...2019-09-19 - Richard Greene - The effect of dust borne salt and sodium on lan...
2019-09-19 - Richard Greene - The effect of dust borne salt and sodium on lan...
 
Science_Coale_Roberts_2004
Science_Coale_Roberts_2004Science_Coale_Roberts_2004
Science_Coale_Roberts_2004
 
Publication
PublicationPublication
Publication
 
CL_LOIPOSTERFINAL
CL_LOIPOSTERFINALCL_LOIPOSTERFINAL
CL_LOIPOSTERFINAL
 
final dissertation report
final dissertation reportfinal dissertation report
final dissertation report
 
Impact of contaminants on groundwater quality in patcham, south east england.
Impact of contaminants on groundwater quality in patcham, south east england.Impact of contaminants on groundwater quality in patcham, south east england.
Impact of contaminants on groundwater quality in patcham, south east england.
 
Star 2011 Final
Star 2011 FinalStar 2011 Final
Star 2011 Final
 
Trace Metals Concentration in Shallow Well Water in Enugu Metropolis
Trace Metals Concentration in Shallow Well Water in Enugu MetropolisTrace Metals Concentration in Shallow Well Water in Enugu Metropolis
Trace Metals Concentration in Shallow Well Water in Enugu Metropolis
 
HHMI April 2015 Poster
HHMI April 2015 PosterHHMI April 2015 Poster
HHMI April 2015 Poster
 
19) Jeff Westrop
19) Jeff Westrop19) Jeff Westrop
19) Jeff Westrop
 
Suspended Sediment Measurements in Irish Rivers (summary)
Suspended Sediment Measurements in Irish Rivers (summary)Suspended Sediment Measurements in Irish Rivers (summary)
Suspended Sediment Measurements in Irish Rivers (summary)
 

Pb, Zn Levels in Cockle Creek Sediments

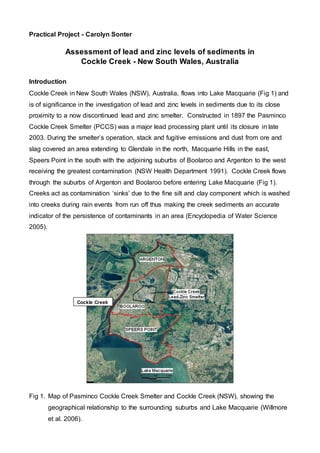
  • 1. Practical Project - Carolyn Sonter Assessment of lead and zinc levels of sediments in Cockle Creek - New South Wales, Australia Introduction Cockle Creek in New South Wales (NSW), Australia, flows into Lake Macquarie (Fig 1) and is of significance in the investigation of lead and zinc levels in sediments due to its close proximity to a now discontinued lead and zinc smelter. Constructed in 1897 the Pasminco Cockle Creek Smelter (PCCS) was a major lead processing plant until its closure in late 2003. During the smelter’s operation, stack and fugitive emissions and dust from ore and slag covered an area extending to Glendale in the north, Macquarie Hills in the east, Speers Point in the south with the adjoining suburbs of Boolaroo and Argenton to the west receiving the greatest contamination (NSW Health Department 1991). Cockle Creek flows through the suburbs of Argenton and Boolaroo before entering Lake Macquarie (Fig 1). Creeks act as contamination ‘sinks’ due to the fine silt and clay component which is washed into creeks during rain events from run off thus making the creek sediments an accurate indicator of the persistence of contaminants in an area (Encyclopedia of Water Science 2005). Fig 1. Map of Pasminco Cockle Creek Smelter and Cockle Creek (NSW), showing the geographical relationship to the surrounding suburbs and Lake Macquarie (Willmore et al. 2006). Cockle Creek
  • 2. Lead (Pb) is a metal, bluish grey in colour and found in the earth’s crust in small amounts usually in ore which also contains zinc, silver and copper (Geoscience Australia 2014). Lead may take several forms depending on the pH, salinity and humic content of the medium (Agency for Toxic Substances and Disease Registry 2014). Exposure to Pb can occur from the inhalation or ingestion of lead dust, particles or exhaust emissions from lead being burnt (Australian Government Department of the Environment 2014). Lead is found in air, water and soil in a range of compounds with the bioavailability and persistence largely determined by the compound formed, with organic lead the most toxic (Alloway and Ayres 1997). The health effects of exposure to Pb can be both acute and chronic (Australian Government Department of the Environment 2014). In children, exposure to Pb can result in reduced intelligence, slowed growth and hearing problems while in adults, increased blood pressure, brain and kidney damage and damage to the reproductive organs is common (Agency for Toxic Substances and Disease Registry 2014). Zinc (Zn) is a relatively abundant bluish-white, lustrous, diamagnetic metal, often found in association with other base metals such as lead, silver and copper (Geoscience Australia 2014). Zinc may take several forms depending on the pH of the medium and temperature with acidic conditions increasing availability. Due to an electrochemical reaction known as galvanic action, Zn is commonly used as an anti-corrosion coating in the construction, transport and appliance manufacturing industries (Geoscience Australia 2014). Zinc is also used to create alloys such as bronze, pigments, salts, oxide additives to rubber and in fertilizers (Geoscience Australia 2014). While Zn is a mineral essential for human, animal and plant health, the absorption of excessive Zn in humans results in Iron (Fe) and Copper (Cu) deficiencies which cease with a reduction in exposure (Harmaza & Slobozhanina 2014; Department of Human Services 1997). Excess Zn in soil water results in plants exhibiting Phosphorous (P) and Fe deficiencies and eventual death if exposure is not reduced (Reichman 2002). A 1973 survey of ceiling dust, room dust and soil in Boolaroo and Argenton revealed that Pb levels ranged from 2759-30,764 parts per million (ppm), 23-35,870 ppm and 8-26,794 ppm respectively (NSW Health Department 1991). As Zn was not a focus of the 1973 survey, no information is provided by the 1973 survey. The Australian guidelines for the assessment of contaminated sites recommend further investigation if soil levels are above 300 ppm (former Standing Council on Environment and Water 2014). Information regarding if the sediments of Cockle Creek were tested at this time is not available. Since 1973 regular testing has occurred in the suburbs surrounding the PCCS largely related to a Lead
  • 3. Abatement Strategy (LAS) which was developed in conjunction with Department of Environment, Climate Change and Water New South Wales and Lake Macquarie City Council Health in response to the high levels found in humans and soil (Pasminco 2014). The LAS concluded in February 2013. Kim, Owens and Naidu (2009) conducted an independent heavy metal distribution, bioaccessibility and phytoavailability study of the suburbs considered contaminated and others further afield. Lead levels of between 79 mg/Kg and 58,000 mg/Kg were found in the suburbs previously tested in 1973 and levels between 8 mg/Kg and 235 mg/Kg were found in those areas outside of the 1973 test area (Kim et al. 2009). Zinc levels of between 310 mg/Kg and 90,000 mg/Kg were found in the suburbs tested for Pb in 1973 and levels of between 5 mg/Kg and 660 mg/Kg were found outside of the 1973 Pb test area (Kim et al. 2009). The NSW Department of Public Works and Services conducted a study in 2002 which involved the testing of Pb and Zn levels from sediment cores taken from 21 sites surrounding PCCS, including Cockle Creek, Cockle Bay and Lake Macquarie. That study provided Pb levels of 326 to 1360 mg/kg and Zn levels of 1003 to 2700 mg/kg (NSW Department of Public Works and Services 2002) which are in excess of the Australian guidelines (former Standing Council on Environment and Water 2014). Chariton, Maher and Roach (2011) tested sediment pore water from Cockle Bay in Lake Macquarie. Their results indicated Pb of 260 mg/kg and Zn of 550 mg/Kg, however, these levels do not indicate the Pb and Zn level of the sediment particles but rather the Pb and Zn available for extraction by water from the sediment (Chariton et al. 2011). The proposed study will test the Pb and Zn levels in sediment cores from five sites in Cockle Creek. Testing will be performed upstream from PCCS and the remainder at evenly distributed points between PCCS and Cockle Bay. It is expected that the Pb and Zn results will be consistent with results of the studies performed by the NSW Department of Public Works and Services (2002), Kim, Owens and Naidu in 2009 and Chariton, Maher and Roach in 2011. Methods Sampling site and procedure Samples were collected from five sites, upstream from (Site 1 (control site)), level with (Site 2) and downstream from (Sites 3, 4 and 5) the smelter site (Figure 2). Sampling was performed by the author and an assistant during clear weather on Sunday 27 July 2014, between 1.00 pm to 3.00 pm. Each sample was collected at least 100 cm from the bank
  • 4. and from submerged sediments. When collecting the sampler would walk into the creek, find a location free of rocks and thrust the sediment core sampler into the creek bed until the sampler reached an impenetrable surface. After excess water was allowed to drain from the sediment core sampler, the sampler was opened and the sediment core was halved using a stainless steel trowel with the upper and lower halves placed in a labelled plastic collection containers. On collection samples were immediately placed in an esky with icebricks for transportation to refridgeration where they were stored until analysis. Fig 2. Map showing the location of sample collection for the testing of Pb and Zn levels from sediments of Cockle Creek, NSW (Google Maps 2014). GPS coordinates and general site details were recorded for each site (Appendix A, Table 1). All equipment was decontaminated prior to collection at the first site and after collection at each site by rinsing any visible debris from the equipment with creek water, then rinsing with Decon 90 followed by rinsing with distilled water. One field and two rinsate blanks were taken during collection.
  • 5. Sample preparation for analysis Samples were kept refridgerated for a period of one week prior to processing for analysis. To ensure analysis of a representative sample the contents of each of the ten samples collected were mixed prior to sample removal and weighing. To prepare samples for analysis by x-ray fluorescence spectroscopy, approximately 10 grams of each sediment sample was measured into labelled beakers and oven dried at 110oC (Figure 3) for a period of one week. Fig 3. Oven drying of sediment samples. Following dessication large debris was removed and each sample ground to a fine powder by mortar and pestle (Figure 4). Fig 4. Grinding of oven dried soil.
  • 6. Labelled x-ray cannisters (Figure 5) were filled with sufficient sample to cover the bottom of the cannister for analysis. Fig 5. Sediment samples in x-ray canisters ready for analysis. For analysis by Inductively Coupled Plasma Atomic Emission Spectroscopy (ICP-AES), approximately 10 grams of each sediment sample was measured into labelled beakers for digestion (Figure 6). Fig 6. Weighed sediment samples ready for digestion. Additions of 5 mL each of concentrated nitric acid and concentrated hydrochloric acid were made to each sample. Beakers were covered with watchglasses and placed on a hotplate and boiled approximately 18 hours (Figure 7). During the digestion process further additions
  • 7. were made of nitric and hydrochloric acid and of concentrated hydrogen peroxide. Each hour the condensation on the watchglasses were rinsed into the beakers using distilled water. Sulfuric acid (18 M) was added to samples from Site 4 to digest the remaining organic matter. Fig 7. Digestion of samples on a hotplate. Following digestion the samples were cooled and then filtered through 45 filter paper to remove sediment (Figure 8). Fig 8. Filtering of sediment from samples. To ensure all sediment was removed from the samples they were vacuum filtered through Millepore (Figure 9).
  • 8. Fig 9. Vacuum filtering samples through Millepore. Following filtering, samples were placed into volumetric flasks and made up to 100ml with distilled water (Figure 10). Standards of 1 mg/L, 10 mg/L and 100 mg/L of Pb and Zn were prepared from 1000 mg/L Pb and 1000 mg/L Zn (Figure 10) and analysed to obtain the standard curve of absorbancy. Fig 10. Standards of 1 mg/L, 10 mg/L and 100 mg/L of Pb and Zn in the foreground with filtered samples ready for ICP analysis. Sample analysis X-ray fluorescence analysis of oven dried sediment was performed on an X-ray MiniPal4 PANalytical (Figure 11).
  • 9. Fig 11. Sediment prepared for x-ray analysis. ICP analysis of the digested sediment samples and Pb and Zn standards was performed on a Varian Liberty AX Sequential ICP-AES (Figure 12). Fig 12. ICP analysis of sediment samples and Pb and Zn standards. Data Analysis Data obtained from the analysis of the samples by x-ray fluorescence was initially reviewed to determine the presence and identity of metals. As x-ray fluorescence is a quantitative rather than qualitative analysis tool the presence of each element identified can only be reported as present and it’s quantity in relation to the other elements present.
  • 10. Data obtained from analysis of the standards by ICP was entered into an excel spreadsheet and graphed to find the standard curve. The absorbancy equation obtained for Pb: y = 1350.1x - 580.85 (R2 = 1) and for Zn: y = 9562x - 53963 (R2 = 0.9924). Following analysis of the sediment samples, this equation was used to determine the concentration of Pb and Zn and the results calculated (Appendix B, Table 1) and graphed in Excel (Figures 13 and 14). Results Analysis by x-ray fluorescence indicates that the number of elements present in the sediments increased in both number and readable amount with the progression of the creek from Site 1 to Site 5 (Appendix B, Figures 1 to 10). The elements identified are displayed in Table 1. Table 1. Elements identified in Cockle Creek sediments. Element Site 1 Site 2 Site 3 Site 4 Site 5 B T B T B T B T B T Al           Br           Ca           Cr           Cu           Fe           K           Mn           Mo           S           Sc           Si           Sr           Ti           V           Zn           B: Bottom of sediment core T: Top of sediment core : Element not present : Element present No Pb was detected by x-ray fluorescence spectroscopy in any of the samples.
  • 11. Analysis by ICP of Pb concentration indicates that on average higher levels were retained in the deeper sediments of Cockle Creek (Figure 13). The mean concentrations of Pb found cores were 284.68 mg/kg in the bottom half of the sediment cores and 226.12 mg/kg in the top half of the sediment cores. Fig 13. Concentration of Pb found in sediment of Cockle Creek, NSW, as determined by ICP analysis. Analysis by ICP of Zn concentration indicates that on average higher levels were retained in the deeper sediments of Cockle Creek (Figure 14). The mean concentrations of Zn found cores were 683.86 mg/kg in the bottom half of the sediment cores and 587.96 mg/kg in the top half of the sediment cores. Fig 14. Concentration of Zn found in sediment of Cockle Creek, NSW, as determined by ICP analysis. 0 100 200 300 400 500 600 700 800 900 1 2 3 4 5 Pbmg/kg Site Bottom Top 0 100 200 300 400 500 600 700 800 900 1000 1 2 3 4 5 Znmg/kg Site Bottom Top
  • 12. Differences were also found in the concentration of Pb and Zn between sites. From the samples taken, Sites 1, 2, 3 and 4 contained Pb concentrations below the 600 mg/kg Health Investigation Level (HIL) maximum recommended by National Environment Protection Measures (NEPM) 2013 for open space areas (Appendix C, Table 1). Lead concentration of the sediment in the top half of the core sample taken from Site 5 was below the NEPM HILs, however sediment in the bottom half of the core exceeded the NEPM HILs at 848.31 mg/kg. Zinc levels across all sites were within the maximum NEPM HILs with Site 3 providing the lowest concentration and Site 4 the highest. Discussion The aim of this study was to determine if Pb and Zn concentrations in Cockle Creek are consistent with the results of the studies performed by the NSW Department of Public Works and Services (2002), Kim, Owens and Naidu in 2009 and Chariton, Maher and Roach in 2011. As expected our study found that sediments analysed by ICP-AES displayed the lowest Pb levels at Site 1 (control site) and highest at Site 5. The variation found at Sites 2, 3 and 4 could be due to the thickness of the riparian vegetation trapping sediments prior to entry to the creek, the side of the creek sampled in relation to creek flow and the taking of one sediment core only from each site. However, while zinc levels did not exceed the NEPM HILs at any of the sites, Site 3 provided the lowest concentrations and Site 4 the highest. The reasons for this variation could be similar to the findings for Pb such as riparian vegetation, the side of the creek sampled and the taking of one sediment core from each site. Analysis by x-ray fluorescence spectroscopy did not provide results consistent with previous studies or the results of this study from ICP-AES analysis with regards to Pb levels. This inconsistency may be due to the amount of energy employed during x-ray analysis or the broadness of the spectrum used. A different result may have been obtained if the x-ray analysis was repeated with a spectrum specific to Pb at a higher energy level. Of note is the variation in sampling that occurred between this study and previous studies. The NSW Department of Public Works and Services did not conduct sampling but drew from previous studies which had utilised a range of sampling techniques at a range of locations. Kim, Owens and Naidu (2009) collected surface soil samples while Chariton, Maher and Roach (2011) collected the top 10 cm of creek sediment from Cockle Creek which they considered representative of sediment deposition over the past 15-20 years. This study collected sediment samples to a depth of 25 cm at Sites 1, 2 and 3 and to a depth of 50 cm at Sites 4 and 5. At each site the corer was sunk to the deepest depth
  • 13. permitted by the underlying bedrock. This method was considered appropriate due to the underlying bedrock restricting the depth of the sediment profile. However, overall the study results are consistent with previous studies when considered in context with the sampling locations and methods. The NSW Department of Public Works and Services refers to the Pb and Zn concentrations in sediments taken from Cockle Creek. While it is not known the exact location or the depth of sampling and the levels reported, are greater than our study obtained, the studies referred to were conducted between 1982 and 2001. Of the locations sampled by Kim, Owens and Naidu (2009), two were closely located to the creek sediments collected in this study. Surface soil collected upstream from Site 4 and 5 of this study, provided Pb concentration levels that were much higher than the NEPM HILs. Creek sediments collected from Site 4 were close to the maximum NEPM HILs permitted for residential use with soil access but below the levels permitted for open area use. The top of the sediment core for Site 5 was within the maximum NEPM HILs permitted for open area use but would have exceeded the levels for residential use with soil access if it had still been surface soil. Of note is the high level of Pb found in the bottom of the sediment core for Site 5 which exceeded both the maximum NEPM HILs permitted for open area use and residential use with soil access. Chariton, Maher and Roach (2011) sampled sediment from Cockle Bay which is the inlet area where Cockle Creek flows into Lake Macquarie, close to Site 5 of our study. The high results obtained in our study may have two explanations. Sampling in the 2011 study may have occurred further into the lake where the sediment from the creek may have been deposited over a greater area and so was thinner at any one point, thus providing a lower concentration per kg of sediment. Secondly, the sediment core collected was to a depth of 50 cm and does not appear to have been mixed prior to analysis which could potentially result in only the top of the core being tested. With the expected rate of deposition into lake Macquarie being between 1 to 7 mm per year (Hollins et al. 2011), the sediments tested may have been deposited after the smelter closed. Sediment deposition rate explains the higher concentration of Pb and Zn in the bottom half of almost all of the sediment cores across Sites 2, 3, 4 and 5. Riparian vegetation reduced at each site which would explain the reduction in sediment with the progression of the creek towards Lake Macquarie. It is likely that the bottom half of the sediment cores represent deposition from over 25 years ago (Hollins et al. 2011), prior to a reduction in contaminants
  • 14. released by the smelter. As the top half of the sediment cores contained lower levels of Pb and Zn it would appear that less contaminated sediments have entered Cockle Creek in the past 25 years. Conclusion Our results are consistent with previous studies and with what would be expected eleven years after the smelter ceased operation. While Pb levels are in excess of the NEPL HILs for open space in the bottom half of the sediment core from Site 5, it is unlikely that the Pb is bioaccessible unless the deep creek sediments are dredged or the creek develops an acidic environment. However, without any further addition of contaminants and or disturbance of the creekbed, Cockle Creek can be considered environmentally safe and stable after 106 years of contamination.
  • 15. Appendix A Table 1. Site specific information for sampling of sediments from Cockle Creek, NSW. Site 1 (control site) The Weir Rd Bridge, Barnsley Site 2 Northern end of Racecourse Rd, Teralba Site 3 Raceourse Rd, Teralba Site 4 Creek Reserve Road, Boolaroo Site 5 Speers Point Park at junction of Cockle Creek and Lake Macquarie GPS Coordinates 32o56’7” 151o35’44” 32o58’38” 151o32’27” 32o57’11” 151o37’1” 32o57’11” 151o37’1” 32o58’1” 151o36’48” Distance from bank 200 cm 100 cm 150 cm 200 cm 250 cm Water flow rate Slow Medium Medium Medium Medium Depth of sample 25 cm 25 cm 25 cm 50 cm 50 cm Sample colour Black Black Black Black Black Sample texture Clayey fine gravel Fine clay Fine clay Fine silty clay with some pebbles Sandy with large pebbles Sample odour Strong sulfur Sulfurous and oily Slightly sulfurous Slightly sulfurous None Riparian vegetation Thick vegetation of river ash, she oaks and sedges Mangroves, grasses and reeds approx 2 metres thick along creek bank Mangroves, she oaks, reeds and grasses approx 2 metres thick along creek bank Mangroves, reeds and grasses approx 2 metres thick along creek bank Grass Features of site Inside curve of eastern bank Near railway line Close to Lucky’s Scrap Metals Across from the Five Islands Inner edge of peninsula
  • 16. Appendix B Fig 1. X-ray fluorescence analysis of the bottom of the sediment core from Site 1. Fig 2. X-ray fluorescence analysis of the top of the sediment core from Site 1.
  • 17. Fig 3. X-ray fluorescence analysis of the bottom of the sediment core from Site 2. Fig 4. X-ray fluorescence analysis of the top of the sediment core from Site 2.
  • 18. Fig 5. X-ray fluorescence analysis of the bottom of the sediment core from Site 3. . Fig 6. X-ray fluorescence analysis of the top of the sediment core from Site 3.
  • 19. Fig 7. X-ray fluorescence analysis of the bottom of the sediment core from Site 4. Fig 8. X-ray fluorescence analysis of the top of the sediment core from Site 4.
  • 20. Fig 9. X-ray fluorescence analysis of the bottom of the sediment core from Site 5. Fig 10. X-ray fluorescence analysis of the top of the sediment core from Site 5.
  • 21. Appendix C Table 1. Absorbancies obtained by ICP analysis with conversion to mg/Kg Sample Zn absorb Pb absorb Zn conc mg/100 mL Pb conc mg/100 mL Soil wght (gm) Zn mg/Kg Pb mg/Kg 1B 671027 6626.24 64.53294 5.33819 11.204 575.9813 47.64539 1T 871699 11304.4 85.51935 8.803237 11.5106 742.9617 76.47939 2B 887375 34780.5 87.15875 26.19165 11.0551 788.4031 236.9192 2T 692406 15637.9 66.76877 12.013 10.8507 615.3407 110.7117 3B 505610 11987.6 47.23353 9.309273 11.864 398.1248 78.46657 3T 150163 2535.2 10.06066 2.308014 10.0911 99.69832 22.87178 4B 906097 28974.4 89.11671 21.89116 10.3231 863.2747 212.0599 4T 968724 52697 95.66628 39.46215 11.271 848.7826 350.1211 5B 940183 133190 92.68145 99.08218 11.68 793.5055 848.3063 5T 765444 89942 74.40713 67.049 11.7544 633.0151 570.4162
  • 22. Appendix D Table 1. Health Investigation values in mg kg-1 for soil from NEPM 2013 Substance Health Investigation Levels values in mg kg-1 A B C D Arsenic2 100 500 300 3 000 Beryllium 60 90 90 500 Boron 4500 40 000 20 000 300 000 Cadmium 20 150 90 900 Chromium (VI) 100 500 300 3600 Cobalt 100 600 300 4000 Copper 6000 30 000 17 000 240 000 Lead3 300 1200 600 1 500 Manganese 3800 14 000 19 000 60 000 Mercury (inorganic)5 40 120 80 730 Methyl mercury4 10 30 13 180 Nickel 400 1200 1200 6 000 Selenium 200 1400 700 10 000 Zinc 7400 60 000 30 000 400 000 Cyanide (free) 250 300 240 1 500 A Residential use with garden/accessible soil B Residential with minimal opportunities for soil access C Parks, recreational open space and playing fields D Commercial/industrial use (Australian Government ComLaw 2013)
  • 23. References Agency for Toxic Substances and Disease Registry (2014) Lead. Available at: http://www.atsdr.cdc.gov/toxprofiles/tp13-c6.pdf (accessed 20 July 2014). Alloway BJ, Ayres DC (1997) Chemical Principles of Environmental Pollution. Blackie Academic & Professional Publishers (Melbourne) Australian Government ComLaw (2013). Schedule B1: National Environment Protection (Assessment of Site Contamination) Measure 1999 (as amended). http://www.comlaw.gov.au/Details/F2013C00288/Html/Volume_2 (accessed 6 November 2014). Australian Government Department of the Environment (2014) Lead Alert. Available at: http://www.environment.gov.au/resource/lead-alert-facts-lead-house-paint (accessed on 20 July 2014). Australian Government Geoscience (2014) Australian Mines Atlas - Lead Factsheet. Available at: http://www.australianminesatlas.gov.au/education/fact_sheets/lead.html (accessed 20 July 2014). Chariton AA, Maher WA, Roach AC (2011) Recolonisation of translocated metal- contaminated sediments by estuaring macrobenthic assemblages. Exotoxicology 20, 706-718. doi: 10.1007/s10646-011-0612-6 Department of Human Services (1997). National Environmental Health Forum Monographs - Metal Series No. 2. http://www.health.vic.gov.au/archive/archive2014/nphp/enhealth/council/pubs/pdf/zinc. pdf (accessed 9 November 2014). Department of Primary Industries NSW (2000). Understanding Soil pH. http://www.dpi.nsw.gov.au/__data/assets/pdf_file/0003/167187/soil-ph.pdf (accessed 9 November 2014). Former Standing Council on Environment and Water (2014) ASC NEPM Toolbox. Available at: http://www.scew.gov.au/node/941(accessed 20 July 2014). Google Maps (2014). Cockle Creek. https://www.google.com.au/maps/@- 32.9422728,151.6124086,14z (accessed 1 November 2014). Harmaza YM, Slobozhanina (2014). Zinc essentiality and toxicity. Biophysical aspects. Biophysics 59(2), 264-275. doi: 10.1134/S0006350914020092 Hildebrandt A, Lacorte S & Barcelo D (2006). Sampling of water, soil and sediment to trace organic pollutants at a river-basin scale. Analytical and Bioanalytical Chemistry 386, 1075-1088. doi:10.1007/s00216-006-0486-2
  • 24. Hollins SE, Harrison JJ, Jones BG, Zawadzki A, Heijinis H & Hankin S (2011). Reconstructing recent sedimentation in two urbanised coastal lagoons (NSW, Australia) using radioisotopes and geochemistry. Journal of Paleolimnology 46, 579- 596. doi: 10.1007/s10933-011-9555-4 Hoyle B (2005) Sediment Contamination. UXL Encyclopedia of Water Science 3, 438-442. Available at: http://go.galegroup.com.ezproxy.une.edu.au/ps/i.do?action=interpret&id=GALE%7CC X3437400119&v=2.1&u=dixson&it=r&p=GVRL&sw=w&authCount=1 (accessed 20 July 2014). Kim KR, Owens G, Naidu R (2009). Heavy metal distribution, bioaccessibility and phytoavailability in long-term contaminated soils from Lake Macquarie, Australia. Australian Journal of Soil Research 47, 166-176. Available at: http://go.galegroup.com/ps/i.do?id=GALE% (accessed 20 July 2014). NSW Department of Public Works and Services (2002) Feasibility Study Environmental Improvements/Management of Cockle Bay. Available at: http://www.livinglakemacquarie.org/files/dwnlds/archives/dnarch02/Cockle- May2002.pdf (accessed 20 July 2014). NSW Health Department (1991) Taking Childhood Lead Poisoning. Public Health Bulletin 2, 98-99. Available at: http://www.publish.csiro.au/?act=view_file&file_id=NB91044.pdf (accessed 20 July 2014). Pasminco (2014) Lead Abatement Strategy. Available at: http://www.pasminco.com.au/index.php/pasminco-cockle-creek/history (accessed 20 July 2014). Reichman SM (2002). The Responses of Plants to Metal Toxicity: A review focusing on Copper, Manganese and Zinc. Australian Minerals & Energy Environment Foundation. http://plantstress.com/Articles/toxicity_i/Metal_toxicity.pdf (accessed 9 November 2014). Willmore A, Sladden T, Bates L, Dalton CB (2006) Use of a geographic information system to track smelter-related lead exposures in children: North Lake Macquarie, Australia, 1991–2002. International Journal of Health Geographics 5, 1-14. doi: doi:10.1186/1476-072X-5-30 WorkCover Authority of NSW (2013) Personal protective equipment. Available at: http://www.workcover.nsw.gov.au/newlegislation2012/general-risk- management/Pages/personal-protective-equipment.aspx (accessed 20 July 2014).