2. 140 R.R. Large et al. / Earth and Planetary Science Letters 428 (2015) 139–150
amount of trace metals available (Huerta-Diaz and Morse, 1992;
Gregory et al., 2014). These results indicate that for a constant
amount of pyrite in the shales (commonly between 1 and 4 wt%;
Rickard, 2012), the TE content in sedimentary pyrite is propor-
tional, in a first order sense, to their concentration in seawater
(Large et al., 2014; Swanner et al., 2014). This concept has been
tested for a suite of TE in sedimentary pyrite from the present day
Cariaco Basin on the Venezuela shelf by Large et al. (2014). They
show that the TE concentrations in pyrite correlate positively with
the composition of mean global ocean water, and that TE concen-
trations in sedimentary pyrite are 5–8 orders of magnitude higher
than in coeval seawater. The mean Au concentration in sedimen-
tary pyrite from the Cariaco Basin (313 ppb, Table S3) relative to a
mean Au concentration in the present day deep oceans (0.02 ppt;
http://www.mbari.org/chemsensor/summary.html) yields a concen-
tration factor of about 107
for Au in sedimentary pyrite compared
to coeval seawater. Thus by analyzing the Au content of sedimen-
tary pyrite at any given time through Earth history, it is possible to
indicate first order trends in seawater concentration through time.
However, it should be noted that different depositional areas will
have different chemical conditions and the 107
value should not
be taken as an absolute concentration factor of Au in sedimentary
pyrite globally and at all points in time throughout Earth’s history.
2.2. Effects of diagenesis and metamorphism on sedimentary pyrite
textures and Au concentration
In the proof of concept paper, Large et al. (2014) demon-
strated that processes during early diagenesis do not substantially
change the mean first order TE content of sedimentary pyrite.
However, late diagenetic and medium to high grade metamorphic
processes that cause recrystallization of pyrite and conversion to
pyrrhotite, may be accompanied by major changes in many TE
concentrations, including Au, Ag, Te and Hg (Pitcairn et al., 2006;
Large et al., 2007). In this study we have analyzed early-formed
syngenetic and early diagenetic pyrite in order to evaluate the
variation in seawater TE concentrations. Pyrites with a framboidal
texture or clusters of micro-crystals (Fig. 1A, B) were the preferred
textural type as these are considered to form either in the water
column in euxinic environments, or in the top few centimeters of
muds in anoxic environments (Wilkin et al., 1996). If these two
styles were unavailable for analysis, then patches or nodules of
porous or inclusion-rich pyrite (Fig. 1C–E), with little evidence of
recrystallization, were chosen for analysis. Clearly recrystallized eu-
hedral crystals or euhedral rims overgrowing porous pyrite cores
(Fig. 1D–F) were avoided, as previous studies have demonstrated
that recrystallized sedimentary pyrite (late diagenetic or metamor-
phic) is typically inclusion poor and has a lower Au and other TE
content than framboidal and porous pyrite types in the same sam-
ple.
2.3. Variability of Au in the modern ocean
An assumption we make here is that the first order Au content
of the past oceans has been globally homogeneous at any given
time interval. Very little data are available to validate this assump-
tion. Recent research suggests an average open ocean mean for the
north Pacific of 0.03 ppt with a range from 0.01 to 0.06 ppt (Koide
et al., 1988). These data show little difference between the deep
and shallow ocean, although coastal seawater shows a marginally
elevated mean of 0.04 ppt. The difference between filtered and
unfiltered seawater concentrations was found to be within analyt-
ical error, indicating that most of the Au is in solution or as nano
particles. Falkner and Edmond (1990) compared Au ocean profiles
from the North Atlantic and North Pacific and found little differ-
ence with a range of 0.01 to 0.03 ppt for both profiles. However a
third profile in the Mediterranean showed Au enriched by a factor
of two in the deep waters, compared with the open ocean, reach-
ing a maximum of 0.04 ppt Au.
The residence time of Au in the oceans is estimated at around
1000 yrs (Falkner and Edmond, 1990), which is less than most
other redox sensitive TE (e.g. Mo 760,000 yrs; As 39,000 yrs; Se
26,000 yrs; Cu 5000 yrs), but more than others; Co (340 yrs), Hg
(350 yrs) and Te (100 yrs). Since the Au residence time is the
same order as the mixing time of the ocean, then a reasonably
homogeneous distribution of Au throughout the open ocean may
be expected. However higher Au concentrations of up to an order
of magnitude have been measured in seawater close to continental
margins and source river systems, compared to open ocean values
(Nekrasov, 1996).
2.4. Forms of Au in oceans and rivers
Although Au is assumed to be present predominantly as dis-
solved complex ions in hydrothermal ore forming fluids (Seward,
1989), it may be present in seawater as a mixture of dissolved
complexes, colloids, nano-particles, aqueous clusters, absorbed
onto detrital clays and as Au–organic complexes. Past research has
focused on the chloride complexes of Au, AuCl−
4 and AuCl−
2 , as the
dominant species in the open ocean (e.g., Krauskopf, 1951), but
recent thermodynamic considerations and measurements indicate
that AuOH(H2O) is the stable species in the modern oxygenated
ocean (Vlassopoulos and Wood, 1990). In river systems Au is more
likely carried as suspended particles and in the colloidal state
(Nekrasov, 1996). Luther III and Rickard (2005) highlight the signif-
icance of aqueous clusters of metal sulfides and argue they form a
major fraction of the metal load in the modern oceans and rivers.
For example, Canadian rivers have reported Au concentrations
from 2 to 4700 ppt, compared with open ocean concentrations
at around 0.02 ppt (Falkner and Edmond, 1990). Rivers draining
Au mining provinces have the highest Au concentrations. Chibisov
(1964) reports average values of 10 ppt Au in the Kolyma River,
draining the Shrednekansky Au district, Russian Far East, and es-
timated a discharge rate of 4 tons of Au per year into the ocean.
In this case the Au was transported as suspended particles ≤20
to 30 μm in size, much of which is deposited on the river delta
and adjacent shelf (Chibisov, 1964). The observation that a signif-
icant Au flux from rivers draining mineral districts is carried as
particulate rather than dissolved Au, means that a significant por-
tion of Au input to the ocean is likely deposited on continental
shelves and marginal basins, with only the colloidal and dissolved
Au extending into the open ocean. Therefore, since the black shales
sampled in this study are principally from continental margin
basins, the Au concentration in sedimentary pyrites is likely to be
higher than in pyrite formed in deep ocean sediments. This sug-
gests that our estimates of Au content of the paleo-oceans may be
up to an order of magnitude higher than the open ocean values.
However, this effect may be partially offset by factors that reduce
our measured Au concentrations in sedimentary pyrite. These in-
clude the effect of diagenesis and metamorphism, which both are
shown to reduce the measured Au content of pyrite by up to an
order of magnitude or more (Large et al., 2007).
2.5. Au contribution from seafloor hydrothermal vents
Previous studies have concluded that the TE flux from rivers is
the dominant source of elements in the ocean; however a small
number of elements, in particular Mn, Fe, Li and Rb may have a
significant or even dominant contribution from hydrothermal vents
(Elderfield and Schultz, 1996). The metal flux from seafloor hy-
drothermal vents is poorly understood, and whether hydrothermal
3. R.R. Large et al. / Earth and Planetary Science Letters 428 (2015) 139–150 141
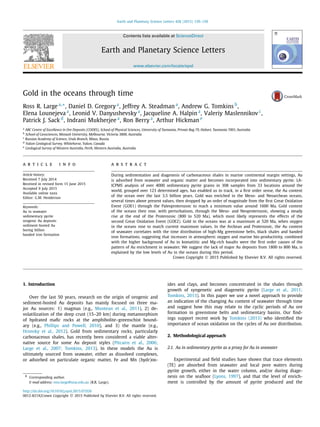
Fig. 1. Various textural forms of sedimentary pyrite. A) Three large framboidal pyrites (70 μm) and fine pyrite microcrystals in an organic-rich matrix, typical of syngenetic
and early diagenetic pyrite. Aravalli Group, Rajasthan, India (∼1700 Ma), B) Aggregates of pyrite microcrystals and small euhedral pyrites (<20 μm) of early diagenetic origin,
from Skillogalee Dolomite, South Australia (790 Ma), C) Early diagenetic nodule of pyrite composed of pyrite microcrystals intergrown with matrix clays. Blake River Group,
Abitibi, Canada (∼2690 Ma), D) compacted early inclusion-rich diagenetic pyrite nodule with late diagenetic or early metamorphic overgrowth of inclusion-poor euhedral
pyrites, from Roberts Mountain Formation, Nevada (420 Ma), E) Aggregates of fine microcrystals, same as (B), but partially overgrown by large euhedral metamorphic pyrites,
from Skillogalee Dolomite, South Australia (790 Ma), F) Euhedral late diagenetic or metamorphic pyrites with a core of inclusion-rich early diagenetic pyrite from Khomolkho
Formation, Siberia (600 Ma). The black circles are laser pits from the LA-ICPMS analysis.
activity is a net source or net sink for particular elements is un-
resolved (Von Damm, 2010). This is particularly the case for Au
where very little data are available. Measurements of vent fluids
at the 21◦N site on the East Pacific Rise (Falkner and Edmond,
1990) returned values of 7 ppt and 50 ppt Au for two different
samples. These authors estimated that seafloor hydrothermal vent
fluids maybe enriched up to 1000 times with respect to normal
seawater. More recent workers report values of 50 to 1400 ppt in
vent fluids from various black smoker systems (e.g., Hannington et
al., 2005). In modern and ancient seafloor massive sulfide deposits
formed at vent sites, Au is commonly concentrated in the sulfides
(particularly pyrite), and varies from 0.02 to 28 ppm Au with a
mean massive sulfide grade of around 1 ppm Au (Hannington et
al., 2005). The hydrothermal plumes emanating from the black and
grey smoker vents carry sulfide particles (1 to 100 μm), and the
smallest of these (<10 μm) are quickly oxidized under current
ocean conditions, whereas the larger particles fall out into met-
alliferous ferruginous sediments at distances of 40 to 80 m from
the vent (e.g., Bogdanov et al., 2006). Yucel et al. (2011) estimate
that nanoparticles of pyrite make up to 10% of the filterable iron
discharged by vent fluids. Plume particles of colloform pyrite, chal-
copyrite and marcasite may carry minor Au and contribute to the
ferruginous sediments which have been measured at sites along
the Mid-Atlantic Ridge to contain 8 to 20 ppt Au (Cherkashev,
1992). The strong affinity of Au for sulfides (e.g., Reich et al., 2005),
and the relatively high Au content of vent field sulfide deposits,
4. 142 R.R. Large et al. / Earth and Planetary Science Letters 428 (2015) 139–150
suggests that most Au is probably precipitated in and around the
vent sites and little is dispersed in the ocean. However a small
component of soluble or colloidal Au may become adsorbed onto
organic matter or taken up by bacteria (e.g., Ivanov, 1997).
2.6. Sampling and analytical methods
Laser ablation-inductively coupled plasma mass spectrometry
(LA-ICPMS) was used to analyze over 4000 individual pyrite grains
for TE concentrations in 308 samples of marine sediments col-
lected from 33 locations, grouped over 123 determined ages, dis-
tributed from the Archean (∼3515 Ma) to recent (Cariaco Basin).
Table S1 provides details of each sample.
The instrumentation involved a New Wave UP-213 Nd:YAG laser
microprobe coupled to an Agilent 7500a ICP-MS and a New Wave
UP-193ss Nd:YAG laser microprobe coupled to an Agilent 7700s
ICP-MS both housed at the University of Tasmania. Laser beam
size varied between 10 and 105 μm depending on the size of
the pyrite grains. Laser fluence was ∼2.5 J/cm2
for the UP193ss
and ∼3.5 J/cm2
for the UP213. Laser repetition rate was 5 Hz.
Each analysis involved collection of 30 s of instrument background
(laser off) to properly assess detection limits (Table S4) followed
by 40–60 s signal acquisition time in time-resolved mode. An in-
house reference material (STDGL2b2; Danyushevsky et al., 2011)
was used as the primary calibration standard for quantification
of siderophile and chalcophile elements; a USGS reference mate-
rial (GSD-1G; Jochum et al., 2005) was used as the primary cal-
ibration standard for quantification of lithophile elements, and a
natural pyrite (PPP-1; Gilbert et al., 2014) was used for quantifi-
cation of sulfur. Reference materials were analyzed, each twice,
consequently, every 1–1.5 h during analytical sessions to correct
for instrumental drift and perform quantification using standard
methods (Longerich et al., 1996). Factors contributing to preci-
sion of LA-ICPMS analyses are described in detail in Gilbert et al.
(2013). For this study, the main component is the heterogeneity of
Au distribution within the analyzed volume. In general, the total
uncertainty of individual analyses varied between 20 to 50%, which
is insignificant given the overall range of concentrations between
repeat analyses within the same sample. The analytical method we
developed involves subtraction of the silicate matrix from the raw
data to determine the composition of pyrite (Large et al., 2014).
The Au concentration was measured on early-formed pyrites, such
as framboids, disseminated single grains, and nodule cores. Five to
twelve LA-ICPMS spot analyses were performed on each 2 cm shale
fragment, for every individual sample.
3. Results
The 4006 individual pyrite analyses for Au, As, Ag, Se, Mo and
Te are given in Table S2, mean data for fixed ages are in Ta-
ble S3 and detection limits in Table S4. Gold concentrations were
above the detection limits (0.001–0.2 ppm, Table S4) in 2620 pyrite
grains varying from 0.001 to 9.90 ppm Au with an arithmetic mean
of 0.26 ppm and geometric mean of 0.09 ppm (Fig. 2, Table 1). This
database is an extension of that presented in Large et al. (2014)
and Gregory et al. (2015b). Using the 107
concentration factor esti-
mated above, the first order measured Au variation in sedimentary
pyrite equates to variations in seawater Au concentration through
time of <10−3
ppt to around 0.4 ppt with a geometric mean of
0.009 ppt Au, which is about one third of the modern ocean value.
The pyrite TE data obtained in this study is not normally dis-
tributed in a statistical sense, rather it has an approximate log–
normal distribution (see Supplementary Information, Fig. S1). As
a result the arithmetic mean and standard deviation have little
meaning for our data set. Instead we prefer to present the geo-
Table1
StatisticalanalysisofAuconcentrationinsedimentarypyriteatdifferenttimeperiodsinearthshistory,withaT-testmeasureofstatisticalsignificance.
Minage
(Ma)
Maxage
(Ma)
nlogAuStddev
logAu
Geometric
meanAu
(ppm)
Multiplicative
stddev
Onestddev
belowgeometric
mean
Onestddev
abovegeometric
mean
ResultsofT-testwhenbothsampleshavethesamevariance
Mean
logAu
Variance
logAu
CounttstattcritResult
0665−1.150.760.0605.710.010.34−1.220.575
0.431.97Maybesame
66250266−1.690.660.0814.580.020.37−1.090.43266
2.11.96Statisticallydifferent
2505401316−2.360.600.1953.990.050.78−1.170.361316
0.721.96Maybesame
540900115−1.520.430.0602.690.020.16−1.220.18115
9.271.97Statisticallydifferent
9001400140−0.670.460.2022.920.070.59−0.70.22140
14.21.97Statisticallydifferent
14002000106−2.110.500.0273.170.010.08−1.580.25106
5.411.98Statisticallydifferent
2000250026−2.070.540.1063.440.030.37−0.970.2926
1.251.98Maybesame
25002800340−1.920.540.1463.440.040.50−0.840.29340
13.71.96Statisticallydifferent
28003200169−2.040.500.6933.190.222.21−0.150.25169
15.71.97Statisticallydifferent
32003600137−2.010.500.0863.160.030.27−1.060.25137
Notes:1.T-testassumesnormallydistributeddata.Thereforethesampledatahasbeenlogtransformedsothatitisapproximatelynormalinitsdistribution.2.OriginalreportsonTtestareonworkSheetl(Supplementary
Information).
5. R.R. Large et al. / Earth and Planetary Science Letters 428 (2015) 139–150 143
Fig. 2. A) Histogram of LA-ICPMS Au content in sedimentary pyrite from black shales
ranging in age from 3515 to present. The Au concentration shows a log–normal
relationship. B) Au–Te relationship in sedimentary pyrite.
metric mean and multiplicative standard deviation, which better
describes data with log–normal distributions (Limpert et al., 2001).
3.1. Variability of Au in sedimentary pyrite from individual samples and
sedimentary formations
The Au concentration in sedimentary pyrite from four drill
holes through black shale formations of differing ages from
Archean to Triassic have been measured in detail to determine
Au variability both within individual samples and across multiple
samples through different black shale formations. Two of the drill
hole datasets are discussed below (Fig. 3) and the other two in the
Supplementary Information (Fig. S2). It is clear from the figures
that some individual samples show considerable Au variability;
however, taken as a whole, the variability is consistent within each
sedimentary formation. The high standard deviation of LA-ICPMS
Au analyses in sedimentary pyrite from a single sample is likely
due to a number of factors: 1) irregular distribution of Au in the
structure of pyrite (e.g., Deditius et al., 2011), 2) presence of dis-
crete Au particles in pyrite, commonly when the mean content of
Au is above 10 ppm (e.g., Reich et al., 2005), 3) the analytical er-
rors associated with the LA-ICPMS technique (Danyushevsky et al.,
2011), and 4) variable recrystallization of sedimentary pyrite re-
Fig. 3. Downhole variation in Au content of sedimentary pyrite in two separate black
shale sequences. A) DDH RI08-24 Selwyn Basin, Yukon, B) DDH ABDP9 Hamersley
Basin, WA (data from Gregory et al., 2015a). Each data point represents a separate
LA-ICP-MS Au analysis of pyrite. The red lines are the range of one standard de-
viation from the mean. Black lines join the geometric means of each sample. Two
more drill hole Au profiles are given and discussed in the Supplementary Informa-
tion (Fig. S2). (For interpretation of the references to color in this figure legend, the
reader is referred to the web version of this article.)
6. 144 R.R. Large et al. / Earth and Planetary Science Letters 428 (2015) 139–150
lated to diagenesis and low grade metamorphism, which causes
release of Au to the fluid phase (Large et al., 2007).
Drill hole RI08, in the Richardson Mountains, Selwyn Basin,
Yukon, intersects Middle Devonian black shales of the Imperial
and underlying Canol Formations (Fig. 3A; Supplementary Infor-
mation Table S1). The complete pyrite dataset in this drill hole has
a geometric mean pyrite Au value of 69 ppb with a multiplicative
standard deviation of 2.2. The Canol Formation in the lower sec-
tion of the hole (below 400 m) has pyrite with a geometric mean
Au content of 62 ppb and a multiplicative standard deviation of
2.8. The overlying Imperial Formation contains pyrite with a ge-
ometric mean of 71 ppb and a multiplicative standard deviation
of 2.0. Although the sedimentary formation Au means are similar,
the stratigraphic trends in individual sample means are reasonably
distinct (Fig. 3A). For example the up-hole decreasing gold trend
towards the contact between that Canol and Imperial Formations
is clear, as is the general up-hole increase in gold, through the Im-
perial Formation.
The second drill hole section (Fig. 3B) is from Neoarchean black
shales in the Hamersley Basin of the Pilbara region in Western
Australia. Drill hole ABDP9 intersects a sequence of Neoarchean
(2580 to 2500 Ma) carbonaceous shales and sandstones of the
Hamersley Group, below the Brockman Iron Formation (Anbar et
al., 2007; Gregory et al., 2015a). The sedimentary pyrite analyzed
in this sequence has a geometric mean of 176 ppb Au with a
multiplicative standard deviation of 2.9. There is a clear trend
of upwardly increasing Au in pyrite in the lower section of the
stratigraphy (geometric mean of 50 to 550 ppb) from the top of
the Paraburdoo Member to upper Bee Gorge Member, followed by
a declining trend through to the Mt McRae Shale (geometric mean
of 560 to 30 ppb).
3.2. Global concentration–time curves for Au
The full set of LA-ICPMS data for Au in sedimentary pyrite from
global black shales over the past 3.5 billion years is shown in
Fig. 4A (analytical data are presented in Table S2). The number of
samples, pyrite analyses, geometric means and standard deviations,
for each plotted time interval are given in Table S3. In Fig. 4A each
data point is a separate pyrite analysis and the geometric mean of
pyrites of a particular age are superimposed and joined by a con-
tinuous line. This method of presentation was chosen as it shows
all data points, the variability of the data for each plotted inter-
val and the geometric mean value for each interval. A comparison
of plotted Au trends using arithmetic means, geometric means and
medians for each time interval demonstrates very little difference
(Fig. 4E).
In developing our pyrite database and the ocean-Au time curve
we have attempted to acquire an even distribution of samples
through the Precambrian, with a target of at least one black shale
formation sampled every 200 million years. However, this has not
yet been achieved, with sample gaps from 3400 to 3000, from
2500 to 2200 and from 1250 to 1000 Ma. Notwithstanding these
gaps, there are significant first order trends in the time series curve
for Au. Peak Au concentrations are recorded in the Archean at
around 3000, 2700 and 2550 Ma where geometric mean values
exceed 400 ppb Au in pyrite. The elevated Au in the Archean is
followed by a generally decreasing first order trend through the
Paleoproterozoic to reach a minimum of less than 10 ppb around
1640 Ma (Fig. 4A). Between 1640 and 980 Ma the Au concen-
tration in sedimentary pyrite gradually rises to a peak around
600 ppb, then falls abruptly until ca. 800 Ma. Through the Cryoge-
nian and Ediacaran (850–540 Ma; Fig. 4A), Au concentration rises
again to reach a maximum of over 1000 ppb in the early Phanero-
zoic (520 Ma). Gold in sedimentary pyrite through the Phanerozoic
seems to be cyclical and different to the patterns in the Archean
and Proterozoic, though this maybe partly due to the higher num-
ber of analyses. In general terms (Fig. 4A), Au geometric mean val-
ues decline from Cambrian toward present-day values, but in detail
the pattern is more complex (Supplementary Information, Fig. S3).
Geometric mean Au concentrations and standard deviations for the
broad time intervals outlined above are presented in Table 1, to
show that the trends in the Fig. 4A gold time series have a statis-
tical basis. Application of the t-test to our database demonstrates
that gold concentrations in pyrite in the time intervals 66–250,
540–900, 900–1400, 1400–2000, 2800–3200 and 3200–3600 Ma
are statistically different at the 95% confidence level from the pre-
ceding intervals. This confirms that the trends of high levels of gold
in the Archean, generally low levels in the Proterozoic, returning
to high levels in the Early Phanerozoic are statistically meaningful.
The geometric means and temporal trends of Te, Sb and Ag in
sedimentary pyrite are compared with Au in Table S3 and Fig. 4.
These three elements are chosen as they have the highest Spear-
man correlation coefficients with Au (Table 2) – Au:Te (0.67), Au:Sb
(0.62) and Au:Ag (0.53) – out of the 14 TE measured by LA-ICP-MS
(Large et al., 2014). Selenium, Cu and Bi have positive correlation
coefficients between 0.4 and 0.5, whereas all other TE have corre-
lation coefficients less than 0.4 (Table 2). The temporal trends in
Au, Te, Sb and Ag for the Precambrian (Fig. 4) are somewhat simi-
lar. Tellurium and Sb, like Au, are generally elevated in the Meso-
and Neoarchean oceans, and drop through the Paleoproterozoic to
reach a minimum in the early Mesoproterozoic, rising again, but
reaching a second minimum in the early Neoproterozoic. Signifi-
cant temporal trends in Ag (Fig. 4D) are not so clear, and there
appears to be little difference between the Archean and Protero-
zoic values of Ag in sedimentary pyrite. In very general terms, Sb
and Ag like Au drop by about an order of magnitude through the
Phanerozoic (Fig. 4 and Supplementary Information Fig. S3).
4. Discussion
4.1. Effect of pyrite content of shales on Au concentration in
sedimentary pyrite
Recent research by Gregory et al. (2015a) has demonstrated
that high levels of sedimentary pyrite in black shales leads to a
decrease in the Au content of individual pyrite grains compared to
adjacent samples containing less pyrite. This effect is demonstrated
in Fig. S4 (Supplementary Information) where samples from two
drill holes RB2 and ABDP9 (Fig. 3) are compared. Although there
are insufficient data to be confident of the trends, there is a gen-
eral decrease in the mean Au concentration in pyrite with increas-
ing pyrite content in samples from both drill hole datasets. For
the Archean shales in drill hole ABDP9 there is a marked drop
in Au concentration of pyrite, when pyrite content exceeds 4 wt%
(2 wt% S). For the Permian/Triassic black shales the drop in Au
content occurs at about 20 wt% pyrite (10 wt% S). The reason
for the decrease is likely to be related to a limiting amount of
Au in seawater, such that pyrites in pyrite-rich sediments (greater
than 4–20 wt% pyrite), are limited by the available Au that can
be taken up during their growth. We have avoided this issue as
much as possible by selecting shales for analysis with less than 5
wt% pyrite; however, this is not always achievable due to the very
fine grained nature of pyrite in some samples, and thus approxi-
mately 10% of our sample set has exceeded the 5 wt% limit, based
on microscopic studies and available bulk S analyses. A plot of
the temporal Au curve (Supplementary information, Fig. S5) when
the top 10% of pyrite-rich sediments (above estimated 5 wt% py)
have been removed from our dataset, indicates very similar trends
compared to the curve using the full dataset. In particular the Au
enrichment in the Archean, as well as the minima in the Late Pale-
oproterozoic and Neoproterozoic, are still clearly evident (Fig. S5).
7. R.R. Large et al. / Earth and Planetary Science Letters 428 (2015) 139–150 145
Fig. 4. Temporal trends in A) Au, B) Te, C) Sb and D) Ag in sedimentary pyrite. Each small dot is an LA-ICP-MS pyrite analysis. Red dots are the geometric means for each
time interval. E) Comparison of arithmetic mean, geometric mean and median for Au concentration at each time interval.
Table 2
Spearman correlation coefficients between Au and other trace elements in sedimentary pyrite, n = 2620.
Au Te Sb Ag Se Cu Bi As Ni Cd Co Pb Tl Zn
1 0.67 0.62 0.53 0.45 0.44 0.43 0.39 0.36 0.26 0.19 0.19 0.18 0.16
8. 146 R.R. Large et al. / Earth and Planetary Science Letters 428 (2015) 139–150
On this basis we are confident that the first order trends in Au
through time shown in Fig. 4A are not significantly affected by the
variation in pyrite content of individual samples
4.2. Local versus global patterns
An important issue to test for our pyrite dataset is whether
the measured Au content of sedimentary pyrite of a particular
age, and by inference the Au concentration in the ocean at that
time, is simply a measure of a local concentration related to lo-
cal sources, or a measure of a homogeneous global ocean value
at a particular time. Two factors suggest we may be measuring
local concentrations. Firstly Au is considered to have a relatively
short ocean residence time compared to most other redox sen-
sitive TE, estimated at around 1000 years (Falkner and Edmond,
1990), and thus mixing and homogenization of Au throughout the
global ocean may not be readily achieved. Secondly, our samples
are from continental margin basins where seawater Au concen-
trations are likely to be variable and affected by local sources.
However, a close look at our dataset may suggest otherwise. The
best test of a global ocean measure, is if pyrite in samples from
widely geographically dispersed basins, which formed at around
the same time, return Au concentrations that are similar. About
50% of our samples are from Australia, and although supercon-
tinent reconstructions need to be considered, we have sufficient
samples from other continental plates to be able to test the local
versus global issue. In the Archean, our samples are from West-
ern Australia and South Africa. Two samples of geologically very
similar ages from the Hamersley Basin, Mt McRae Shale (2504 Ma)
Pilbara Craton and the Transvaal Basin, Upper Nauga Formation,
N2 Member (2521 Ma), Kaapvaal Craton, give geometric mean Au
in pyrite values of 50 ppb and 86 ppb, respectively. However, it
has been argued that the super-craton Vaalbara, may have linked
the Kaapvaal and Pilbara cratons in the Neoarchean (e.g., Smirnov
et al., 2013). In the mid Proterozoic where our Au time curve
shows an all time minimum, samples from central Australia in the
McArthur Basin, Barney Creek Formation (1640 Ma), gave mean
values of 8 ppb, compared with 13 ppb from pyrite in the Satka
Formation (1550 Ma), Southern Urals, Russia. In the Mesoprotero-
zoic, where our Au curve (Fig. 4A) shows a rise out of the trough at
1600 Ma, two samples from different global locations show similar
Au values in pyrite; Western USA, Belt Basin, Newland Formation
(1470 Ma) and Northern Australia, McArthur Basin, Velkerri Forma-
tion (1360 Ma), returned means of 25 and 72 ppm Au. Close to the
Meso–Neoproterozoic boundary Au reaches a high with samples
from Central Australia, Lillian Formation (1040 Ma) and South-
ern China, Meidang Formation (980 Ma) having means of 160 ppb
and 580 ppb Au respectively. The final comparison is a series of
samples near the Neoproterozoic–Cambrian boundary where Au
and other TE in pyrite rise again. Sample locations are Southern
China, Doushantuo Formation (550 Ma) mean 146 ppb Au; West-
ern Tasmania, Togari Group, Salmon River Siltstone (540 Ma) mean
87 ppb Au; Central Asia, East Tuva, Tumattaigiskaya black shale
(540 Ma) mean 134 ppb Au. However two further examples show
significantly different Au concentrations in similarly aged samples;
1) north Western Australia, Jeerinah Shale (2660 Ma) mean 35 ppb
Au compared with central Western Australia, Early Black Flag Beds
(2680 Ma) mean 288 ppb Au, and 2) Tasmania, Benjamin Lime-
stone (450 Ma) mean 38 ppb compared with Scotland, Moffat
Shale (444 Ma) mean 220 ppb Au in pyrite. Not withstanding these
two exceptions, the marked similarity in mean Au values for most
examples of globally diverse samples, at distinct time intervals, and
at critical parts of the time series Au curve, is good evidence that
sedimentary pyrite is preserving a first order global ocean Au sig-
nal.
4.3. Source controls on Au concentration in seawater
The first order controls on the mean global Au content of sea-
water, over the 10–100 million-year time spans considered here,
are likely to be: 1) the Au content of continental source rocks
being eroded and supplying Au to the oceans; 2) the ratio of dis-
solved Au to particulate and absorbed Au in seawater; 3) the Au
concentration of seafloor hydrothermal vent fluids and their activ-
ity through time; 4) the oxygen concentration of the atmosphere,
which effects rates of oxidative erosion releasing Au from conti-
nental source sulfides; 5) chemical conditions in the ocean that
control the solubility of Au complexes (e.g. pH, Eh, temperature,
salinity, oxygenation, temperature, etc.); and 6) bio-productivity in
the oceans that controls pyrite-forming sulfate reduction, draw-
down of Au onto pyrite and organic matter and sedimentation in
carbonaceous muds on the seafloor. Some of these source con-
trols have been already discussed and others are considered be-
low.
The primary source of most TE in seawater is continental ero-
sion, whereby elements are transported in dissolved form, col-
loidal form and as suspended particles via river systems, or as
wind blown dust, to the ocean (e.g., Falkner and Edmond, 1990;
Elderfield and Schultz, 1996). Thus the variation in the composi-
tion and Au content of exposed rocks during Earth’s history should
have a primary control on Au content of the oceans. Most crustal
rock types average less than 2 ppm Au (Pitcairn, 2011), with the
exception of carbonaceous black shales, komatiites, back arc basin
basalts, some S-undersaturated continental flood basalts, and lay-
ered intrusions, all of which contain up to 50 ppb Au (Keays and
Scott, 1976; Pitcairn, 2011). In addition to crustal rocks, some
widely dispersed ore deposit types may also provide a local source
of Au from erosion. Under the reduced ferruginous conditions of
the Archean ocean, hydrothermal vents may have dispersed more
Au into the ocean, compared with the modern situation. Active
venting between periods of submarine volcanism on the Archean
mafic volcanic dominated seafloor environment would release Au
as the soluble Au(HS)−
2 complex into an anoxic ocean and thus
likely maintain a relatively high level of dissolved Au in seawater
around the vents.
The time period of maximum Au in sedimentary pyrite
(>500 ppb) between 3000 and 2500 Ma, coincides with the age
of abundant komatiitic volcanics (Fig. 5A, B), development of mid-
to upper crustal orogenic Au deposits, and seafloor black smoker
massive sulfide deposits. The general decrease in Au content of
seawater through the Neoarchean and Paleoproterozoic, followed
by a rise in the Mesoproterozoic, matches the peaks and troughs
in the distribution of greenstone belts through this period (Fig. 5B).
Tholeiites (or high Mg-basalts), which are common in greenstones
in the Proterozoic, may also contain a high background of Au and
thus are a potential source rock, in addition to komatiites. From
1800 to 1200 Ma, komatiites are virtually non existent (Fig. 5B),
and the Au content of the ocean appears to have dropped substan-
tially. This period of low Au in sedimentary pyrite (<50 ppb) in
the late Paleoproterozoic and Mesoproterozoic overlaps the period
termed the “Boring Billion” when very few Au deposits formed
(Fig. 5D). This also corresponds with a time when the Sr and C
isotopes of seawater were fairly constant indicating a balance be-
tween continental and mantle sources (Condie, 2005) and a period
of low tectonic activity and continental erosion. This suggests a
decreased supply of Au to the oceans, with drawdown of Au into
seafloor muds exceeding supply to the oceans.
4.4. Relationship of Au in seawater to Au ore deposits
The similarity in the peaks and troughs of our interpreted time
series curve for Au concentration in seawater (Fig. 5A) and the
9. R.R. Large et al. / Earth and Planetary Science Letters 428 (2015) 139–150 147
Fig. 5. Temporal trends in key parameters related to Au content of seawater. (A) Variation of Au content in sedimentary pyrite. Each small dot represents a pyrite analysis.
(B) Distribution of greenstone belts and komatiites (after Condie, 1994; Isley and Abbott, 1999; modified from Bradley, 2011). (C) Distribution of banded iron formations
(Bekker et al., 2010). (D) Distribution of host rocks for sediment- and greenstone-hosted Au deposits (confined to deposits with >200 tonnes Au).
age of host rocks to sediment-hosted and orogenic Au deposits
(Fig. 5D) suggests a common factor. The high levels of Au in sea-
water in the Meso- and Neoarchean corresponds with the greatest
periods of Au ore formation in sedimentary basins and greenstone
belts. The low period of Au in seawater in the mid Proterozoic cor-
responds with a period of virtually no Au deposits, and the return
to high Au in seawater in the Paleozoic matches the second great
period of sediment-hosted Au ore deposits (Fig. 5A, D). There are
two possible interpretations for this coincidence: 1) the high Au
in the oceans is due to the erosion of the newly formed major Au
districts, or 2) the high Au in the oceans is the ultimate source
of Au in the time related deposits. It is tempting to conclude that
the first explanation is the most likely as it is simple and elegant.
However there are several other factors that suggest both interpre-
tations need consideration.
Fig. 5 compares the age of the Au deposit host rocks rather than
the age of Au mineralization; in many cases these ages are close
together, but in other cases they are not. For example, black shale
samples in this study from the period 2900–3000 Ma come from
the lower stratigraphy of the Witwatersrand Basin, South Africa.
This includes samples of marine pyrites from the Promise, Corona-
tion and Reitkuil Formations in the West Rand Group (Guy et al.,
2010; Table S1). These samples have some of the highest gold in
marine pyrite measured in this study (mean of 790 ppb Au), how-
ever they occur in shales stratigraphically well below the major
gold reefs in the basin. Consequently erosion of the gold deposits
could not have led to the high gold in these sedimentary pyrite
samples. A second example are marine pyrites in black shales
from the Late Ordovician Castlemaine Group in Central Victoria.
The anomalous gold measured in these pyrites has been demon-
strated by Thomas et al. (2011) to be of early diagenetic age
(∼490 Ma; Table S1), well before the timing of gold mineraliza-
tion in the Victorian Goldfields, dated in two events at 445 Ma
and 380–370 Ma (Phillips et al., 2012). A third example is from
the Carlin District in the Great Basin in Nevada. Our sedimentary
pyrites in this locality are from the Popovich and Roberts Moun-
tain Formations ranging in age from 420 to 390 Ma (Table S1).
However the main gold mineralization in this district is of Tertiary
age, dated at 42 to 36 Ma (Cline et al., 2005). In all three cases it
is impossible for the gold in marine pyrite to be formed by ero-
sion of the local gold deposits, as in each case, the gold deposits
are significantly younger than the gold enrichment in the marine
pyrites.
In summary, although the authors favor the second hypothesis,
that the high Au in the oceans is the ultimate source of Au in the
time related deposits, it is most likely that both processes have
acted to enrich gold in the oceans in a cyclical manner.
10. 148 R.R. Large et al. / Earth and Planetary Science Letters 428 (2015) 139–150
4.5. Relationship of Au in seawater to atmosphere and ocean
oxygenation
Thermodynamic modeling (Vlassopoulos and Wood, 1990;
Rickard and Luther III, 2006) suggests that dissolved Au in nat-
ural Archean waters was predominantly as the Au(HS)−
2 species,
whereas in the more oxygenated Phanerozoic ocean the most sta-
ble species was Au(OH)(H2O). In near shore environments and
proximal to volcanic activity, particulate gold may have been a
significant component. The deep oceans in the Archean were
likely dominated by ferruginous waters, characterized by exten-
sive amounts of dissolved Fe2+ (Holland, 1984; Canfield et al.,
2008). Aqueous sulfide species are not stable in ferruginous wa-
ters because pyrite forms upon interaction between these compo-
nents (Planavsky et al., 2011). Therefore, since aqueous Au-chloride
species are only stable at moderately oxidized and extremely acidic
conditions, and Au-hydroxide is insoluble at the reduced condi-
tions required for ferruginous waters (Vlassopoulos and Wood,
1990), the deep oceans away from hydrothermal vent sites are
unlikely to have contained significant dissolved Au during the
Archean. However, several lines of evidence suggest that episodic
oxygenation of the Archean atmosphere may have commenced
during the period 3.2–2.5 Ga prior to the GOE1 (e.g. Anbar et al.,
2007; Large et al., 2014; Gregory et al., 2015a). These oxygenation
pulses may have been short lived, but appear to have been of suf-
ficient duration to effect chemical processes in the oceans. Where
parts of the shallow to middle levels of the Archean oceans under-
went periods of oxidation, the reduced aqueous iron species were
oxidized to generate banded iron formations (BIF), which stripped
the ocean of dissolved Fe2+, creating the conditions necessary
for persistence of aqueous sulfide species. Thus, there were likely
some shallow to middle level ocean domains, particularly in conti-
nental margin basins, where Au was concentrated as the Au(HS)−
2
species during the Archean. This is the likely scenario in the Wit-
watersrand Basin, South Africa, which hosts the greatest accumula-
tion of known Au at a time (2900–3000 Ma) when a significant rise
in atmosphere oxygen has been speculated based on Cr isotopes
and pyrite chemistry in equivalent aged strata (Crowe et al., 2013;
Large et al., 2014). Partial oxygenation of relatively shallow con-
tinental marginal basins would have made ideal conditions for a
change from ferruginous to sulfidic bottom waters and trapping
of Au in organic- and pyrite-rich muds, before reworking along
ancient shorelines to develop the highly Au enriched conglomer-
ate reefs of the Witwatersrand (Large et al., 2013). The Hamersley
Basin, Western Australia, is another example, at 2700–2500 Ma,
where Au shows a gradual increase in pyrite in the Bee Gorge
member of Wittenoom Formation shales (Fig. 3B) associated with
pulses or whiffs of atmosphere oxidation (Anbar et al., 2007;
Gregory et al., 2015a) and deposition of associated BIF.
The pulses of atmosphere oxygenation may also have led to
increased oxidative erosion of Au enriched komatiites, and gold-
bearing sulfide mineralization, resulting in increased levels of dis-
solved Au contributed to the oceans, thus maintaining Au sup-
ply through the late Archean. GOE1 established minor sulfate in
the near-surface regions of the oceans (H2S was the dominant S
species in the deep oceans; Planavsky et al., 2011). If these upper
reaches of the oceans were only mildly oxidized, as might be ex-
pected given that the atmosphere is considered to have contained
<1% O2 after GOE1 (Canfield, 2005), the dominant oxidation state
may well have been within the window of minimum Au solubil-
ity (the red outline at 4 in Fig. 6). This suggestion is consistent
with our data showing a significant drop in the Au concentrations
in black shale pyrite at this time. This time also corresponds to a
drop in the abundance of komatiitic volcanism (Fig. 5B).
Bekker and Holland (2012) suggest that following the GOE1,
atmosphere oxygen reached a peak around 2300–2100 Ma be-
Fig. 6. Stability of Au and aqueous Au complexes in seawater at 25 ◦C as a function
of redox potential (pE) and pH (modified from Vlassopoulos and Wood, 1990). The
numbered points refer to specific sections in the text. Archean ferruginous waters
were likely approximately at the position of point 1, though with salinities up to
twice as high as the present ocean value (Knauth, 2005). The modern ocean varies
from surface waters, which have high reduction potential (i.e., high potential to be
reduced), to localized domains at point 2, where redox is controlled by sulfate re-
duction. The red outline highlights an island of solid Au stability within the range
of ocean chemistry.
fore dropping to a constant background Proterozoic level. Based
on Cr isotopes in BIF, Frei et al. (2009) argue for a rise in atmo-
sphere O2 at 1840 Ma. which coincides with another episode of
BIF and minor Au deposits between 1900 and 1800 Ma (Fig. 5C).
Then followed roughly a billion years with no significant BIF or Au
deposits, when oxygen levels in the ocean remained below that
required for the saturation of Fe(OH)3, and ferruginous to sulfidic
conditions prevailed in the deep oceans for most of the period
(e.g., Canfield et al., 2008; Planavsky et al., 2011). Our data in-
dicate that Au build-up in the oceans did not occur again until
around 1000 Ma, which was followed by renewed BIF sedimenta-
tion and Au ore formation from 750 to 520 Ma, when oxygen in
the atmosphere–ocean system had begun to rise again (Fig. 5).
During the second Great Oxidation Event (GOE2) at the end
of the Neoproterozoic, sulfate became stable in the deep ocean
(Canfield et al., 2008). Under these significantly more oxidized
conditions, Au was likely present in the ocean as the more solu-
ble Au(OH)(H2O) species (Vlassopoulos and Wood, 1990). Our data
(Fig. 4A) show a gradual rise in Au in sedimentary pyrite by about
two orders of magnitude over the period 800 to 520 Ma. The peak
in gold concentration of over 1000 ppb, at 520 Ma, corresponds
with the first time oxygen levels in the oceans are considered to
have reached the equivalent of modern levels (Chen et al., 2015).
5. Conclusions
Here we suggest, based on the composition of sedimentary
pyrite in marine black shales, that the Au content of syngenetic
to diagenetic pyrite is a good proxy for the Au content of sea-
water through time. Analysis of over 4000 sedimentary pyrites
indicates that the Archean ocean was relatively enriched in Au
compared to present day seawater, but decreased progressively
through the Paleoproterozoic, with a rise and then fall through
11. R.R. Large et al. / Earth and Planetary Science Letters 428 (2015) 139–150 149
the Mesoproterozoic to the mid-Neoproterozoic. In the late Neo-
proterozoic, Au content of the oceans rose in steps parallel with
the rise in atmosphere–ocean oxygenation to be at a maximum
in the early Cambrian around 520 Ma. The global coincidence
in temporal trends in the Precambrian between Au in seawater
and BIF deposition suggests that variations in oxygenation of the
atmosphere–ocean system was the driver for the variation in Au
content of seawater. Our favored model is that Au in the oceans
was principally sourced from erosion of continental rocks and their
associated gold mineral provinces. The oceanic gold was deposited
with organic matter and trapped in syngenetic and diagenetic
pyrite in seafloor continental-margin organic-bearing muds. These
muds, when lithified, likely became the Au-enriched source rocks
for sediment-hosted Au deposits, which formed during basin in-
version some 10’s to 100’s of million years after sedimentation.
Finally, the lack of Au deposits during the boring billion (1800 to
800 Ma) may be explained by low levels of Au in the oceans, lead-
ing to the deposition of Au-poor black shale source rocks.
Acknowledgements
We wish to acknowledge colleagues who have supplied sam-
ples for this study: S Johnson, C. Makoundi, T. Lyons, P. McAurick,
S. Bull, P. Haines, C. Calver, B. Guy, R. Scott, R. Coveney Jr., J. Abbott,
D. Huston, A. Lambeck, R. Batchelor, S. Smith, M. Krupenin, J. Shar-
rock, P. Sorjonen-Ward, L. Leonova, V. Murzin, K. Ivanov, R. Stein,
J. Slack, K. Kelley V. Lisenko and S. Karpov. Thanks to the core li-
brary staff of the Geological Survey of Western Australia (GSWA)
who kindly assisted in our sampling from drill core. Thanks also to
David Cooke, David Rickard and an anonymous EPSL reviewer for
their comments that helped to improve the manuscript. A. Hick-
man publishes with permission of the Executive Director, GSWA.
Funding was provided by an ARC Centre of Excellence grant to RRL
and ARC Discovery Grant DP150102578 to RRL, JAH and LVD.
Appendix A. Supplementary material
Supplementary material related to this article can be found on-
line at http://dx.doi.org/10.1016/j.epsl.2015.07.026.
References
Anbar, A.D., Duan, Y., Lyons, T.W., Arnold, G.L., Kendall, B., Creaser, R.A., Kaufman,
A.J., Gordon, G.W., Scott, C., Garvin, J., Buick, R., 2007. A whiff of oxygen before
the great oxidation event? Science 317, 1903–1906.
Bekker, A., Holland, H.D., 2012. Oxygen overshoot and recovery during the early
Paleoproterozoic. Earth Planet. Sci. Lett. 317–318, 295–304.
Bekker, A., Slack, J.F., Planavsky, N., Krapež, B., Hofmann, A., Konhauser, K.O., Rouxel,
O.J., 2010. Iron formation: the sedimentary product of a complex interplay
among mantle, tectonic, oceanic, and biospheric processes. Econ. Geol. 105,
467–508.
Bogdanov, Y.A., Lisitsin, A.P., Sagalevich, A.M., Gurvich, E.A., 2006. Hydrothermal Ore
Genesis in Ocean Floor. Nauka, Moscow, 527 pp. (in Russian).
Bradley, D.C., 2011. Secular trends in the geologic record and the supercontinent
cycle. Earth-Sci. Rev. 108, 16–33.
Canfield, D.E., 2005. The early history of atmospheric oxygen: homage to Robert M.
Garrels. Annu. Rev. Earth Planet. Sci. 33, 1–36.
Canfield, D.E., Poulton, S.W., Knol, A.H., Narbonne, G.M., Ross, G., Goldberg, T.,
Strauss, H., 2008. Ferruginous conditions dominated later Neoproterozoic deep-
water chemistry. Science 321, 949–952.
Chen, X., et al., 2015. Rise to modern levels of ocean oxygenation coincide with
the Cambrian radiation of animals. Nat. Commun. 6, 7142. http://dx.doi.org/
10.1038/ncomms8142(2015).
Cherkashev, G.A., 1992. Geochemistry of metalliferous sediments from areas of ore
formation in the ocean. In: Gramberg, I.S., Ainemer, A.I. (Eds.), Hydrothermal
Sulfide Ores and Metalliferous Sediments of the Ocean. Nedra, St. Petersburg,
pp. 138–152 (in Russian).
Chibisov, N.A., 1964. Gold migration in the waters of the drainage system of
Kolyma–Indgirka region. In: Geology and Economic Minerals of Yakutsk Au-
tonomous Soviet Socialist Republic, vol. 6, pp. 112–128 (in Russian).
Cline, J.S., Hofstra, A., Munteau, J., Tosdal, D., Hickey, K., 2005. Carlin-type gold
deposits in Nevada: critical geologic characteristics and viable models. In: Eco-
nomic Geology 100th Anniversary Volume, pp. 451–484.
Condie, K.C., 1994. Greenstones through time. In: Condie, K.C. (Ed.), Archean Crustal
Evolution – Developments in Precambrian Geology. Elsevier Science, Amster-
dam, pp. 85–120, chap. 3.
Condie, K.C., 2005. Earth as an Evolving Planetary System. Elsevier, Amsterdam,
p. 574.
Crowe, S.A., Døssing, L.N., Beukes, N.J., Bau, M., Kruger, S.J., Frei, R., Canfield, D.E.,
2013. Atmospheric oxygenation three billion years ago. Nature 501, 535–538.
Danyushevsky, L., Robinson, P., Gilbert, S., Norman, M., Large, R., McGoldrick, P., Shel-
ley, M., 2011. Routine quantitative multi-element analysis of sulphide minerals
by laser ablation ICP-MS: standard development and consideration of matrix ef-
fects. Geochem., Explor. Environ. Anal. 11, 51–60.
Deditius, A.P., Utsunomiya, S., Reich, M., Kesler, S.E., Ewing, R.C., Hough, R., Walshe,
J., 2011. Trace metal nanoparticles in pyrite. Ore Geol. Rev. 42, 32–46.
Elderfield, H., Schultz, A., 1996. Mid-ocean ridge hydrothermal fluxes and the chem-
ical composition of the ocean. Annu. Rev. Earth Planet. Sci. 24, 191–224.
Falkner, K.K., Edmond, J.M., 1990. Gold in seawater. Earth Planet. Sci. Lett. 98,
208–221.
Frei, R., Gaucher, C., Poulton, S.W., Canfield, D.E., 2009. Fluctuations in Precambrian
atmospheric oxygenation recorded by chromium isotopes. Nature 461, 250–253.
Gilbert, S., Danyushevsky, L., Robinson, P., Wohlgemuth-Ueberwasser, C., Pearson, N.,
Savard, D., Norman, M., Hanley, J., 2013. A comparative study of five reference
materials and the Lombard meteorite for the determination of the platinum-
group elements and gold by LA-ICP-MS. Geostand. Geoanal. Res. 37, 51–64.
Gilbert, S.E., Danyushevsky, L.V., Rodemann, T., Shimizu, N., Gurenko, A., Meffre, S.,
Thomas, H., Large, R.R., Death, D., 2014. Optimisation of laser parameters for
the analysis of sulphur isotopes in sulphide minerals by laser ablation ICP-MS.
J. Anal. At. Spectrom. 29, 1042–1051.
Gregory, D., Meffre, S., Large, R., 2014. Comparison of metal enrichment in pyrite
framboids from a metal-enriched and metal-poor Estuary. Am. Mineral. 99,
633–644.
Gregory, D.D., Large, R.R., Halpin, J.A., Steadman, J.A., Hickman, A.H., Ireland, T.R.,
Holden, P., 2015a. The chemical conditions of the late Archean Hamersley basin
inferred from whole rock and pyrite geochemistry with 33
S and δ34
S isotope
analyses. Geochim. Cosmochim. Acta 149, 223–250.
Gregory, D.D., Large, R.R., Halpin, J.A., Lounejeva Baturina, E., Lyons, T.W., Wu, S.,
Sack, P.J., Chappaz, A., Maslennikov, V.V., Bull, S.W., Danyushevsky, L., 2015b.
Trace element content of sedimentary pyrite in black shales. Econ. Geol. 110,
1389–1410.
Guy, B.M., Beukes, N.J., Gutzmer, J., 2010. Paleoenvironmental controls on the texture
and chemical composition of pyrite from non-conglomeratic sedimentary rocks
of the Mesoarchean Witwatersrand Supergroup, South Africa. S. Afr. J. Geol. 113,
195–228.
Hannington, M.D., de Ronde, C.D., Petersen, S., 2005. Sea-floor tectonics and subma-
rine hydrothermal systems. In: Economic Geology 100th Anniversary Volume,
pp. 111–141.
Holland, H.D., 1984. The Chemical Evolution of the Atmosphere and Oceans. Prince-
ton University Press, Princeton, N.J., 282 pp.
Hronsky, J.M.A., Groves, D.I., Loucks, R.R., Begg, G.C., 2012. A unified model for gold
mineralisation in accretionary orogens and implications for regional-scale ex-
ploration targeting methods. Miner. Depos. 47, 339–358.
Huerta-Diaz, M.A., Morse, J.W., 1992. Pyritization of trace metals in anoxic marine
sediments. Geochim. Cosmochim. Acta 56, 2681–2702.
Isley, A.E., Abbott, D.H., 1999. Plume-related mafic volcanism and the deposition of
banded iron formation. J. Geophys. Res. B, Solid Earth Planets 104, 15461–15477.
Ivanov, V.V., 1997. Ecological Geochemistry. Ecology, Moscow, 576 pp.
Jochum, K.P., Willbold, M., Raczek, I., Stoll, B., Herwig, K., 2005. Chemical char-
acterisation of the USGS reference glasses GSA-1G, GSC-1G, GSD-1G, GSE-1G,
BCR-2G, BHVO-2G and BIR-1G using EPMA, ID-TIMS, ID-ICP-MS and LA-ICP-MS.
Geostand. Geoanal. Res. 29, 285–302.
Keays, R.R., Scott, R.B., 1976. Precious metals in ocean-ridge basalts; implications for
basalts as source rocks for gold mineralization. Econ. Geol. 71, 705–720.
Knauth, L.P., 2005. Temperature and salinity history of the Precambrian ocean: im-
plications for the course of microbial evolution. Palaeogeogr. Palaeoclimatol.
Palaeoecol. 219, 53–69.
Koide, M., Hodge, V., Goldberg, E.D., Bertine, K., 1988. Gold in seawater: a conserva-
tive view. Appl. Geochem. 3, 237–241.
Krauskopf, K.B., 1951. The solubility of gold. Econ. Geol. 46, 858–870.
Large, R.R., Bull, S.W., Maslennikov, V.V., 2011. A carbonaceous sedimentary source-
rock model for Carlin-type and orogenic gold deposits. Econ. Geol. 106,
331–358.
Large, R.R., Halpin, J.A., Danyushevsky, L.V., Maslennikov, V.V., Bull, S.W., Long, J.A.,
Gregory, D.D., Lounejeva, E., Lyons, T.W., Sack, P.J., McGoldrick, P.J., Calver, C.R.,
2014. Trace element content of sedimentary pyrite as a new proxy for deep-
time ocean–atmosphere evolution. Earth Planet. Sci. Lett. 389, 209–220.
Large, R.R., Maslennikov, V.V., Robert, F., Danyushevsky, L.V., Chang, Z., 2007. Mul-
tistage sedimentary and metamorphic origin of pyrite and gold in the Giant
Sukhoi Log deposit, Lena Gold Province, Russia. Econ. Geol. 102, 1233–1267.
12. 150 R.R. Large et al. / Earth and Planetary Science Letters 428 (2015) 139–150
Large, R.R., Meffre, S., Burnett, R., Guy, B., Bull, S., Gilbert, S., Goemann, K., Danyu-
shevsky, L., 2013. Evidence for an intrabasinal source and multiple concentration
processes in the formation of the carbon leader reef, Witwatersrand Supergroup,
South Africa. Econ. Geol. 108, 1215–1241.
Limpert, E., Stahel, W.A., Abbt, M., 2001. Log-normal distributions across the sci-
ences: keys and clues. Bioscience 51, 341–352.
Longerich, H.P., Jackson, S.E., Günther, D., 1996. Laser ablation inductively coupled
plasma–mass spectrometric transient signal data acquisition and analyte con-
centration calculation. J. Anal. At. Spectrom. 11, 899–904.
Luther III, G.W., Rickard, D.T., 2005. Metal sulfide cluster complexes and their bio-
geochemical importance in the environment. J. Nanopart. Res. 7, 389–407.
Lyons, T.W., 1997. Sulfur isotopic trends and pathways of iron sulfide formation
in upper Holocene sediments of the anoxic black sea. Geochim. Cosmochim.
Acta 61, 3367–3382.
Muntean, J.L., Cline, J.S., Simon, A.C., Longo, A.A., 2011. Magmatic-hydrothermal ori-
gin of Nevada’s Carlin-type gold deposits. Nat. Geosci. 4, 122–127.
Nekrasov, I.Y., 1996. Geochemistry, Mineralogy and Genesis of Gold Deposits. Nauka,
Moscow, 344 pp.
Phillips, D., Fu, D., Wilson, C.J.L., Kendrick, M.A., Fairmaid, A.M., Miller, J.MCL., 2012.
Timing of gold mineralisation in the western Lachlan Orogen, SE Australia:
a critical overview. Aust. J. Earth Sci. 59, 495–525.
Phillips, G.N., Powell, R., 2010. Formation of gold deposits: a metamorphic de-
volatilization model. J. Metamorph. Geol. 28, 689–718.
Pitcairn, I.K., 2011. Background concentration of gold in different rock types. Appl.
Earth Sci. 120, 31–38.
Pitcairn, I.K., Teagle, D.A.H., Craw, D., Olivo, G.R., Kerrich, R., Brewer, T.S., 2006.
Sources of metals and fluids in orogenic gold deposits: insights from the Otago
and Alpine schists, New Zealand. Econ. Geol. 101, 1525–1546.
Planavsky, N.J., McGoldrick, P., Scott, C.T., Li, C., Reinhard, C.T., Kelly, A.E., Chu, X.,
Bekker, A., Love, G.D., Lyons, T.W., 2011. Widespread iron-rich conditions in the
mid-Proterozoic ocean. Nature 477, 448–451.
Reich, M., Kesler, S.E., Utsunomiya, S., Palenik, C.S., Chryssoulis, S.L., Ewing, R.C.,
2005. Solubility of gold in arsenian pyrite. Geochim. Cosmochim. Acta 69,
2781–2796.
Rickard, A., Luther III, G.W., 2006. Metal sulfide complexes and clusters. In: Vaughan,
D.J. (Ed.), Sulfide Mineralogy and Geochemistry. Reviews in Mineralogy, vol. 61,
pp. 421–504.
Rickard, D., 2012. Sulfidic sediments and sedimentary Rocks. In: Van Loon, A.J. (Ed.),
Developments in Sedimentology. Elsevier, p. 801.
Seward, T., 1989. The hydrothermal chemistry of gold and its implications for ore
formation: boiling and conductive cooling as examples. Econ. Geol. Monogr. 6,
394–404.
Smirnov, A.V., Evans, D.A.D., Ernst, R.E., Söderlund, U., Li, Z.-X., 2013. Trading part-
ners: tectonic ancestry of southern Africa and western Australia, in Archean
supercratons Vaalbara and Zimgarn. Precambrian Res. 224, 11–22.
Swanner, E.D., Planavsky, N.J., Lalonde, S.V., Robbins, L.J., Bekker, A., Rouxel, O.J.,
Saito, M.A., Kappler, A., Mojzsis, S.J., Konhauser, K.O., 2014. Cobalt and marine
redox evolution. Earth Planet. Sci. Lett. 390, 253–263.
Thomas, H.V., Large, R.R., Bull, S.W., Maslennikov, V., Berry, R.F., Fraser, R., Froud,
S., Moye, R., 2011. Pyrite and pyrrhotite textures and composition in sediments,
laminated quartz veins, and reefs at Bendigo gold mine, Australia: insights for
ore genesis. Econ. Geol. 106, 1–31.
Tomkins, A.G., 2013. A biogeochemical influence on the secular distribution of oro-
genic gold. Econ. Geol. 108, 193–197.
Vlassopoulos, D., Wood, S.A., 1990. Gold speciation in natural waters: I. Solubil-
ity and hydrolysis reactions of gold in aqueous solution. Geochim. Cosmochim.
Acta 54, 3–12.
Von Damm, K.L., 2010. Hydrothermal vent fluids, chemistry of. In: Steele, J.H.,
Thorpe, S.A., Turekian, K.K. (Eds.), Marine Chemistry and Geochemistry:
A Derivative of Encyclopedia of Ocean Sciences, 2nd edition. Elsevier/Academic
Press, Amsterdam, pp. 81–88.
Wilkin, R.T., Barnes, H.L., Brantley, S.L., 1996. The size distribution of framboidal
pyrite in modern sediments: an indicator of redox conditions. Geochim. Cos-
mochim. Acta 60, 3897–3912.
Yucel, M., Gartman, A., Chan, C.S., Luther III, G.W., 2011. Hydrothermal vents as a ki-
netically stable source of iron-sulphide-bearing nanoparticles to the ocean. Nat.
Geosci. 4, 367–371.