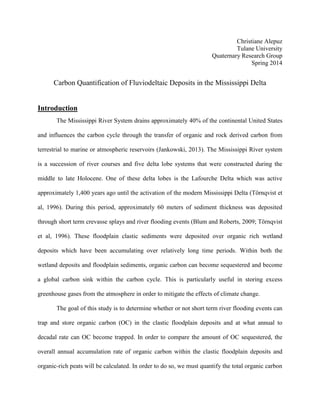
1. Christiane Alepuz
Tulane University
Quaternary Research Group
Spring 2014
Carbon Quantification of Fluviodeltaic Deposits in the Mississippi Delta
Introduction
The Mississippi River System drains approximately 40% of the continental United States
and influences the carbon cycle through the transfer of organic and rock derived carbon from
terrestrial to marine or atmospheric reservoirs (Jankowski, 2013). The Mississippi River system
is a succession of river courses and five delta lobe systems that were constructed during the
middle to late Holocene. One of these delta lobes is the Lafourche Delta which was active
approximately 1,400 years ago until the activation of the modern Mississippi Delta (Törnqvist et
al, 1996). During this period, approximately 60 meters of sediment thickness was deposited
through short term crevasse splays and river flooding events (Blum and Roberts, 2009; Törnqvist
et al, 1996). These floodplain clastic sediments were deposited over organic rich wetland
deposits which have been accumulating over relatively long time periods. Within both the
wetland deposits and floodplain sediments, organic carbon can become sequestered and become
a global carbon sink within the carbon cycle. This is particularly useful in storing excess
greenhouse gases from the atmosphere in order to mitigate the effects of climate change.
The goal of this study is to determine whether or not short term river flooding events can
trap and store organic carbon (OC) in the clastic floodplain deposits and at what annual to
decadal rate can OC become trapped. In order to compare the amount of OC sequestered, the
overall annual accumulation rate of organic carbon within the clastic floodplain deposits and
organic-rich peats will be calculated. In order to do so, we must quantify the total organic carbon
2. (TOC), sediment bulk density (BD), and the chronology and accretion rate of the clastic and
organic sediments. This study utilized two techniques to measure TOC- elemental analysis (EA)
and loss on ignition (LOI). Afterwards, we will be able to compare how much OC can clastic
floodplains sequester in comparison to the organic-rich peats.
In order to better understand the TOC, we will compare the %C with the sediment
texture. By doing so, we can see how the TOC varies within organic-poor clastic sediments
versus organic-rich humic clays and peats. In order to utilize LOI, a conversion factor is
necessary to find the actual TOC. In this study, we hypothesize that a mathematical relationship
exists between LOI and EA to determine a suitable conversion factor.
Accumulation Rate
In order to determine the rate of OC sequestration on annual to decadal timescales
through the Holocene, total organic carbon (TOC), sediment bulk density (BD), and the
chronology and accretion rate of the clastic and organic sediments were utilized. The
accumulation rate is calculated by using the equation:
Organic carbon accumulation = Rsed × %TOC × ρbulk
where Rsed is the accumulation rate of sediments, ρbulk is the bulk density of sediments, and
%TOC is the total organic carbon which is determined from the EA values. Therefore, we will be
able to quantify how much organic carbon clastic floodplains sequester in comparison to
organic-rich wetland peats.
Field Area and Methods
3. The cores used in this study were
taken from two sites within Bayou
Lafourche, LA. A total of three cores were
taken, two from near Napoleonville, LA
(cores Napoleonville II and Napoleonville
IV) and one near Paincourtville, LA (core
Paincourtville I). Figure 1 shows the core
site locations that are represented by the
white circles. The cores contain both the
floodplain and the underlying wetland
deposits. The three cores were described in
10 cm increments in the field based
primarily based on color, USDA texture classification, and organic matter. The section below
will further describe the methods for TOC, BD, and the chronology and accretion rate.
Total Organic Carbon (TOC)
Total organic carbon measures the percent of carbon (%C) within a sample. In order to
measure the %TOC, two measurement methods were utilized- loss on ignition (LOI) and
elemental analysis (EA):
Loss on Ignition (LOI)
Loss on Ignition is an indirect method for measuring total organic carbon by measuring
the mass loss when organic matter is combusted. First, the percent LOI (%LOI) measurements
are experimentally determined; then, with the use of an experimentally or theoretically derived
Figure 1: Study Area Map. Core locations are indicated by white circles.
4. conversion factor, %LOI can be converted to %C. In order to do %LOI, each sample was placed
in a cleaned and dried crucible and heated overnight at 105°C to remove water. Then, the
samples were weighed and returned to the oven to be burned at 550°C for three hours in order to
remove organic matter. The process utilizes the resultant mass difference between the dried and
burned samples to calculate the %LOI, indicative of OC content in the sample (Jankowski,
2013). However, part of the mass is not carbon because organic matter has other elements, such
as nitrogen; therefore, %LOI values tend to be higher than the actual amount of %C.
After determining the %LOI, a conversion factor is used to obtain the actual TOC.
Previous studies published conversion factors of 1.724, which represents a mean value of soils,
or 2.2, which characterizes Louisiana wetland sediments at shallow (less than 50cm) depths
(Allen, 1974; CPRA, 2012). However, our samples are relatively deep (greater than 50 cm);
therefore, we want to experimentally obtain a conversion factor for deeply buried floodplain and
wetland deposits. In order to determine the conversion factor, the EA and LOI values were
plotted against each other. Beforehand, my hypothesis was that the resulting linear regression
should reveal the conversion factor that allows %LOI values to be converted to TOC.
Elemental Analysis
Elemental analysis is a direct way to quantify the total organic carbon. Therefore, the EA
values were used to determine %TOC. The samples for EA were taken at 20 cm vertical
increments. The samples were first dried, crushed and homogenized, then acid-treated to remove
carbonates. Carbonate-free samples were centrifuged and then neutralized. The samples were
then dried overnight and crushed. Afterwards, 1- 1.5 grams of sample were packaged in tin
capsules for elemental analysis using a Vario MicroCube elemental analyzer with coupled
Isoprime isotope ratio monitoring mass spectrometer (Jankowski, 2013). The amount of organic
5. carbon was then quantified through a measurement of the amount of resulting CO2 that is
produced from the combustion of the sample.
Sediment Texture and % Carbon
Utilizing the sediment texture described in the field, the sediment texture for each sample
can be correlated to the depth from which the samples were taken; through this, the samples were
grouped according to texture and plotted according to %C values. Since organic rich peats and
mucks contain high values of %C, we want to see how much the amount of carbon varies within
the clastic sediment textures. A total of six clastic sediment textures were studied (from finest to
coarsest): very fine sand (vfS), sand loam (SL), silt loam (SiL), silty clay loam (SiCL), and silty
clay (SiC). Some of these sediment textures were described as humic clays- clays with more
organic matter due to humic acid, a byproduct of plant decomposition, which binds the clay
particles. Therefore, the humic clays should have higher %C values than its more clastic rich
counterparts.
Bulk Density (BD)
Mean bulk densities, ρbulk, are also needed for the clastic floodplain deposits and organic-
rich wetland deposits in order to accurately calculate the OC accumulation rate. For the wet bulk
density samples, samples were taken every 10 cm using a syringe for soil sampling, either 5 cm
or 10 cm within the core depending on the sediment type. After massing the sample, the mass
was divided by the volume of water within the syringe. For 10 cm, the corresponding volume of
water is 5.15 mL; for 5 cm, the corresponding volume of water is 2.8175 mL. Therefore, the wet
bulk density of the sediment types can be calculated.
6. Chronology (14
C and OSL)
Previous work has already determined the stratigraphic record (Fisk, 1952; Törnqvist et
al, 1996). Since the cores were taken at previously sampled sites, the stratigraphic record can be
used as a point of comparison. Initial 14
C dates were obtained through stratigraphic correlation
with peat beds reported in Törnqvist et al. (1996). For these dates, organic materials
(macrofossils or charcoal) were collected and dated by accelerated mass spectrometry (AMS).
Optically stimulated luminescence (OSL) dates organic- poor, clastic deposits. OSL
dating is used to determine the most recent burial time for quartz and/or feldspar grains through
measurement of luminescence signal (Walker, 2005). Ionizing radiation energy is naturally
absorbed into the mineral crystals over time. When exposed to light, quartz and feldspar grains
release the stored ionizing radiation energy through the emission of luminescence and are
considered ‘zeroed’. Once the grains are buried and removed from light exposure, radiation
energy is once again accumulated. Through measurement of the OSL signal produced from
releasing the accumulated radiation energy and the natural radiation dose rate for the sample site,
the date of latest burial can be calculated (Jankowski, 2013). Through this technique, the clastic
portions of our cores were dated.
In order to calculate the overall OC accumulation rate, the accretion rate of the sediments
(Rsed) is necessary. The Monte Carlo method is a means of statistical evaluation of mathematical
functions using random samples (Woller, 1996). By using the Monte Carlo approach, the
sediment accretion rate can be calculated utilizing the 14
C and OSL ages, all OSL dating and
calculations were done by Dr. Zhixiong Shen. Therefore, the existing 14
C and OSL dates can be
used to determine sediment accretion and OC accumulation rates.
Results
7. Total Organic Carbon (TOC)
A total of 156 samples were analyzed for %TOC. Figure 2 displays the stratigraphic
column, the loss on ignition data, and the %C values for each of the three cores. Organic-rich
peat layers are represented with large peaks in organic content, while clastic floodplain facies are
represented with low carbon content values. For %LOI, other compounds do not completely burn
off sometimes. As a result, the %LOI values are higher because the process does not measure
just the amount of carbon, like EA. The mean %C, from EA analysis, for both the peats and
clastics can be placed in the equation to determine the overall OC accumulation rate.
Figure 2: Plots comparing the stratigraphic column, %LOI, and % C of study cores- Napoleonville II, Paincourtville I, and
Napoleonville IV
For the determination of the conversion factor for %LOI, Figure 3 shows the graphs for
%LOI vs. %C for each core. Since it appears that the samples with %LOI above 10% and below
10% follow different trend lines. Therefore, the samples are broken up into groups with a linear
regression and an exponential regression in order to better understand the relationship. However,
8. neither ways best fit the relationship; as a result, more work needs to be done in order to
understand the conversion factor between %LOI and %C for deeply buried (greater than 50 cm)
floodplain and wetland deposits.
In order to compare the sediment texture to the %C, the six clastic sediment textures that
were studied- very fine sand, sand loam, silt loam, silty clay loam, and silty clay- are shown in
Figure 3: Graphs of %LOI vs %C for the determination of a conversion factor for each
core- Napoleonville II, Paincourtville I, and Napoleonville IV. Data is divided for less
than 10% LOI and above 10% LOI. Linear and exponential trend lines and equations
are shown for both data divisions.
9. figure 4, along with peats/mucks and humic clays. In order to see the variance of %C more
clearly, the clastics are broken up into four broader groups- very fine sand, clay, loam, and humic
clays. Additionally, peats and mucks are plotted in order to compare the %C to the clastic
textures. Figure 5 shows how the distribution of %C varies with simplified sediment textures.
From the figure, it is evident that the peats and mucks contain higher %C in comparison to the
sands, clays, and loams. However, the humic clays are comparable to the peats and mucks in
%C; and, the humic clays have double or more %C than the clastic sediment textures. Therefore,
the humic clays do contain more OC than the organic-poor clastics.
Figure 4: All sediment textures and %C for all cores.
10. Figure 5: Simplified sediment textures and %C for all cores
Bulk Density
A total of 180 samples were taken for bulk density, ρbulk. Figure 6 displays the
stratigraphic column and the bulk density data for each core. The data shows that the mean wet
bulk density value for the organic rich sediments (peat/mucks) is approximately 1.3 g/cm3
;
whereas, the clastic sediment is approximately 1.7 g/cm3
. Mean bulk densities are needed for the
clastic floodplain deposits and organic-rich wetland deposits in order to accurately calculate the
OC accumulation rate.
11. Figure 6: Stratigraphic column and bulk density plots for each core- Napoleonville II, Paincourtville I, and Napoleonville IV
Chronology
In order to calculate the sediment accretion rate, the ages of the top and bottom of each
clastic floodplain and wetland peat deposits are necessary. Both OSL and 14
C ages are utilized;
figure 7 shows the stratigraphic column, corresponding ages, and the sediment accretion rates for
each core. However, the 14C dates for Paincourtville I are questionably accurate due to issues
from the dating. Additionally, the OSL dates for Paincourtville I were taken from a past study’s
core in the same location as ours. Therefore, the sediment accretion rate, Rsed, can be inserted
into the equation to calculate the overall OC accumulation rate equation.
12. Figure 7: Stratigraphic column and sediment ages. 14C and OSL ages indicated. Depths in meters.
Discussion
To determine the overall annual accumulation rate of organic carbon (OC) within the
clastic floodplain deposits and organic-rich peats, we quantified the total organic carbon (TOC),
sediment bulk density (BD), and the chronology and accretion rate of the clastic floodplain and
organic wetland deposits. Figure 8 illustrates the stratigraphic column, OSL or 14
C ages, %TOC,
13. Rsed, and ρbulk. Therefore, by using the mean values for %TOC, ρbulk, and the accretion rate, the
overall OC accumulation rate for each location can be determined by utilizing the equation:
Organic carbon accumulation = Rsed × %TOC × ρbulk
Table 1 shows the accretion rate, the mean EA, the mean bulk density, and the overall OC
accumulation rate for peats and clastics in each core. Despite the much lower OC values in the
clastic strata compared to the peat, carbon sequestration rates in the clastic-dominated deposits
are equal to or larger than in the peat. Therefore, it is evident that OC can become sequestered
within floodplain deposits, from short-term river flooding events, more quickly than the organic-
rich deposits. However, Napoleonville IV may be incorrect due to uncertainties with the 14
C
dates.
Conclusion
By quantifying the total organic carbon (TOC), sediment bulk density (BD), and the
chronology and accretion rate of the clastic and organic sediments, we calculated the overall
organic carbon accumulation rate of floodplain and wetland deposits within the Mississippi River
Napoleonville II Accretion Rate (m/yr) Mean EA (%) Bulk Density (g/m³) OC Accumulation Rate (g C/m²/yr, EA)
Peat 0.0005 0.1571 1450000 114.5446
Clastic 0.0110 0.0067 1742000 128.3854
Clastic OC Accumulation rates are 1.121 times that of Peat OC Accumulation rates.
Paincourtville I Accretion Rate (m/yr) Mean EA (%) Bulk Density (g/m³) OC Accumulation Rate (g C/m²/yr, EA)
Peat 0.00057 0.0910 1343000 69.1935
Clastic 0.0130 0.0037 1774000 85.3294
Clastic OC Accumulation rates are 1.233 times that of Peat OC Accumulation rates.
Napoleonville IV Accretion Rate (m/yr) Mean EA (%) Bulk Density (g/m³) OC Accumulation Rate (g C/m²/yr, EA)
Peat 0.0007 0.1746 1378908.74 176.0790
Clastic 0.018 0.0275 1732474.55 859.0492
Clastic OC Accumulation rates are 4.879 times that of Peat OC Accumulation rates.
Table 1: Accretion Rate, Mean EA, Bulk Density, and OC Accumulation Rate for peat and clastic in each core- Napoleonville II, Paincourtville I, and
Napoleonville IV. Clastic OC accumulation rates compared to peat OC accumulation rates.
14. system. Because of the rapid nature of crevasse splay sedimentation, carbon is sequestered
within the clastic floodplain at a rate comparable to that of organic-rich wetlands. Therefore, it is
possible that sediment diversions that partly resume the natural overbank depositional process in
the Mississippi Delta may sequester significant amounts of OC. Therefore, these processes can
mitigate global warming by creating carbon sinks that do not add more greenhouse gases to the
atmosphere.
15. Bibliography
Allen, S. E., 1974, Chemical analysis of ecological materials: New York, Wiley, 565 p. p.
Blum, M. D., and Roberts, H. H., 2009, Drowning of the Mississippi Delta due to insufficient
sediment supply and global sea-level rise: Nature Geoscience, v. 2, p. 488-491.
CPRA, 2012, APPENDIX D‐2 WETLAND MORPHOLOGY MODEL TECHNICAL REPORT,
2012 Coastal Master Plan. http://www.coastalmasterplan.louisiana.go/2012
masterplan/final-master-plan/
Fisk, H.N., 1952, Geological Investigation of the Atchafalaya Basin and the Problem of
Mississippi River Diversion: Vicksburge, Waterways Experiment Station, 145 p.
Jankowski, K. L. (2013). Quantifying fluvially-sequestered carbon in the Mississippi delta
system and potential implications for carbon credit calculations. Research Proposal,
Department of Earth and Environmental Sciences, Tulane University.
Törnqvist, T. E., Kidder, T. R., Autin, W. J., Van der Borg, K., De Jong, A. F. M., Klerks, C. J.
W., Snijders, E. M. A., Storms, J. E. A., Van Dam, R. L., and Wiemann, M. C., 1996, A
revised chronology for Mississippi River subdeltas: Science, v. 273, p. 1693-1696.
Walker, M.J.C., 2005, Quaternary dating methods. Publisher: John Wiley & Sons, Chichester,
286 p.
Woller, J. (1996, January 1). An Introduction to Monte Carlo Methods. An Introduction to
Monte Carlo Methods. Retrieved May 10, 2014, from
http://www.chem.unl.edu/zeng/joy/mclab/mcintro.html