coca cola Reconciliation of Q3 and YTD 2006 Non-GAAP Financial Measures
1. The Company reports its financial results in accordance with generally accepted accounting principles (GAAP). However, management believes that certain non-GAAP financial measures used in managing the business may provide users of
this financial information additional meaningful comparisons between current results and results in prior operating periods. Management believes that these non-GAAP financial measures can provide additional meaningful reflection of underlying
trends of the business because they provide a comparison of historical information that excludes certain items that impact the overall comparability. Management also uses these non-GAAP financial measures in making financial, operating and
planning decisions and in evaluating the Company's performance. See the Table below for supplemental financial data and corresponding reconciliations to GAAP financial measures for the three months ended September 29, 2006 and
September 30, 2005. Non-GAAP financial measures should be viewed in addition to, and not as an alternative for, the Company’s reported results prepared in accordance with GAAP.
THE COCA-COLA COMPANY AND SUBSIDIARIES
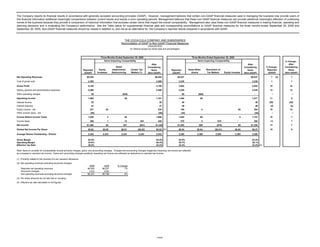
Reconciliation of GAAP to Non-GAAP Financial Measures
(UNAUDITED)
(In millions except per share data and percentages)
Three Months Ended September 29, 2006 Three Months Ended September 30, 2005
Items Impacting Comparability Items Impacting Comparability % Change -
After
After After
Asset % Change - Considering
Considering Considering
Equity Impairments/ Certain Tax Asset Write- Resolution of Reported Items
Reported Items Reported Items
Investees Restructuring Matters (1) downs Tax Matters Equity Investee (GAAP) (Non-GAAP)
(GAAP) (Non-GAAP) (GAAP) (Non-GAAP)
Net Operating Revenues $6,454 $6,454 $6,037 $6,037 7 (2) 7
Cost of goods sold 2,265 2,265 2,235 2,235 1 1
Gross Profit 4,189 4,189 3,802 3,802 10 10
Selling, general and administrative expenses 2,488 2,488 2,225 2,225 12 12
Other operating charges 39 ($39) - 85 ($85) - -- --
Operating Income 1,662 39 1,701 1,492 85 1,577 11 8
Interest income 35 35 49 49 (29) (29)
Interest expense 47 47 49 49 (4) (4)
Equity income - net 231 $3 234 195 4 $5 204 18 15
Other income (loss) - net (55) (55) (34) (34) -- --
Income Before Income Taxes 1,826 3 39 1,868 1,653 89 5 1,747 10 7
Income taxes 366 1 12 $41 420 370 4 $18 - 392 (1) 7
Net Income $1,460 $2 $27 ($41) $1,448 $1,283 $85 ($18) $5 $1,355 14 7
Diluted Net Income Per Share $0.62 $0.00 $0.01 ($0.02) $0.62 (3) $0.54 $0.04 ($0.01) $0.00 $0.57 15 9
Average Shares Outstanding - Diluted 2,343 2,343 2,343 2,343 2,343 2,385 2,385 2,385 2,385 2,385
Gross Margin 64.9% 64.9% 63.0% 63.0%
Operating Margin 25.8% 26.4% 24.7% 26.1%
Effective Tax Rate 20.0% 22.5% 22.4% 22.5% (4)
Note: Items to consider for comparability include primarily charges, gains, and accounting changes. Charges and accounting changes negatively impacting net income are reflected
as increases to reported net income. Gains and accounting changes positively impacting net income are reflected as deductions to reported net income.
(1) Primarily related to the reversal of a tax valuation allowance.
(2) Net operating revenues excluding structural changes:
2006 2005 % Change
Reported net operating revenues $6,454 $6,037 7%
Structural changes (123) (239) --
Net operating revenues excluding structural changes $6,331 $5,798 9%
(3) Per share amounts do not add due to rounding.
(4) Effective tax rate calculated on full figures.
-more-
2. The Company reports its financial results in accordance with generally accepted accounting principles (GAAP). However, management believes that certain non-GAAP financial measures used in managing the business may provide users of this financial information additional meaningful comparisons
between current results and results in prior operating periods. Management believes that these non-GAAP financial measures can provide additional meaningful reflection of underlying trends of the business because they provide a comparison of historical information that excludes certain items that
impact the overall comparability. Management also uses these non-GAAP financial measures in making financial, operating and planning decisions and in evaluating the Company's performance. See the Table below for supplemental financial data and corresponding reconciliations to GAAP financial
measures for the nine months ended September 29, 2006 and September 30, 2005. Non-GAAP financial measures should be viewed in addition to, and not as an alternative for, the Company’s reported results prepared in accordance with GAAP.
THE COCA-COLA COMPANY AND SUBSIDIARIES
Reconciliation of GAAP to Non-GAAP Financial Measures
(UNAUDITED)
(In millions except per share data and percentages)
Nine Months Ended September 29, 2006 Nine Months Ended September 30, 2005
Items Impacting Comparability Items Impacting Comparability
% Change -
Issuances of Accelerated After
After After
Asset Repatriation of Stock by Amortization of % Change - Considering
Considering Considering
Equity Gain on Impairments/ Certain Tax HFCS Lawsuit Resolution of Foreign Equity Stock-Based Asset Write- Reported Items
Reported Items Reported Items
Investees Turkey IPO Restructuring Matters (1) Settlement Tax Matters Earnings Investees Compensation downs Equity Investee (GAAP) (Non-GAAP)
(GAAP) (Non-GAAP) (GAAP) (Non-GAAP)
Net Operating Revenues $18,156 $18,156 $17,553 $17,553 3 3
Cost of goods sold 6,101 6,101 6,199 $42 6,241 (2) (2)
Gross Profit 12,055 12,055 11,354 (42) 11,312 6 7
Selling, general and administrative expenses 6,844 6,844 6,446 ($50) 6,396 6 7
Other operating charges 115 ($115) - 85 (85) - -- --
Operating Income** 5,096 115 5,211 4,823 (42) 50 85 4,916 6 6
Interest income 152 152 163 163 (7) (7)
Interest expense 173 173 179 179 (3) (3)
Equity income - net 569 ($9) 560 553 4 ($16) 541 3 4
Other income (loss) - net 48 ($123) (75) (66) (66) -- --
Gain on issuances of stock by equity investees - - 23 ($23) - -- --
Income Before Income Taxes 5,692 (9) (123) 115 5,675 5,317 (42) (23) 50 89 (16) 5,375 7 6
Income taxes 1,290 - 14 20 $9 1,333 1,309 (16) $91 ($127) (8) 12 4 (2) 1,263 (1) 6
Net Income $4,402 ($9) ($137) $95 ($9) $4,342 $4,008 ($26) ($91) $127 ($15) $38 $85 ($14) 4,112 10 6
Diluted Net Income Per Share $1.87 $0.00 ($0.06) $0.04 $0.00 $1.84 (2) $1.67 ($0.01) ($0.04) $0.05 ($0.01) $0.02 $0.04 ($0.01) $1.71 12 8
Average Shares Outstanding - Diluted 2,354 2,354 2,354 2,354 2,354 2,354 2,399 2,399 2,399 2,399 2,399 2,399 2,399 2,399 2,399
Gross Margin 66.4% 66.4% 64.7% 64.4%
Operating Margin 28.1% 28.7% 27.5% 28.0%
Effective Tax Rate 22.7% 23.5% 24.6% 23.5%
Note: Items to consider for comparability include primarily charges, gains, and accounting changes. Charges and accounting changes negatively impacting net income are reflected
as increases to reported net income. Gains and accounting changes positively impacting net income are reflected as deductions to reported net income.
(1) Primarily related to changes in reserves related to certain tax matters.
(2) Per share amounts do not add due to rounding.
-more-
3. The Company reports its financial results in accordance with generally accepted accounting principles (GAAP). However, management believes that certain non-GAAP financial
measures used in managing the business may provide users of this financial information additional meaningful comparisons between current results and results in prior operating
periods. Management believes that these non-GAAP financial measures can provide additional meaningful reflection of underlying trends of the business because they provide a
comparison of historical information that excludes certain items that impact the overall comparability. Management also uses these non-GAAP financial measures in making financial,
operating and planning decisions and in evaluating the Company's performance. See the Table below for supplemental financial data and corresponding reconciliations to GAAP
financial measures for the three months ended September 29, 2006 and September 30, 2005. Non-GAAP financial measures should be viewed in addition to, and not as an
alternative for, the Company’s reported results prepared in accordance with GAAP.
THE COCA-COLA COMPANY AND SUBSIDIARIES
Reconciliation of GAAP to Non-GAAP Financial Measures
Operating Income (Loss), by Segment
(UNAUDITED)
(In millions except percentages)
Three Months Ended September 29, 2006 Three Months Ended September 30, 2005
Items Items
Impacting Impacting
Comparability Comparability
% Favorable
(Unfavorable) -
% Favorable
After After After
(Unfavorable) -
Considering Considering Considering
Asset
Asset Write- Reported
Impairments/
Reported Items Reported Items Items
downs (GAAP)
Restructuring
(GAAP) (Non-GAAP) (GAAP) (Non-GAAP) (Non-GAAP)
North America $383 $383 $414 $414 (7) (7)
Africa 97 $1 98 96 96 1 2
East, South Asia and Pacific Rim 58 15 73 8 $85 93 * (22)
European Union 632 7 639 564 564 12 13
Latin America 353 353 297 297 19 19
North Asia, Eurasia and Middle East 409 409 375 375 9 9
Bottling Investments 47 16 63 5 5 * *
Corporate (317) (317) (267) (267) (19) (19)
Consolidated $1,662 $39 $1,701 $1,492 $85 $1,577 11 8
* Calculation is not meaningful
-more-
4. The Company reports its financial results in accordance with generally accepted accounting principles (GAAP). However, management believes that certain non-GAAP financial measures used in
managing the business may provide users of this financial information additional meaningful comparisons between current results and results in prior operating periods. Management believes that these
non-GAAP financial measures can provide additional meaningful reflection of underlying trends of the business because they provide a comparison of historical information that excludes certain items that
impact the overall comparability. Management also uses these non-GAAP financial measures in making financial, operating and planning decisions and in evaluating the Company's performance. See the
Table below for supplemental financial data and corresponding reconciliations to GAAP financial measures for the nine months ended September 29, 2006 and September 30, 2005. Non-GAAP financial
measures should be viewed in addition to, and not as an alternative for, the Company’s reported results prepared in accordance with GAAP.
THE COCA-COLA COMPANY AND SUBSIDIARIES
Reconciliation of GAAP to Non-GAAP Financial Measures
Operating Income (Loss), by Segment
(UNAUDITED)
(In millions except percentages)
Nine Months Ended September 29, 2006 Nine Months Ended September 30, 2005
Items
Impacting
Comparability Items Impacting Comparability
% Favorable
(Unfavorable) -
% Favorable
After After After
Accelerated
HFCS (Unfavorable) -
Considering Amortization of Considering Considering
Asset
Lawsuit Reported
Impairments/ Asset Stock-Based
Reported Items Reported Items Items
Settlement Write-downs Compensation (Non-GAAP) (GAAP)
Restructuring
(GAAP) (Non-GAAP) (GAAP) (Non-GAAP)
North America $1,264 $1,264 $1,187 $12 $1,199 6 5
Africa 287 $1 288 261 3 264 10 9
East, South Asia and Pacific Rim 283 19 302 209 $85 3 297 35 2
European Union 1,774 34 1,808 1,761 3 1,764 1 2
Latin America 1,048 1,048 873 4 877 20 19
North Asia, Eurasia and Middle East 1,224 1,224 1,316 3 1,319 (7) (7)
Bottling Investments 77 61 138 3 3 * *
Corporate (861) (861) (787) ($42) 22 (807) (9) (7)
Consolidated $5,096 $115 $5,211 $4,823 ($42) $85 $50 $4,916 6 6
* Calculation is not meaningful
-more-
5. The Company reports its financial results in accordance with generally accepted accounting principles (GAAP). However, management believes that certain non-GAAP financial
measures used in managing the business may provide users of this financial information additional meaningful comparisons between current results and results in prior operating
periods. Management believes that these non-GAAP financial measures can provide additional meaningful reflection of underlying trends of the business because they provide a
comparison of historical information that excludes certain items that impact the overall comparability. Management also uses these non-GAAP financial measures in making
financial, operating and planning decisions and in evaluating the Company's performance. See the Table below for supplemental financial data and corresponding
reconciliations to GAAP financial measures for the nine months ended September 29, 2006 and September 30, 2005. Non-GAAP financial measures should be viewed in
addition to, and not as an alternative for, the Company’s reported results prepared in accordance with GAAP.
THE COCA-COLA COMPANY
RECONCILIATION OF OPERATING INCOME EXCLUDING ASSET IMPAIRMENTS/RESTRUCTURING, ASSET WRITE-DOWNS, HFCS LAWSUIT SETTLEMENT, ACCELERATED
AMORTIZATION OF STOCK-BASED COMPENSATION AND CURRENCY IMPACT
(In millions)
Nine Months Ended
September 29, September 30,
2006 2005 % Change
Reported operating income $ 5,096 $ 4,823 6
Asset impairments/restructuring 115
Asset write-downs 85
HFCS lawsuit settlement (42)
Accelerated amortization of stock-based compensation 50
Operating income excluding asset impairments/restructuring, asset write-downs, HFCS lawsuit
settlement and accelerated amortization of stock-based compensation $ 5,211 $ 4,916 6
Negative currency impact (1)
Operating income excluding asset impairments/restructuring, asset write-downs, HFCS lawsuit
settlement, accelerated amortization of stock-based compensation and currency impact 7