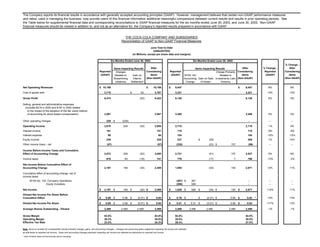
The document provides a reconciliation of GAAP to non-GAAP financial measures for The Coca-Cola Company for the six months ended June 30, 2003 and June 30, 2002. It shows the company's reported income statement figures according to GAAP as well as adjustments to consider certain non-GAAP items for additional comparisons between periods. Key figures like net operating revenues, operating income, net income, and earnings per share are presented on both a GAAP and non-GAAP basis, with non-GAAP adjusting for items like charges related to streamlining initiatives and gains on investments.
coca cola Reconciliation of YTD 2003 Non-GAAP Financial Measure
1. The Company reports its financial results in accordance with generally accepted accounting principles (GAAP). However, management believes that certain non-GAAP performance measures
and ratios, used in managing the business, may provide users of this financial information additional meaningful comparisons between current results and results in prior operating periods. See
the Table below for supplemental financial data and corresponding reconciliations to GAAP financial measures for the six months ended June 30, 2003, and June 30, 2002. Non-GAAP
financial measures should be viewed in addition to, and not as an alternative for, the Company’s reported results prepared in accordance with GAAP.
THE COCA-COLA COMPANY AND SUBSIDIARIES
Reconciliation of GAAP to Non-GAAP Financial Measures
June Year-to-Date
(UNAUDITED)
(In Millions, except per share data and margins)
Six Months Ended June 30, 2003 Six Months Ended June 30, 2002
% Change -
% Change - After
After After
Items Impacting Results Items Impacting Results
Reported Considering
Reported Considering Reported Charge Primarily Considering
Charges
(GAAP) Items
(GAAP) Items (GAAP) Items
Related to Gain on SFAS 142 Related to
(Non-GAAP)
(Non-GAAP) Accounting Gain on Sale Investments Latin (Non-GAAP)
Streamlining Vitamin
Initiatives Settlement Change of Kaiser America
Net Operating Revenues $ 10,189 $ 10,189 $ 9,447 $ 9,447 8% 8%
Cost of goods sold 3,715 $ 52 3,767 3,321 3,321 12% 13%
Gross Profit 6,474 (52) 6,422 6,126 6,126 6% 5%
Selling, general and administrative expenses
(includes $219 in 2003 and $187 in 2002 related
to the impact of the adoption of the fair value method
of accounting for stock-based compensation) 3,567 3,567 3,408 3,408 5% 5%
Other operating charges 229 $ (229) - - - -- --
Operating Income 2,678 229 (52) 2,855 2,718 2,718 -1% 5%
Interest income 101 101 110 110 -8% -8%
Interest expense 88 88 104 104 -15% -15%
Equity income 239 239 237 $ (28) 209 1% 14%
Other income (loss) - net (57) (57) (230) (23) $ 157 (96) -- --
Income Before Income Taxes and Cumulative
Effect of Accounting Change 2,873 229 (52) 3,050 2,731 (51) 157 2,837 5% 8%
Income taxes 676 83 (18) 741 776 (17) 7 766 -13% -3%
Net Income Before Cumualtive Effect of
Accounting Change 2,197 146 (34) 2,309 1,955 (34) 150 2,071 12% 11%
Cumulative effect of accounting change, net of
income taxes
SFAS No. 142: Company Operations (367) $ 367 - -- --
Equity Investees (559) 559 - -- --
Net Income $ 2,197 $ 146 $ (34) $ 2,309 $ 1,029 $ 926 $ (34) $ 150 $ 2,071 114% 11%
Diluted Net Income Per Share Before
Cumulative Effect $ 0.89 $ 0.06 $ (0.01) $ 0.94 $ 0.79 $ - $ (0.01) $ 0.06 $ 0.83 * 13% 13%
Diluted Net Income Per Share $ 0.89 $ 0.06 $ (0.01) $ 0.94 $ 0.41 $ 0.37 $ (0.01) $ 0.06 $ 0.83 117% 13%
Average Shares Outstanding - Diluted 2,469 2,469 2,469 2,469 2,486 2,486 2,486 2,486 2,486 -1% -1%
Gross Margin 63.5% 63.0% 64.8% 64.8%
Operating Margin 26.3% 28.0% 28.8% 28.8%
Effective Tax Rate 23.5% 24.3% 28.4% 27.0%
Note: Items to consider for comparability include primarily charges, gains, and accounting changes. Charges and accounting gains negatively impacting net income are reflected
as add-backs to reported net income. Gains and accounting changes positively impacting net income are reflected as deductions to reported net income.
* Sum of items does not foot across due to rounding.