VIP Kolkata Call Girl Serampore 👉 8250192130 Available With Room
coca cola Reconciliation of Q1 2003 Non-GAAP Financial Measures
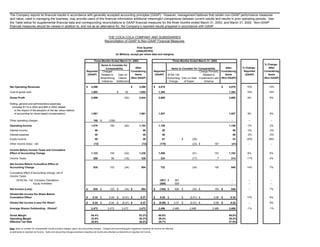
1. The Company reports its financial results in accordance with generally accepted accounting principles (GAAP). However, management believes that certain non-GAAP performance measures
and ratios, used in managing the business, may provide users of this financial information additional meaningful comparisons between current results and results in prior operating periods. See
the Table below for supplemental financial data and corresponding reconciliations to GAAP financial measures for the three months ended March 31, 2003, and March 31, 2002. Non-GAAP
financial measures should be viewed in addition to, and not as an alternative for, the Company’s reported results prepared in accordance with GAAP.
THE COCA-COLA COMPANY AND SUBSIDIARIES
Reconciliation of GAAP to Non-GAAP Financial Measures
First Quarter
(UNAUDITED)
(In Millions, except per share data and margins)
Three Months Ended March 31, 2003 Three Months Ended March 31, 2002
% Change -
Items to Consider for
% Change - After
After After
Comparability Items to Consider for Comparability
Reported Considering
Reported Considering Reported Charge Primarily Considering
Charges
(GAAP) Items
(GAAP) Items (GAAP) SFAS 142 Items
Related to Gain on Related to
(Non-GAAP)
(Non-GAAP) Accounting Gain on Sale Investments Latin (Non-GAAP)
Streamlining Vitamin
Initiatives Settlement Change of Kaiser America
Net Operating Revenues $ 4,498 $ 4,498 $ 4,079 $ 4,079 10% 10%
Cost of goods sold 1,602 $ 52 1,654 1,394 1,394 15% 19%
Gross Profit 2,896 (52) 2,844 2,685 2,685 8% 6%
Selling, general and administrative expenses
(includes $114 in 2003 and $95 in 2002 related
to the impact of the adoption of the fair value method
of accounting for stock-based compensation) 1,661 1,661 1,527 1,527 9% 9%
Other operating charges 159 $ (159) - - - -- --
Operating Income 1,076 159 (52) 1,183 1,158 1,158 -7% 2%
Interest income 56 56 58 58 -3% -3%
Interest expense 45 45 46 46 -2% -2%
Equity Income 49 49 61 $ (28) 33 -20% 48%
Other income (loss) - net (13) (13) (175) (23) $ 157 (41) -- --
Income Before Income Taxes and Cumulative
Effect of Accounting Change 1,123 159 (52) 1,230 1,056 (51) 157 1,162 6% 6%
Income Taxes 288 56 (18) 326 324 (17) 7 314 -11% 4%
Net Income Before Cumualtive Effect of
Accounting Change 835 103 (34) 904 732 (34) 150 848 14% 7%
Cumulative effect of accounting change, net of
Income Taxes
SFAS No. 142: Company Operations (367) $ 367 - -- --
Equity Investees (559) 559 - -- --
Net Income (Loss) $ 835 $ 103 $ (34) $ 904 $ (194) $ 926 $ (34) $ 150 $ 848 -- 7%
Diluted Net Income Per Share Before
Cumulative Effect $ 0.34 $ 0.04 $ (0.01) $ 0.37 $ 0.29 $ - $ (0.01) $ 0.06 $ 0.34 17% 9%
Diluted Net Income (Loss) Per Share* $ 0.34 $ 0.04 $ (0.01) $ 0.37 $ (0.08) $ 0.37 $ (0.01) $ 0.06 $ 0.34 -- 9%
Average Shares Outstanding - Diluted* 2,472 2,472 2,472 2,472 2,486 2,486 2,486 2,486 2,486 -1% -1%
Gross Margin 64.4% 63.2% 65.8% 65.8%
Operating Margin 23.9% 26.3% 28.4% 28.4%
Effective Tax Rate 25.6% 26.5% 30.7% 27.0%
Note: Items to consider for comparability include primarily charges, gains, and accounting changes. Charges and accounting gains negatively impacting net income are reflected
as add-backs to reported net income. Gains and accounting changes positively impacting net income are reflected as deductions to reported net income.