coca cola Reconciliation of Q3 and YTD 2007 Non-GAAP Financial Measures
1. Page 1 of 4
The Company reports its financial results in accordance with U.S. generally accepted accounting principles (GAAP). However, management believes that certain non-GAAP
financial measures used in managing the business may provide users of this financial information additional meaningful comparisons between current results and results in
prior operating periods. Management believes that these non-GAAP financial measures can provide additional meaningful reflection of underlying trends of the business
because they provide a comparison of historical information that excludes certain items that impact the overall comparability. Management also uses these non-GAAP
financial measures in making financial, operating and planning decisions and in evaluating the Company's performance. See the Tables below for supplemental financial data
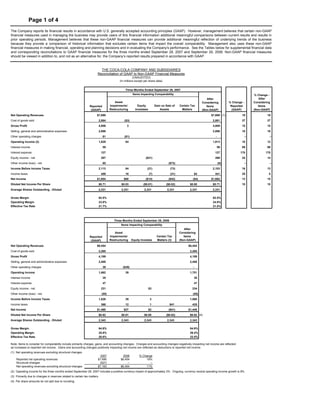
and corresponding reconciliations to GAAP financial measures for the three months ended September 28, 2007 and September 29, 2006. Non-GAAP financial measures
should be viewed in addition to, and not as an alternative for, the Company’s reported results prepared in accordance with GAAP.
THE COCA-COLA COMPANY AND SUBSIDIARIES
Reconciliation of GAAP to Non-GAAP Financial Measures
(UNAUDITED)
(In millions except per share data)
Three Months Ended September 28, 2007
Items Impacting Comparability % Change -
After
After
Asset % Change - Considering
Considering
Impairments/ Equity Gain on Sale of Certain Tax Reported Items
Reported Items
Restructuring Investees Assets Matters (GAAP) (Non-GAAP)
(GAAP) (Non-GAAP)
Net Operating Revenues $7,690 $7,690 (1) 19 19
Cost of goods sold 2,884 ($3) 2,881 27 27
Gross Profit 4,806 3 4,809 15 15
Selling, general and administrative expenses 2,896 2,896 16 16
Other operating charges 81 (81) - -- --
Operating Income (2) 1,829 84 1,913 10 12
Interest income 59 59 69 69
Interest expense 127 127 170 170
Equity income - net 287 ($21) 266 24 14
Other income (loss) - net 65 ($73) (8) -- --
Income Before Income Taxes 2,113 84 (21) (73) 2,103 16 13
Income taxes 459 16 (7) (31) $4 441 25 5
Net Income $1,654 $68 ($14) ($42) ($4) $1,662 13 15
Diluted Net Income Per Share $0.71 $0.03 ($0.01) ($0.02) $0.00 $0.71 15 15
Average Shares Outstanding - Diluted 2,331 2,331 2,331 2,331 2,331 2,331
Gross Margin 62.5% 62.5%
Operating Margin 23.8% 24.9%
Effective Tax Rate 21.7% 21.0%
Three Months Ended September 29, 2006
Items Impacting Comparability
After
Asset Considering
Impairments/ Certain Tax Items
Reported
Restructuring Equity Investee Matters (3) (Non-GAAP)
(GAAP)
Net Operating Revenues $6,454 $6,454
Cost of goods sold 2,265 2,265
Gross Profit 4,189 4,189
Selling, general and administrative expenses 2,488 2,488
Other operating charges 39 ($39) -
Operating Income 1,662 39 1,701
Interest income 35 35
Interest expense 47 47
Equity income - net 231 $3 234
Other income (loss) - net (55) (55)
Income Before Income Taxes 1,826 39 3 1,868
Income taxes 366 12 1 $41 420
Net Income $1,460 $27 $2 ($41) $1,448
Diluted Net Income Per Share $0.62 $0.01 $0.00 ($0.02) $0.62 (4)
Average Shares Outstanding - Diluted 2,343 2,343 2,343 2,343 2,343
Gross Margin 64.9% 64.9%
Operating Margin 25.8% 26.4%
Effective Tax Rate 20.0% 22.5%
Note: Items to consider for comparability include primarily charges, gains, and accounting changes. Charges and accounting changes negatively impacting net income are reflected
as increases to reported net income. Gains and accounting changes positively impacting net income are reflected as deductions to reported net income.
(1) Net operating revenues excluding structural changes:
2007 2006 % Change
Reported net operating revenues $7,690 $6,454 19%
Structural changes (527) -- --
Net operating revenues excluding structural changes $7,163 $6,454 11%
(2) Operating income for the three months ended September 28, 2007 includes a positive currency impact of approximately 3%. Ongoing, currency neutral operating income growth is 9%.
(3) Primarily due to changes in reserves related to certain tax matters.
(4) Per share amounts do not add due to rounding.
2. Page 2 of 4
The Company reports its financial results in accordance with U.S. generally accepted accounting principles (GAAP). However, management believes that certain non-GAAP
financial measures used in managing the business may provide users of this financial information additional meaningful comparisons between current results and results in
prior operating periods. Management believes that these non-GAAP financial measures can provide additional meaningful reflection of underlying trends of the business
because they provide a comparison of historical information that excludes certain items that impact the overall comparability. Management also uses these non-GAAP
financial measures in making financial, operating and planning decisions and in evaluating the Company's performance. See the Tables below for supplemental financial data
and corresponding reconciliations to GAAP financial measures for the nine months ended September 28, 2007 and September 29, 2006. Non-GAAP financial measures
should be viewed in addition to, and not as an alternative for, the Company’s reported results prepared in accordance with GAAP.
THE COCA-COLA COMPANY AND SUBSIDIARIES
Reconciliation of GAAP to Non-GAAP Financial Measures
(UNAUDITED)
(In millions except per share data)
Nine Months Ended September 28, 2007
Items Impacting Comparability % Change -
After
After
Asset % Change - Considering
Considering
Impairments/ Equity Gains on Sales Certain Tax Reported Items
Reported Items
Restructuring Investees of Assets Matters (1) (GAAP) (Non-GAAP)
(GAAP) (Non-GAAP)
Net Operating Revenues $21,526 $21,526 19 19
Cost of goods sold 7,765 ($13) 7,752 27 27
Gross Profit 13,761 13 13,774 14 14
Selling, general and administrative expenses 7,906 7,906 16 16
Other operating charges 129 (129) - -- --
Operating Income (2) 5,726 142 5,868 12 13
Interest income 150 150 (1) (1)
Interest expense 300 300 73 73
Equity income - net 497 $141 638 (13) 14
Other income (loss) - net 177 ($209) (32) -- --
Income Before Income Taxes 6,250 142 141 (209) 6,324 10 11
Income taxes 1,483 30 19 (104) ($37) 1,391 15 4
Net Income $4,767 $112 $122 ($105) $37 $4,933 8 14
Diluted Net Income Per Share $2.05 $0.05 $0.05 ($0.05) $0.02 $2.12 10 15
Average Shares Outstanding - Diluted 2,326 2,326 2,326 2,326 2,326 2,326
Gross Margin 63.9% 64.0%
Operating Margin 26.6% 27.3%
Effective Tax Rate 23.7% 22.0%
Nine Months Ended September 29, 2006
Items Impacting Comparability
After
Asset Considering
Impairments/ Transaction Certain Tax
Reported Items
Restructuring Equity Investee Gains Matters (1)
(GAAP) (Non-GAAP)
Net Operating Revenues $18,156 $18,156
Cost of goods sold 6,101 6,101
Gross Profit 12,055 12,055
Selling, general and administrative expenses 6,844 6,844
Other operating charges 115 ($115) -
Operating Income 5,096 115 5,211
Interest income 152 152
Interest expense 173 173
Equity income - net 569 ($9) 560
Other income (loss) - net 48 ($123) (75)
Income Before Income Taxes 5,692 115 (9) (123) 5,675
Income taxes 1,290 20 - 14 $9 1,333
Net Income $4,402 $95 ($9) ($137) ($9) $4,342
Diluted Net Income Per Share $1.87 $0.04 $0.00 ($0.06) $0.00 $1.84 (3)
Average Shares Outstanding - Diluted 2,354 2,354 2,354 2,354 2,354 2,354
Gross Margin 66.4% 66.4%
Operating Margin 28.1% 28.7%
Effective Tax Rate 22.7% 23.5%
Note: Items to consider for comparability include primarily charges, gains, and accounting changes. Charges and accounting changes negatively impacting net income are reflected
as increases to reported net income. Gains and accounting changes positively impacting net income are reflected as deductions to reported net income.
(1) Primarily due to changes in reserves related to certain tax matters.
(2) Operating income for the nine months ended September 28, 2007 includes a positive currency impact of approximately 3%. Ongoing, currency neutral operating income growth is 10%.
(3) Per share amounts do not add due to rounding.
3. Page 3 of 4
The Company reports its financial results in accordance with U. S. generally accepted accounting principles (GAAP). However, management believes that certain
non-GAAP financial measures used in managing the business may provide users of this financial information additional meaningful comparisons between current
results and results in prior operating periods. Management believes that these non-GAAP financial measures can provide additional meaningful reflection of
underlying trends of the business because they provide a comparison of historical information that excludes certain items that impact the overall comparability.
Management also uses these non-GAAP financial measures in making financial, operating and planning decisions and in evaluating the Company's performance.
See the Table below for supplemental financial data and corresponding reconciliations to GAAP financial measures for the three months ended September 28, 2007
and September 29, 2006. Non-GAAP financial measures should be viewed in addition to, and not as an alternative for, the Company’s reported results prepared in
accordance with GAAP.
THE COCA-COLA COMPANY AND SUBSIDIARIES
Reconciliation of GAAP to Non-GAAP Financial Measures
Operating Income (Loss) by Segment
(UNAUDITED)
(In millions)
Three Months Ended September 28, 2007 Three Months Ended September 29, 2006
Items Impacting Items Impacting
Comparability Comparability
% Favorable
(Unfavorable) -
% Favorable After
After After
(Unfavorable) - Considering
Asset Asset
Considering Considering
Reported
Impairments/ Impairments/ Items
Reported Items Reported Items
(GAAP)
Restructuring Restructuring (Non-GAAP)
(GAAP) (Non-GAAP) (GAAP) (Non-GAAP)
Africa $99 $13 $112 $97 $1 $98 2 14
Eurasia 81 2 83 49 49 65 69
European Union 652 7 659 632 7 639 3 3
Latin America 430 1 431 353 353 22 22
North America 447 13 460 383 383 17 20
Pacific 428 428 421 15 436 2 (2)
Bottling Investments 58 14 72 47 16 63 23 14
Corporate (366) 34 (332) (320) (320) (14) (4)
Consolidated $1,829 $84 $1,913 $1,662 $39 $1,701 10 12
4. Page 4 of 4
The Company reports its financial results in accordance with U. S. generally accepted accounting principles (GAAP). However, management believes that certain
non-GAAP financial measures used in managing the business may provide users of this financial information additional meaningful comparisons between current
results and results in prior operating periods. Management believes that these non-GAAP financial measures can provide additional meaningful reflection of
underlying trends of the business because they provide a comparison of historical information that excludes certain items that impact the overall comparability.
Management also uses these non-GAAP financial measures in making financial, operating and planning decisions and in evaluating the Company's performance.
See the Table below for supplemental financial data and corresponding reconciliations to GAAP financial measures for the nine months ended September 28, 2007
and September 29, 2006. Non-GAAP financial measures should be viewed in addition to, and not as an alternative for, the Company’s reported results prepared in
accordance with GAAP.
THE COCA-COLA COMPANY AND SUBSIDIARIES
Reconciliation of GAAP to Non-GAAP Financial Measures
Operating Income (Loss) by Segment
(UNAUDITED)
(In millions)
Nine Months Ended September 28, 2007 Nine Months Ended September 29, 2006
Items Impacting Items Impacting
Comparability Comparability
% Favorable
(Unfavorable) -
% Favorable After
After After
(Unfavorable) - Considering
Asset Asset
Considering Considering
Reported
Impairments/ Impairments/ Items
Reported Items Reported Items
(GAAP)
Restructuring Restructuring (Non-GAAP)
(GAAP) (Non-GAAP) (GAAP) (Non-GAAP)
Africa $290 $33 $323 $287 $1 $288 1 12
Eurasia 330 2 332 239 239 38 39
European Union 2,085 12 2,097 1,774 34 1,808 18 16
Latin America 1,258 3 1,261 1,048 1,048 20 20
North America 1,294 13 1,307 1,264 1,264 2 3
Pacific 1,306 1 1,307 1,276 20 1,296 2 1
Bottling Investments 131 43 174 77 60 137 70 27
Corporate (968) 35 (933) (869) (869) (11) (7)
Consolidated $5,726 $142 $5,868 $5,096 $115 $5,211 12 13