coca cola Reconciliation of Q1 2006 Non-GAAP Financial Measures
1. The Company reports its financial results in accordance with generally accepted accounting principles (GAAP). However, management believes that certain non-GAAP financial measures used in managing the business may provide users of this
financial information additional meaningful comparisons between current results and results in prior operating periods. Management believes that these non-GAAP financial measures can provide additional meaningful reflection of underlying
trends of the business because they provide a comparison of historical information that excludes certain items that impact the overall comparability. Management also uses these non-GAAP financial measures in making financial, operating and
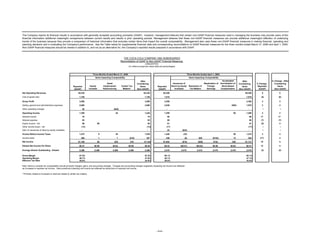
planning decisions and in evaluating the Company's performance. See the Table below for supplemental financial data and corresponding reconciliations to GAAP financial measures for the three months ended March 31, 2006 and April 1, 2005.
Non-GAAP financial measures should be viewed in addition to, and not as an alternative for, the Company’s reported results prepared in accordance with GAAP.
THE COCA-COLA COMPANY AND SUBSIDIARIES
Reconciliation of GAAP to Non-GAAP Financial Measures
(UNAUDITED)
(In millions except per share data and percentages)
Three Months Ended March 31, 2006 Three Months Ended April 1, 2005
Items Impacting Comparability Items Impacting Comparability
Accelerated % Change - After
After After
Asset Issuances of Repatriation of Amortization of % Change - Considering
Considering Considering
Equity Impairments/ Certain Tax Stock by Equity Resolution of Foreign Stock-Based Reported Items
Reported Items Reported Items
Investee Restructuring Matters* Investees Tax Matters Earnings Compensation (GAAP) (Non-GAAP)
(GAAP) (Non-GAAP) (GAAP) (Non-GAAP)
Net Operating Revenues $5,226 $5,226 $5,206 $5,206 0 0
Cost of goods sold 1,726 1,726 1,818 1,818 (5) (5)
Gross Profit 3,500 3,500 3,388 3,388 3 3
Selling, general and administrative expenses 2,060 2,060 2,029 ($50) 1,979 2 4
Other operating charges 45 ($45) - - - -- --
Operating Income 1,395 45 1,440 1,359 50 1,409 3 2
Interest income 70 70 60 60 17 17
Interest expense 63 63 68 68 (7) (7)
Equity income - net 86 $9 95 91 91 (5) 4
Other income (loss) - net (13) (13) (17) (17) -- --
Gain on issuances of stock by equity investees - - 23 ($23) - -- --
Income Before Income Taxes 1,475 9 45 1,529 1,448 (23) 50 1,475 2 4
Income taxes 369 1 7 ($10) 367 446 (8) $56 ($152) 12 354 (17) 4
Net Income $1,106 $8 $38 $10 $1,162 $1,002 ($15) ($56) $152 $38 $1,121 10 4
Diluted Net Income Per Share $0.47 $0.00 $0.02 $0.00 $0.49 $0.42 ($0.01) ($0.02) $0.06 $0.02 $0.47 12 4
Average Shares Outstanding - Diluted 2,366 2,366 2,366 2,366 2,366 2,410 2,410 2,410 2,410 2,410 2,410 (2) (2)
Gross Margin 67.0% 67.0% 65.1% 65.1%
Operating Margin 26.7% 27.6% 26.1% 27.1%
Effective Tax Rate 25.0% 24.0% 30.8% 24.0%
Note: Items to consider for comparability include primarily charges, gains, and accounting changes. Charges and accounting changes negatively impacting net income are reflected
as increases to reported net income. Gains positively impacting net income are reflected as deductions to reported net income.
* Primarily related to increases in reserves related to certain tax matters.
- more -
2. The Company reports its financial results in accordance with generally accepted accounting principles (GAAP). However, management believes that certain non-GAAP financial
measures used in managing the business may provide users of this financial information additional meaningful comparisons between current results and results in prior operating
periods. Management believes that these non-GAAP financial measures can provide additional meaningful reflection of underlying trends of the business because they provide a
comparison of historical information that excludes certain items that impact the overall comparability. Management also uses these non-GAAP financial measures in making financial,
operating and planning decisions and in evaluating the Company's performance. See the Table below for supplemental financial data and corresponding reconciliations to GAAP
financial measures for the three months ended March 31, 2006 and April 1, 2005. Non-GAAP financial measures should be viewed in addition to, and not as an alternative for, the
Company’s reported results prepared in accordance with GAAP.
THE COCA-COLA COMPANY AND SUBSIDIARIES
Reconciliation of GAAP to Non-GAAP Financial Measures
Operating Income (Loss), by Segment
(UNAUDITED)
(In millions except percentages)
Three Months Ended March 31, 2006 Three Months Ended April 1, 2005
Items Items
Impacting Impacting
Comparability Comparability
% Favorable
(Unfavorable) -
% Favorable After
After After
Accelerated
(Unfavorable) - Considering
Considering Considering
Asset Amortization of
Reported Items
Write-downs/ Stock-Based
Reported Items Reported Items
(GAAP)
Restructuring Compensation (Non-GAAP)
(GAAP) (Non-GAAP) (GAAP) (Non-GAAP)
North America $388 $388 $313 $12 325 24 19
Africa 103 103 90 3 93 14 11
East, South Asia and Pacific Rim 107 $3 110 88 3 91 22 21
European Union 455 455 512 3 515 (11) (12)
Latin America 349 349 277 4 281 26 24
North Asia, Eurasia and Middle East 317 317 409 3 412 (22) (23)
Bottling Investments (57) 42 (15) (55) - (55) (4) 73
Corporate (267) (267) (275) 22 (253) 3 (6)
Consolidated $1,395 $45 $1,440 $1,359 $50 $1,409 3 2