How Automation is Driving Efficiency Through the Last Mile of Reporting
delta air line 2007 4th
1. Reconciliation of GAAP Financial Measures to Non-GAAP Financial Measures
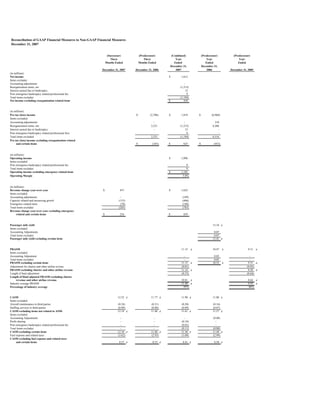
December 31, 2007
(Successor) (Predecessor) (Combined) (Predecessor) (Predecessor)
Three Three Year Year Year
Months Ended Months Ended Ended Ended Ended
December 31, December 31,
December 31, 2007 December 31, 2006 2007 2006 December 31, 2005
(in millions)
Net income $ 1,612
Items excluded
Accounting adjustments -
Reorganization items, net (1,215)
Interest earned due to bankruptcy 12
Post emergence bankruptcy related professional fee 9
Total items excluded (1,194)
Net income excluding reorganization related items $ 418
(in millions)
Pre-tax (loss) income $ (2,706) $ 1,819 $ (6,968)
Items excluded:
Accounting adjustments - - 310
Reorganization items, net 2,521 (1,215) 6,206
Interest earned due to bankruptcy - 12 -
Post emergence bankruptcy related professional fees 9 -
Total items excluded 2,521 (1,194) 6,516
Pre-tax (loss) income excluding reorganization related
and certain items $ (185) $ 625 $ (452)
(in millions)
Operating income $ 1,096
Items excluded:
Post emergence bankruptcy related professional fee 9
Total items excluded 9
Operating income excluding emergence related items $ 1,105
Operating Margin 5.8%
(in millions)
Revenue change year-over-year $ 437 $ 1,622
Items excluded:
Accounting adjustments - (189)
Capacity related and insourcing growth (133) (406)
Emergence related items (70) (188)
Total items excluded (203) (783)
Revenue change year-over-year excluding emergence
related and certain items $ 234 $ 839
Passenger mile yield 13.34 ¢
Items excluded:
Accounting Adjustments 0.07
Total items excluded 0.07
Passenger mile yield excluding certain items 13.41 ¢
PRASM 11.15 ¢ 10.47 ¢ 9.31 ¢
Items excluded:
Accounting Adjustment - 0.05 -
Total items excluded - 0.05 -
PRASM excluding certain items 11.15 ¢ 10.52 ¢ 9.31 ¢
Adjustment for charter and other airline revenue (0.01) (0.03)
PRASM excluding charter and other airline revenue 11.14 ¢ 9.28 ¢
Length of haul adjustment (0.33) (0.64)
Length of Haul adjusted PRASM excluding charter
revenue and other airline revenue 10.81 ¢ 8.64 ¢
Industry average PRASM 11.40 ¢ 9.93 ¢
Percentage of industry average 95% 86%
CASM 12.52 ¢ 11.77 ¢ 11.90 ¢ 11.80 ¢
Items excluded:
Aircraft maintenance to third parties (0.24) (0.21) (0.20) (0.16)
Staffing services to third parties (0.09) (0.08) (0.09) (0.07)
CASM excluding items not related to ASMs 12.19 ¢ 11.48 ¢ 11.61 ¢ 11.57 ¢
Items excluded:
Accounting Adjustments - - - (0.08)
Profit sharing - - (0.10) -
Post emergence bankruptcy related professional fee - - (0.01) -
Total items excluded - - (0.11) (0.08)
CASM excluding certain items 12.19 ¢ 11.48 ¢ 11.50 ¢ 11.49 ¢
Fuel expense and related taxes (3.62) (2.93) (3.09) (2.99)
CASM excluding fuel expense and related taxes
and certain items 8.57 ¢ 8.55 ¢ 8.41 ¢ 8.50 ¢
2. (Successor) (Predecessor) (Combined) (Predecessor)
Three Three Year Year
Months Ended Months Ended Ended Ended
December 31, December 31,
December 31, 2007 December 31, 2006 2007 2006
Mainline CASM 11.18 ¢ 10.77 ¢ 10.68 ¢ 10.75 ¢
Items excluded:
Aircraft maintenance to third parties (0.28) (0.25) (0.25) (0.19)
Staffing services to third parties (0.11) (0.10) (0.10) (0.09)
Mainline CASM excluding items not related to ASMs 10.79 ¢ 10.42 ¢ 10.33 ¢ 10.47 ¢
Items excluded:
Accounting Adjustments - - - (0.10)
Profit sharing - - (0.12) -
Post emergence bankruptcy related professional fee - - (0.01) -
Total items excluded - - (0.13) (0.10)
Mainline CASM excluding certain items 10.79 ¢ 10.42 ¢ 10.20 ¢ 10.37 ¢
Fuel expense and related taxes (4.00) (3.21) (3.40) (3.23)
Mainline CASM excluding fuel expense and related
taxes and certain items 6.79 ¢ 7.21 ¢ 6.80 ¢ 7.14 ¢
Emergence related items (0.14)
Mainline CASM excluding fuel expense and related
taxes, emergence related and certain items 6.65 ¢
(in millions)
EBITDAR
Net (loss) income as reported $ (70) $ 1,612
Items excluded:
Non-operating expenses 103 492
Income taxes (35) 207
Depreciation and amortization 288 1,164
Aircraft rent 60 246
Reorganization items, net - (1,215)
Post emergence bankruptcy related professional fee - 9
Total items excluded 416 903
EBITDAR excluding reorganization and certain items $ 346 2,515
Run-up in fuel prices (in excess of plan) 340
EBITDAR excluding reorganization, certain items
and the run-up in fuel prices $ 2,855
(in millions)
Free Cash Flow
Net cash provided by operating activities $ 1,359
Adjustments:
Payments to ALPA and PBGC for bankruptcy related obligations 875
Change in short-term investments (476)
Adjusted net cash provided by operating activities 1,758
Net cash used in investing activities (625)
Adjustment:
Financing of CRJ-900s (124)
Adjusted net cash used in investing activities (749)
Total Free Cash Flow $ 1,009
Average price per fuel gallon $ 2.21
Items excluded:
Emergence related items (0.02)
Total items excluded (0.02)
Average price per fuel gallon excluding
emergence related items $ 2.19
FORECAST
(Successor) (Successor)
Three Months Ending Year Ending
March 31, 2008 December 31, 2008
Projected Range Projected Range
Mainline CASM projection 11.80 ¢ 11.94 ¢ 11.18 ¢ 11.31 ¢
Items excluded:
Aircraft maintenance and staffing services to third parties (0.34) (0.34) (0.36) (0.36)
Mainline CASM projection excluding items not
related to ASMs 11.46 ¢ 11.60 ¢ 10.82 ¢ 10.95 ¢
Items excluded:
Profit sharing - - (0.11) (0.11)
Total items excluded - - (0.11) (0.11)
Mainline CASM projection excluding certain items 11.46 ¢ 11.60 ¢ 10.71 ¢ 10.84 ¢
Fuel expense and related taxes (4.13) (4.13) (3.97) (3.97)
Mainline CASM projection excluding fuel expense
and related taxes and certain items 7.33 ¢ 7.47 ¢ 6.74 ¢ 6.87 ¢
Change year-over-year in Mainline CASM excluding
fuel expense and related taxes and certain items 4% 6% -1% 1%
(Successor) (Predecessor)
Eight Months Four Months
Ended Ended
December 31, 2007 April 30, 2007
Revenue Passenger Miles (RPMs)
Consolidated 85,029 37,036
Mainline 72,164 31,288
Available Seat Miles (ASMs)
Consolidated 104,427 47,337
Mainline 88,082 39,667
3. Note: In connection with its emergence from bankruptcy on April 30, 2007, Delta adopted fresh start reporting in accordance with
American Institute of Certified Public Accountants’ Statement of Position 90-7, “Financial Reporting by Entities in Reorganization under
the Bankruptcy Code.” The adoption of fresh start reporting results in Delta’s becoming a new entity for financial reporting purposes.
Accordingly, Delta’s consolidated financial statements after April 30, 2007 are not comparable to its financial statements for any period
prior to emergence. However, to provide a basis of comparison to prior year results, Delta has combined the results for the four months
ended April 30, 2007 with the eight months ended December 31, 2007. References in these reconciliations to quot;Successorquot; refer to Delta
on or after May 1, 2007, giving effect to fresh start reporting. References to quot;Predecessorquot; refer to Delta prior to May 1, 2007.
The above tables show a reconciliation of certain combined GAAP measures adjusted for the following items:
• Cost per available seat mile (CASM) excludes $123 million and $104 million for the three months ended December 31, 2007 and
2006, respectively, and $445 million and $345 million for the years ended December 31, 2007 and 2006, respectively, in expenses related
to Delta's providing maintenance and staffing services to third parties as these costs are not associated with the generation of a seat mile.
• Delta excludes reorganization related and certain items because management believes the exclusion of these items is helpful to investors
to evaluate the company’s recurring operational performance.
• Passenger revenue per available seat mile (PRASM) excludes the impact of fresh start reporting as management believes the
exclusion of this item is helpful to investors to evaluate the company's recurring operational performance
• Delta presents length-of-haul adjusted PRASM excluding charter and other airline revenue because management believes this provides
more meaningful comparison of the company’s PRASM to the industry.
• Delta presents mainline cost per available seat mile (CASM) excluding fuel expense and related taxes because management believes
high fuel prices mask the progress that achieved toward it business plan targets.
• Delta excludes profit sharing expense from CASM because management believes the exclusion of this item provides a more meaningful
comparison of the Company's CASM to the industry.
• EBITDAR has been presented as management believes it is helpful to investors in utilizing EBITDAR as a proxy for operating cash
flow on a period over period basis.
• Delta presents free cash flow because management believes this metric is helpful to investors to evaluate factors causing changes in the
company’s liquidity position.