This study examined the nesting patterns and movements of spectacled eiders on Kigigak Island in Alaska from 1998-2012. The researchers found that:
1) Nest success had a significant effect on dispersal distance between consecutive years, with unsuccessful nests dispersing farther on average than successful nests.
2) There was no significant variation found in average yearly dispersal distances between years.
3) Comparisons to a previous 1992-1997 study found differences in dispersal distances of unsuccessful nests, which the authors attributed to differences in sample sizes, data selection, and analysis methods between the studies.
Project Overview: Ecological & Evolutionary Genetics of Southwestern White Pi...Justin C. Bagley
Provides a brief overview of our project on the ecological and evolutionary genetics of southwestern white pine (SWWP), an alpine white pine distributed in the sky-islands of the North American desert southwest.
This was my presentation for my advanced remote sensing course in which I researched and applied methods for mapping biological soil crusts in arid environments.
Association mapping identifies loci for canopy coverage in diverse soybean ge...Avjinder (Avi) Kaler
Rapid establishment of canopy coverage decreases
soil evaporation relative to transpiration improves
water use efficiency and light interception, and increases
soybean competitiveness against weeds.
Genome-wide association mapping of canopy wilting in diverse soybean genotypesAvjinder (Avi) Kaler
Genome-wide association analysis identified 61 SNP markers for canopy wilting, which likely tagged 51 different loci. Based on the allelic effects of the significant SNPs, the slowest and fastest wilting genotypes were identified.
Impact of past and future climate change on diversity in tropical rainforestsUniversity of Adelaide
Craig’s research centers on the use of molecular approaches to study ecology and evolution and addresses questions including;
(1) the use of molecular markers to infer current and historical population processes at various spatial and temporal scales;
(2) the effects of historical changes in habitat on current distributions and diversity of faunas, with particular reference to rainforest biotas;
(3) improving the use of molecular information in conservation biology and the development of strategies that recognize evolutionary processes.
The geographic focus of this research program spans the tropical forests of Australasia, especially the wet tropics of northeastern Australia and western North America
Density and distribution of chimpanzee (Pan troglodytes verus, Schwarz 1934) ...Open Access Research Paper
The loss of biodiversity mainly due to human activities is a global concern. The survival of wild mammals, including the West African chimpanzee (Pan troglodytes verus), which is considered a critically endangered species, is threatened. However, information on the status of the remaining populations of such a primate and its distribution is rarely available or out of date for some sites. This study aims at improving the knowledge of the west chimpanzee population density and distribution in Mont Sangbé National Park (MSNP), West Côte d’Ivoire, for conservation purposes. We counted chimpanzee sleeping nests along 64 line transects of one kilometer each in the forest area of the MSNP by following distance sampling methods. Then, we recorded the GPS coordinates of all signs of the presence of the species during transects and recce surveys. We observed 148 signs of the presence of chimpanzees including 94 nests counted along transects. The average density of chimpanzees in the forest area of MSNP was estimated at 0.25 individuals/km² and 0.48 individuals/km² when using a value of a lifetime of nests of 164.38 days and 84.38 days, respectively. In addition, the distribution map showed that the signs of the presence of chimpanzees are mainly observed in two areas: the southern and the north-eastern forest areas of the MSNP. We recommend the application of other survey methods (genetics, camera trapping, nest counts combined with the modeling of nest lifetime estimates) for a better understanding of the chimpanzee population ecology and for conservation management in the PNMS.
33. N. L. Roberts, A. M. Piotrowski, J. F. McManus, L. D. Keig.docxgilbertkpeters11344
33. N. L. Roberts, A. M. Piotrowski, J. F. McManus, L. D. Keigwin,
Science 327, 75–78 (2010).
34. W. Broecker, A. E. Putnam, Quat. Sci. Rev. 57, 17–25
(2012).
35. Y.-J. Wang et al., Science 294, 2345–2348 (2001).
36. K. A. Allen et al., Quat. Sci. Rev. 122, 180–191 (2015).
37. Z. Liu et al., Science 325, 310–314 (2009).
38. P. Köhler, G. Knorr, E. Bard, Nat. Commun. 5, 5520 (2014).
39. K. Matsumoto, Geophys. Res. Lett. 34, L20605 (2007).
40. J. Southon, A. L. Noronha, H. Cheng, R. L. Edwards, Y. J. Wang,
Quat. Sci. Rev. 33, 32–41 (2012).
41. K. K. Andersen et al.North Greenland Ice Core Project
members, Nature 431, 147–151 (2004).
ACKNOWLEDGMENTS
This study was funded by the European Research Council, the
Philip Leverhulme Trust, the U.S. National Science Foundation
(grants 0636787, 0944474, 0902957, and 1234664), and a Marie
Curie Reintegration Grant. All the data reported in this paper are
available in the supplementary materials. We acknowledge the
crew and science parties of RRS James Cook cruise JC094 and RV
Nathaniel B. Palmer cruise NBP1103 who made this study possible.
We also thank J. F. McManus and K. R. Hendry for the helpful
comments during the preparation of this manuscript and
C. D. Coath, C. A. Taylor, S. Lucas, and C. Bertrand for help with
sample preparation and analyses. Comments from two anonymous
reviewers helped to improve the manuscript, inspiring us to look at
the deglacial ventilation and circulation events from a more
broadened view.
SUPPLEMENTARY MATERIALS
www.sciencemag.org/content/349/6255/1537/suppl/DC1
Materials and Methods
Supplementary Text
Figs. S1 to S6
Tables S1 to S4
References (42–54)
20 May 2015; accepted 27 August 2015
10.1126/science.aac6159
EVOLUTIONARY ECOLOGY
Functional mismatch in a bumble bee
pollination mutualism under
climate change
Nicole E. Miller-Struttmann,1,2* Jennifer C. Geib,3 James D. Franklin,2 Peter G. Kevan,4
Ricardo M. Holdo,2 Diane Ebert-May,5 Austin M. Lynn,2 Jessica A. Kettenbach,2,6
Elizabeth Hedrick,7 Candace Galen2
Ecological partnerships, or mutualisms, are globally widespread, sustaining agriculture and
biodiversity. Mutualisms evolve through the matching of functional traits between partners,
such as tongue length of pollinators and flower tube depth of plants. Long-tongued pollinators
specialize on flowers with deep corolla tubes, whereas shorter-tongued pollinators generalize
across tube lengths. Losses of functional guilds because of shifts in global climate may disrupt
mutualisms and threaten partner species. We found that in two alpine bumble bee species,
decreases in tongue length have evolved over 40 years. Co-occurring flowers have not become
shallower, nor are small-flowered plants more prolific. We argue that declining floral resources
because of warmer summers have favored generalist foraging, leading to a mismatch between
shorter-tongued bees and the longer-tubed plants they once pollinated.
L
ong-tongued bumble bees have coevolved
to pollinate pla.
Effects of density on spacing patterns and habitat associations of a Neotropi...Nicole Angeli
Presentation at Ecological Society of America, August 2013. Minneapolis, USA. –Oral Paper
Angeli, N. F., K. Lips, G. V. DiRenzo, and A. Cunha. “Effects of density on spacing patterns
and habitat associations in the Neotropical Glassfrog Espadarana prosoblepon.”
Received 26 February 2003Accepted 10 June 2003Published .docxsodhi3
Received 26 February 2003
Accepted 10 June 2003
Published online 11 August 2003
Climate and density shape population dynamics
of a marine top predator
Christophe Barbraud* and Henri Weimerskirch
Centre d’Études Biologiques de Chizé, CNRS-UPR 1934, 79360 Villiers en Bois, France
Long-term studies have documented that climate fluctuations affect the dynamics of populations, but the
relative influence of stochastic and density-dependent processes is still poorly understood and debated.
Most studies have been conducted on terrestrial systems, and lacking are studies on marine systems
explicitly integrating the fact that most populations live in seasonal environments and respond to regular
or systematic environmental changes. We separated winter from summer mortality in a seabird population,
the blue petrel Halobaena caerulea, in the southern Indian Ocean where the El Niño/Southern Oscillation
effects occur with a 3–4-year lag. Seventy per cent of the mortality occurred in winter and was linked to
climatic factors, being lower during anomalous warm events. The strength of density dependence was
affected by climate, with population crashes occurring when poor conditions occurred at high densities.
We found that an exceptionally long-lasting warming caused a ca. 40% decline of the population, suggest-
ing that chronic climate change will strongly affect this top predator. These findings demonstrate that
populations in marine systems are particularly susceptible to climate variation through complex interac-
tions between seasonal mortality and density-dependent effects.
Keywords: blue petrel; climatic fluctuations; density dependence; density independence;
seasonal survival
1. INTRODUCTION
Long-term studies have documented that climate fluctu-
ations influence the dynamics of populations (McCarty
2001; Stenseth et al. 2002; Walther et al. 2002), but the
underlying mechanisms, in particular the interaction
between stochastic and density-dependent effects, are
poorly understood and debated (Leirs et al. 1997). The
majority of work exploring the influence of density-depen-
dent and independent processes on vital rates and popu-
lation dynamics has used either time-series analyses (e.g.
Forchhammer et al. 1998; Grenfell et al. 1998), or analy-
ses based on long-term detailed individual-based data.
This second approach has detected important processes
influencing population dynamics that time-series method-
ologies may have overlooked (Leirs et al. 1997; Saether et
al. 2000; Coulson et al. 2001). However, the overwhelm-
ing majority of work using these approaches to shed light
on the processes influencing population dynamics has
been conducted on terrestrial populations (mammals:
ungulates, rodents, carnivores; birds: passerines, waders;
see Stenseth et al. (2002) and Walther et al. (2002) for
recent reviews). Thus, there is a crucial need for studies
on marine or coupled marine–terrestrial systems to permit
the approach of a general insight on t ...
Genetic diversity enhances the resistance of aseagrass ecosyMatthewTennant613
Genetic diversity enhances the resistance of a
seagrass ecosystem to disturbance
A. Randall Hughes* and John J. Stachowicz
Section of Evolution and Ecology, One Shields Avenue, University of California, Davis, CA 95616
Edited by G. David Tilman, University of Minnesota, St. Paul, MN, and approved May 4, 2004 (received for review April 14, 2004)
Motivated by recent global reductions in biodiversity, empirical
and theoretical research suggests that more species-rich systems
exhibit enhanced productivity, nutrient cycling, or resistance to
disturbance or invasion relative to systems with fewer species. In
contrast, few data are available to assess the potential ecosystem-
level importance of genetic diversity within species known to play
a major functional role. Using a manipulative field experiment, we
show that increasing genotypic diversity in a habitat-forming
species (the seagrass Zostera marina) enhances community resis-
tance to disturbance by grazing geese. The time required for
recovery to near predisturbance densities also decreases with
increasing eelgrass genotypic diversity. However, there is no effect
of diversity on resilience, measured as the rate of shoot recovery
after the disturbance, suggesting that more rapid recovery in
diverse plots is due solely to differences in disturbance resistance.
Genotypic diversity did not affect ecosystem processes in the
absence of disturbance. Thus, our results suggest that genetic
diversity, like species diversity, may be most important for enhanc-
ing the consistency and reliability of ecosystems by providing
biological insurance against environmental change.
There is growing recognition that humans are highly depen-dent on natural ecosystems for a variety of goods and
services (1). Maintaining the provision of these goods and
services in the face of natural and anthropogenic disturbances is
critical to achieving both conservation and economic goals.
Motivated by accelerating rates of worldwide decline in biodi-
versity (2), considerable research has focused on the conse
quences of local species loss for goods and services provided by
ecosystems (2– 8). Much of this work focuses on the effects of
declining species richness on short-term processes such as pro-
duction, community respiration, and nutrient cycling (2). Al-
though the results are far from unequivocal and subject to
varying interpretation (e.g., ref. 9), it does appear that, in some
systems, reductions in local species diversity contribute to a
decline in ecosystem properties such as productivity and resis-
tance to disturbance (see review in ref. 2).
Nevertheless, many important ecosystems, such as kelp forests,
cattail marshes, and fir forests, are dominated by, and dependent
on, one or a few key plant species (10). Furthermore, individual
predator and herbivore species often play a disproportionate role in
determining ecosystem processes, overwhelming any effect of spe-
cies diversity (11). Dominant, numerically abundant s ...
I am working with collaborators in Brazil, the U.S., and Mexico to complete genetic data analyses and manuscripts from two postdoctoral research fellowships. This slideshow presents a brief overview of the two main funded research projects that I am involved in.
Behavioral signature of intraspecific competition anddensity.docxAASTHA76
Behavioral signature of intraspecific competition and
density dependence in colony-breeding marine predators
Greg A. Breed1, W. Don Bowen2 & Marty L. Leonard1
1Department of Biology, Dalhousie University, 1355 Oxford Street, Halifax, Nova Scotia, B3H 4J1, Canada
2Bedford Institute of Oceanography, 1 Challenger Drive, Dartmouth, Nova Scotia, B2Y 4A2, Canada
Keywords
Animal movement, compensatory population
regulation, correlated random walk, foraging
ecology, juvenile mortality, marine mammal,
seal, switching state-space model.
Correspondence
Greg A. Breed, Department of Biological
Sciences University of Alberta, Edmonton, AB
T6G 2E9, Canada. Tel: 780-492-7942;
E-mail: [email protected]
Funding information
This work was supported by the Future of
Marine Animal Populations program, Fisheries
and Oceans Canada, Dalhousie University,
and NSERC grants awarded to Marty Leonard
and W. Don Bowen. This research was
conducted under the authorization of the
Canadian Ministry of Fisheries protocol nos.
04-13, 02-91, 00-051, and 98-078.
Received: 24 May 2013; Revised: 26 July
2013; Accepted: 12 August 2013
Ecology and Evolution 2013; 3(11): 3838–
3854
doi: 10.1002/ece3.754
Abstract
In populations of colony-breeding marine animals, foraging around colonies
can lead to intraspecific competition. This competition affects individual forag-
ing behavior and can cause density-dependent population growth. Where
behavioral data are available, it may be possible to infer the mechanism of
intraspecific competition. If these mechanics are understood, they can be used
to predict the population-level functional response resulting from the competi-
tion. Using satellite relocation and dive data, we studied the use of space and
foraging behavior of juvenile and adult gray seals (Halichoerus grypus) from a
large (over 200,000) and growing population breeding at Sable Island, Nova
Scotia (44.0 oN 60.0 oW). These data were first analyzed using a behaviorally
switching state-space model to infer foraging areas followed by randomization
analysis of foraging region overlap of competing age classes. Patterns of habitat
use and behavioral time budgets indicate that young-of-year juveniles (YOY)
were likely displaced from foraging areas near (<10 km) the breeding colony by
adult females. This displacement was most pronounced in the summer. Addi-
tionally, our data suggest that YOY are less capable divers than adults and this
limits the habitat available to them. However, other segregating mechanisms
cannot be ruled out, and we discuss several alternate hypotheses. Mark–resight
data indicate juveniles born between 1998 and 2002 have much reduced survi-
vorship compared with cohorts born in the late 1980s, while adult survivorship
has remained steady. Combined with behavioral observations, our data suggest
YOY are losing an intraspecific competition between adults and juveniles,
resulting in the currently observed decelerating logistic ...
Behavioral signature of intraspecific competition anddensity.docx
CMoore_SPEI_Fidelity_FINAL
1. Region NW SW E
NW 78 3(1) 2(1)
SW 5(1) 67 2
E 2 3(2) 27
# moved to 7 6 4
# stayed in 6 3 3
Figure 3: Coded nasal discs and plastic tarsal bands helped facilitate resights with scopes, binoculars
and cameras. If unable to resight visually, mist nets and bow net traps were used.
OBJECTIVES
Describe the spatial patterns
and movements of nesting
females on Kigigak.
Examine the relationship
between nest success and nest
dispersal distance in
consecutive years.
Investigate possible
changes in nest site
fidelity since an initial
assessment was
completed by Tina
Moran in 2000.
Callie B. Moore1, Kyle A.Spragens1,2
1 U.S. Fish & Wildlife Service, Yukon Delta National Wildlife Refuge, Bethel, AK 99559
2 Current: U.S. Geological Survey, Western Ecological Research Center, San Francisco Bay Estuary Field Station, Vallejo, CA 94592
Data Collection
Resight and nest data from 1998-2012 was used in our analysis.
We compared our results to data collected between 1992-1997.
Mean initiation dates and fox index were calculated based on data from
the Yukon-Kuskokwim Delta Waterfowl Nest Plot Reports.
Data Analysis
Dispersal distance of nest sites of known marked birds observed in two
consecutive years (t vs. t+1) was calculated using nest coordinates in
excel.
If ≥ one egg hatched in a nest it was deemed successful.
A one-way ANOVA (α = 0.05) was used to compare the effects of nest
success on dispersal distances in successful and unsuccessful groups.
Variation in the average dispersal distances between years was also
tested using a one-way ANOVA.
INTRODUCTION
A decline in the North American spectacled eider
(Somateria fischeri) population between 1970
and 1990, prompted the Yukon Delta NWR to
establish a remote field camp on Kigigak Island,
AK in the early 90’s to monitor the population
and assess possible reasons for the decline. To
date 1,933 spectacled eiders have been banded, of which a large
percentage have been resighted and contributed to multiple
nesting attempts. With such a large portion of the female
population being marked (approx. 80.7% of observed nesting
hens in 2011) and the small size of the island (31.8 km2), it is
apparent that the breeding-site fidelity of this population is quite
strong. Multiple encounters of marked individuals at unique
locations have raised questions as to whether fidelity analyses
can be narrowed to a much smaller scale (i.e. region, area, pond).
DISCUSSION
The complex dynamics of the
island make it difficult to gauge
how much nest success
influences nest dispersal.
To better assess this topic
other factors including; age,
levels of nest success and habitat changes need to be included.
Individual females varied in their patterns of dispersal (i.e. stayed
in the same region, made multiple region moves, moved to one
region but then returned back to original region (Figure 2).
Moran’s study did not find a significant difference between groups,
while ours did. Although our analysis were similar they were not
identical which makes comparing the results difficult. We believe
that this was the result of; differences in sample size (5 yrs vs. 14
years of data), data selection criteria, and analysis methods.
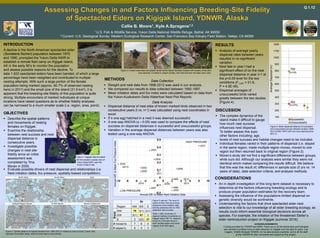
RESULTS
Analysis of average yearly
dispersal rates between years
resulted in no significant
variation.
Nest fate in year t had a
significant effect of on the nest
dispersal distance in year t+1 at
the p<0.05 level for the two
conditions (F1,307 = 21.6,
P = 4.9E-06).
Dispersal averages of
unsuccessful birds varied
greatly between the two studies
(Figure 4).
CONSIDERATIONS
An in depth investigation of this long-term dataset is necessary to
determine all the factors influencing breeding ecology and to
produce proper population estimates for the recovery team.
Assessing the influence of the populations limited dispersal on
genetic diversity would be worthwhile.
Understanding the factors that drive spectacled eider nest
selection is vital to our knowledge of all eider breeding ecology, as
results could inform essential biological decisions across all
species. For example, the initiation of the threatened Steller’s
eider reintroduction project on Kigigak (summer 2016).
ACKNOWLEDGEMENTS
Funding provided by YDNWR and MBM. Thank you to all the technicians and biologists
who devoted countless hours to data collection on Kigigak over the past 24 years. Lew
Coggins, Wildlife Biologist YDNWR, for his data analysis expertise, and to all the staff
at the YDNWR for their comments and support on this project.
Figure 4: Mean dispersal distance of successful
and unsuccessful groups between studies (1998-
2012 &1992-1997) with error bars depicting their
95% CI.
302
792
100
200
300
400
500
600
700
800
900
1000
1100
1200
AverageDispersal(m)
Successful
Unsuccessful
(n=270)
(n=39)
Q.1.12
-0.2
-0.1
0
0.1
0.2
0.3
0.4
0.5
-10 -8 -6 -4 -2 0 2 4 6 8 10
AnnualDiff.toMeanFoxPressureIndex
Annual Diff. to Mean Nest Initiation Date
2004
2014
HIGH PRESSURE
LOW PRESSURE
2002
2005
2007
2008
2009 20132010
2011
2003
2006
2001
1998
1999
2000
2012
Figure 2: Spatial patterns of marked females from 1998-2012 in relation to nest success. Green dots
represent successful nests, while red dots depict unsuccessful.
Figure 5 (above): The level of
yearly burden that two primary
pressures (nest initiation date
and fox pressure) had on YKD
waterfowl nest success
Table 1 (left): Summary of
regional nesting movements on
Kigigak Island ‘98-’12. Diagonal
shows # of females found in
each nesting region and never
migrate from that region.
to
from
Evaluate possible drivers of nest dispersal and relationships (i.e.
Nest initiation dates, fox pressure, spatially-biased competition).
METHODS
Figure 1: Kigigak Island located
on the western coastal zone of
Yukon Delta NWR, near the
mouth of Baird Inlet.