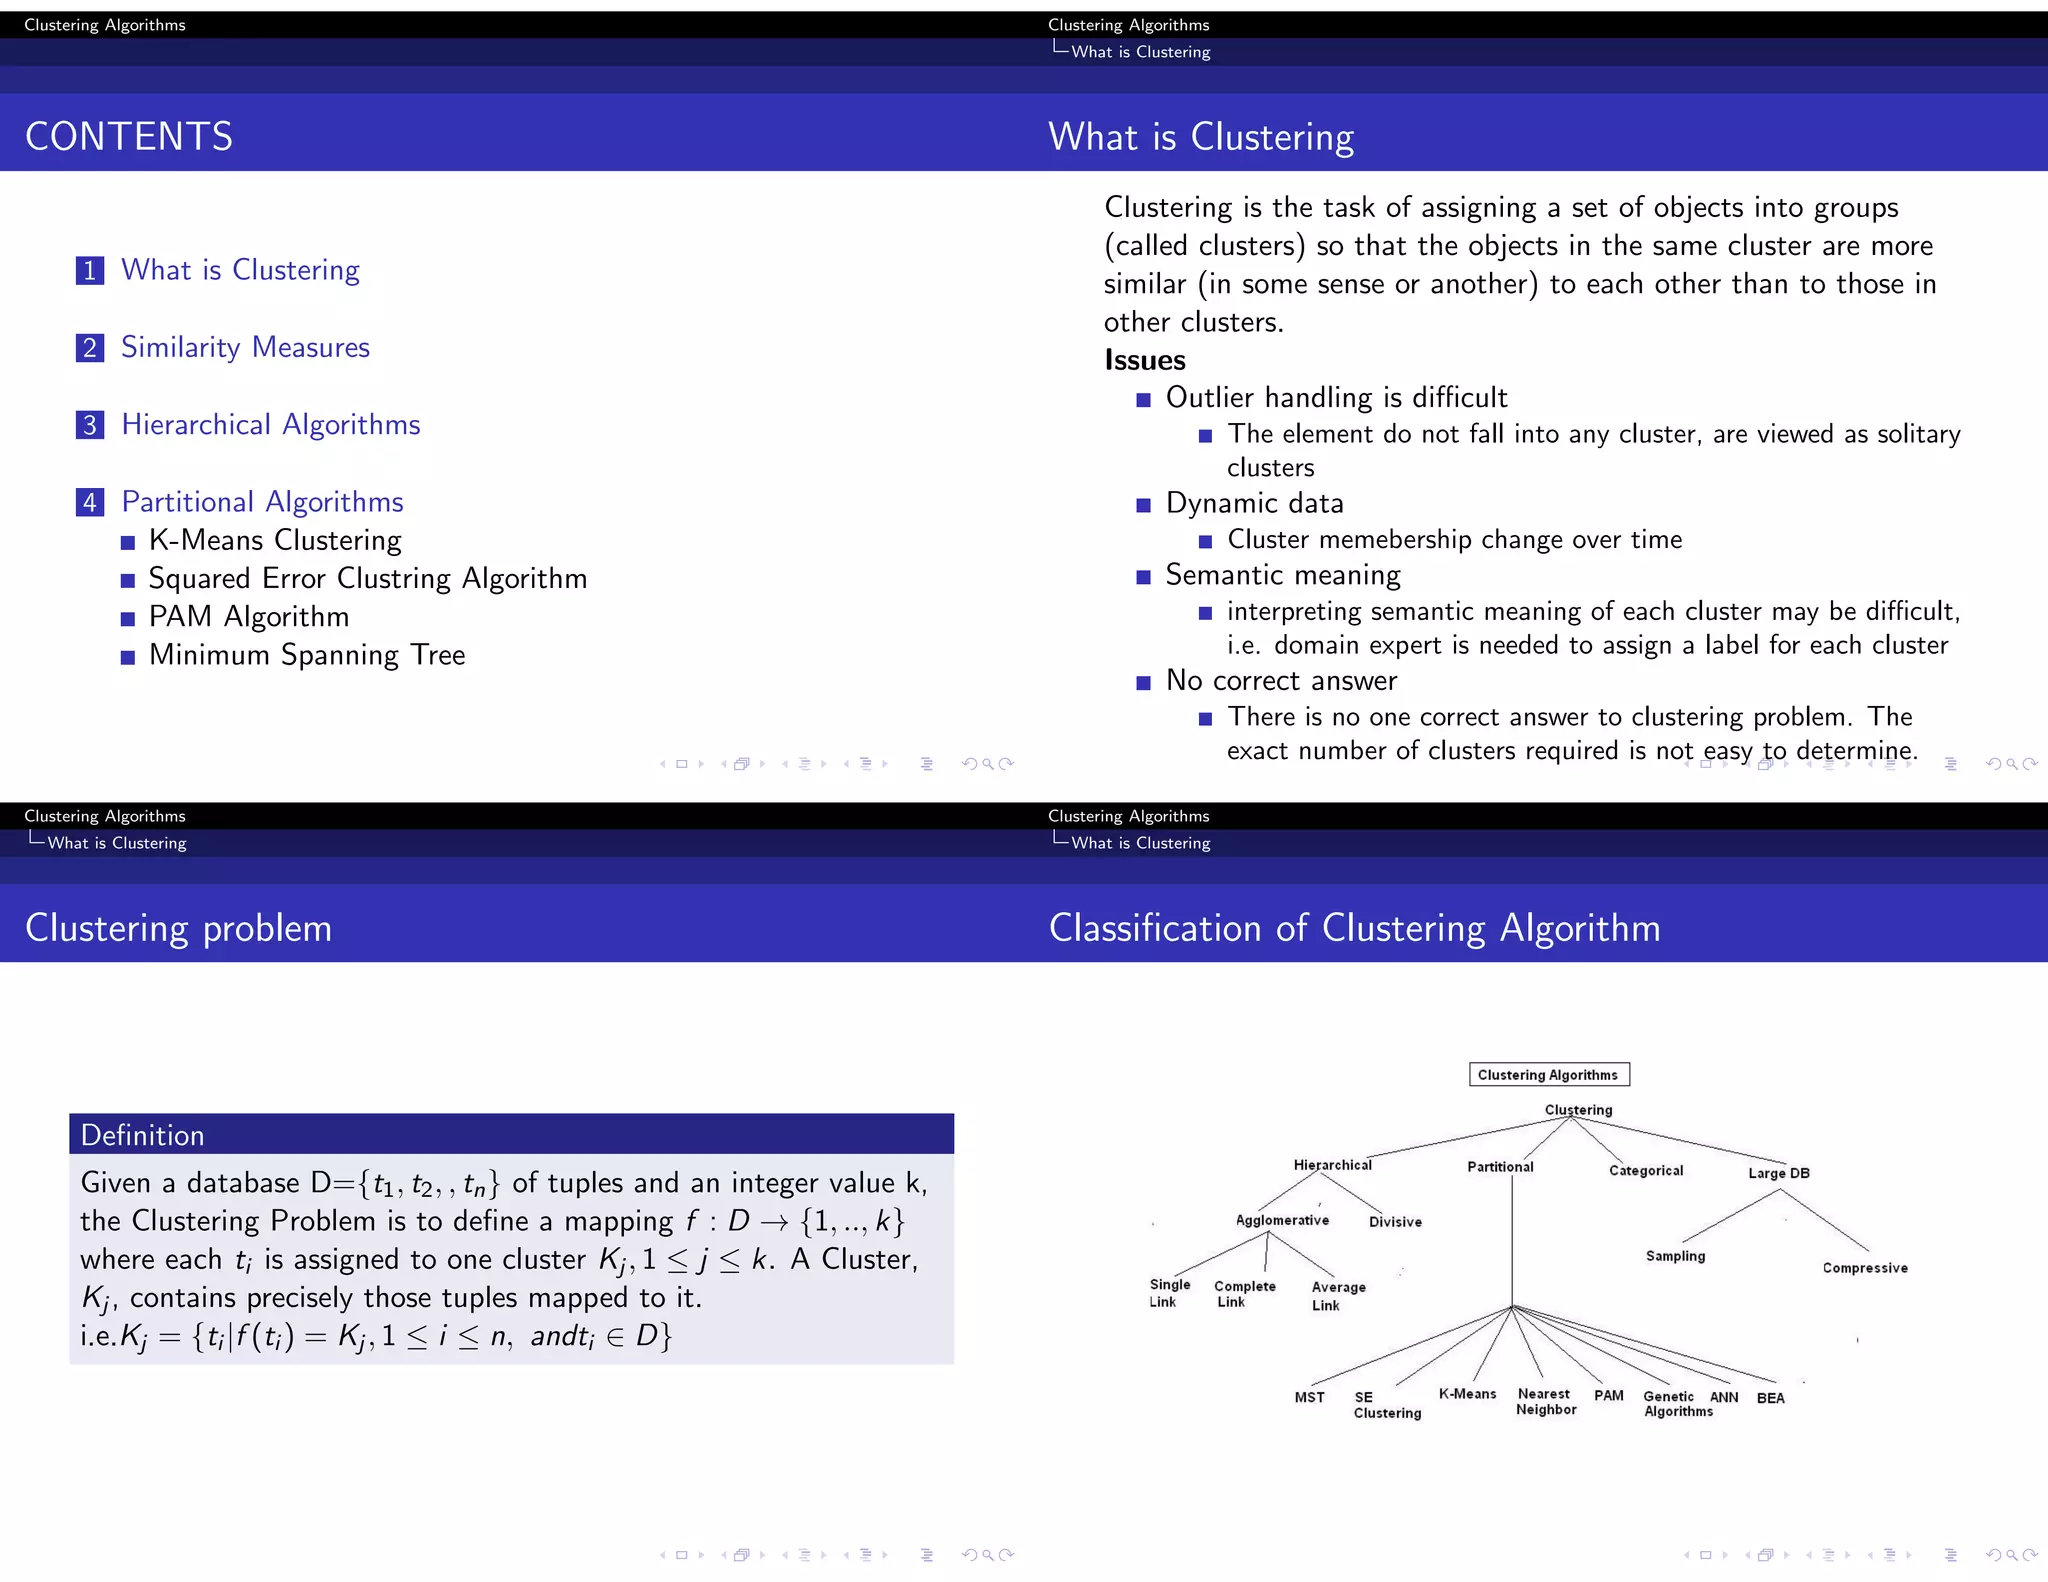
This document discusses various clustering algorithms. It begins by defining clustering as assigning objects into groups so that objects in the same cluster are more similar to each other than objects in other clusters. It then discusses hierarchical and partitional clustering algorithms. Hierarchical algorithms produce nested clusters and can be agglomerative (bottom-up) or divisive (top-down). Partitional algorithms create all clusters in one step by optimizing a criterion function like squared error. Popular algorithms discussed include K-means, single and complete link hierarchical clustering, and squared error clustering.

![Clustering Algorithms
Similarity Measures
Similarity Measures
Similarity measure is well known in the field of internet search,
where the similarity is based on the query the user stated,
retrieved pages are similar if they all contain the specified
query words.
Documents that are more alike have a higher degree of
similarity.
Useful in clustering and classification problems
Most similarity measures assume numeric values, so difficult
use with general data types
A mapping from the attribute domain to subset of integers
required
Clustering Algorithms
Similarity Measures
Similarity Measures
Definition
Similarity between two tuples ti and tj , sim(ti , tj ), in a database D
is a mapping from D × D to the range [0,1]. Thus sim(ti , tj ) ∈
[0,1].
The following desirable characteristics of good similarity measures
∀ti ∈ D, sim(ti , ti ) = 1
∀ti , tj ∈ D, sim(ti , tj ) = 0 if ti and tj are not like at all
∀ti , tj , tk ∈ D, sim(ti , tj ) < sim(ti , tk) if ti is more like tk
than it is like tj
Clustering Algorithms
Similarity Measures
Some Important Similarity Measures
Important similarity measures used in information retrieval system
and search engines are
Clustering Algorithms
Similarity Measures
Distance Measures
Distance or dissimilarity measures measure how unlike items are.
Definition
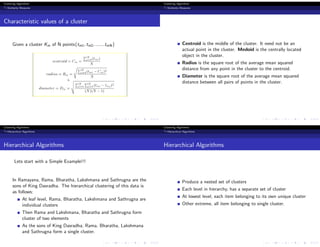
Given a cluster, Kj , ∀ tjl , tjm ∈ Kj and ti /
∈ Kj , dis(tjl , tjm) ≤
dis(tjl , ti )
Some important distance measures in a two dimensional space are](https://image.slidesharecdn.com/clusteringalgorithms-220713062659-01436618/85/Clustering-Algorithms-pdf-2-320.jpg)