Download to read offline
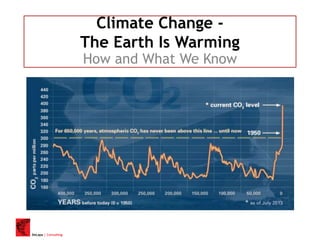
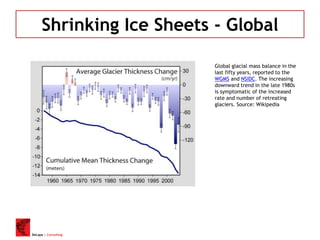
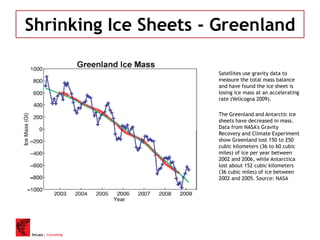
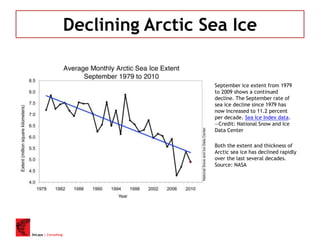
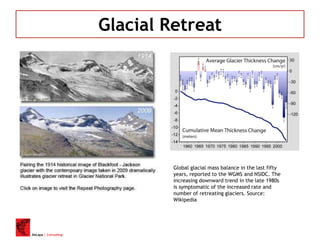
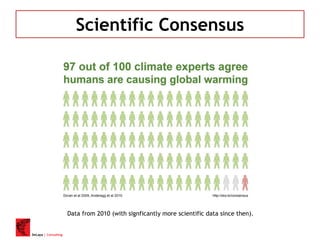
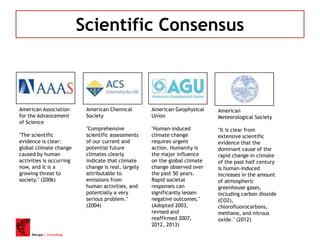

The document outlines the overwhelming scientific evidence of climate change, emphasizing the rise in greenhouse gas concentrations and their effects on global temperatures, ocean warming, and ice mass loss. A consensus exists among climate scientists, with 97% agreeing that human activities are the primary cause of rapid climate changes. It also highlights the increasing frequency of extreme weather events and ocean acidification as further consequences of climate change.


![Climate: Past, Present, Future [Prof John McClatchey]](https://cdn.slidesharecdn.com/ss_thumbnails/uhiclimatechangev2johnmcclatchey-100705044157-phpapp01-thumbnail.jpg?width=640&height=640&fit=bounds)


