Downloaded 12 times
![What is Global Warming?
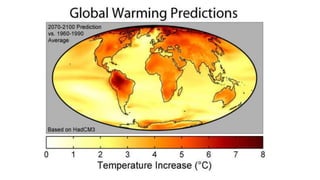
• the increase in Earth’s average surface temperature due to rising levels of
greenhouse gases.
• Its first use was in a 1975 Science article by geochemist Wallace Broecker of
Columbia University's Lamont-Doherty Geological Observatory: "Climatic
Change: Are We on the Brink of a Pronounced Global Warming?[1]
[1] Wallace Broecker, "Climatic Change: Are We on the Brink of a Pronounced Global Warming?" Science, vol. 189 (8 August 1975), 460-463.
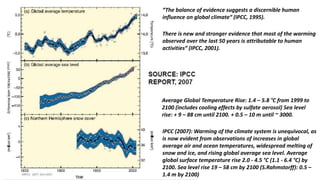
Global Mean Temperature Anomaly (U.K. Met. Office) 1900-2016
Purple shade
shows the
uncertainty in
measurements.
The solid line
represents the
actual
measurements.
0.6 oC of
increased
temperature](https://image.slidesharecdn.com/globalwarming-171218202932/85/Global-warming-Causes-and-Consequences-2-320.jpg)
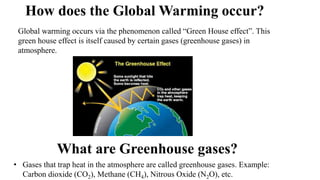
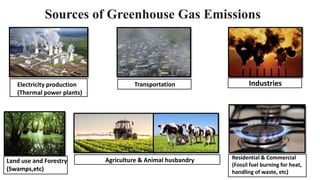
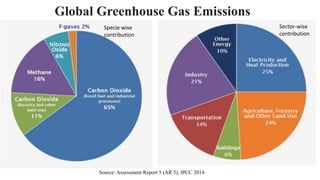
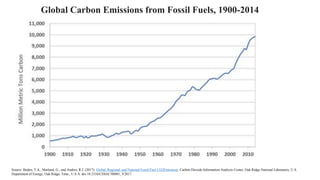
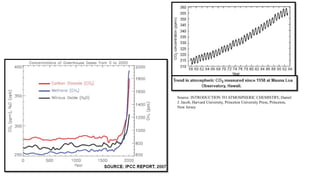
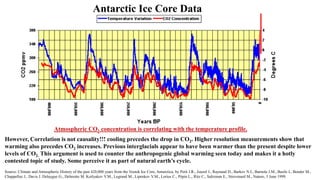
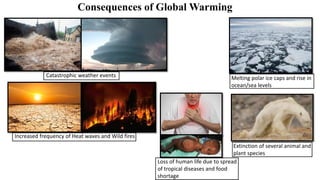

Global warming is defined as the increase in average surface temperatures due to rising greenhouse gas emissions. The main greenhouse gases are carbon dioxide, methane, and nitrous oxide. Global warming occurs due to the greenhouse effect, where greenhouse gases trap heat in the atmosphere. The main sources of greenhouse gas emissions are electricity production, transportation, industry, agriculture, and deforestation. Consequences of global warming include more extreme weather, rising sea levels, wildfires, extinction of species, spread of diseases, and food shortages.


