Downloaded 315 times


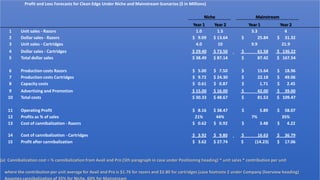


This document contains a case study analyzing market segments and profit forecasts for a company, Clean Edge, entering the razor and cartridge market. It includes a market segmentation breakdown by value and sales. Profit and loss forecasts are provided under niche and mainstream scenarios. Two executives debate whether Clean Edge should target the niche or mainstream market. The niche strategy appeals to minorities and has lower risks but may not scale, while the mainstream approach could broaden appeal but risks cannibalizing existing brands and requires more investment. In the end, Clean Edge must decide whether to launch a new niche brand or reposition their existing Paramount brand to target the mainstream market.


