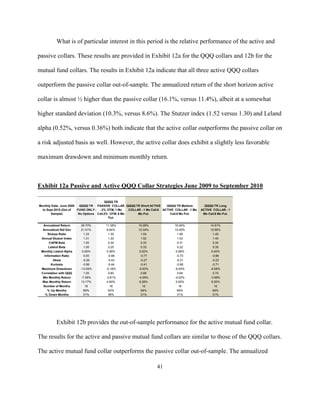
This document provides an update to a previous study on the performance of passive and active collar strategies applied to the Powershares QQQ ETF (QQQ). The update extends the analysis period through September 2010. It finds that during market declines like the tech bubble and credit crisis, collar strategies provided downside protection and strong returns compared to a long position in QQQ. However, collars underperformed during strong market climbs. The document also analyzes applying collar strategies to a small cap mutual fund and finds similar beneficial results. It concludes that active collars, which dynamically adjust based on momentum, volatility, and macroeconomic signals, tended to outperform passive collars both in-sample and out-of-sample.
![An Update of “Loosening Your Collar: Alternative Implementations of QQQ Collars”:
Credit Crisis and Out-of-Sample Performance
Edward Szado *
Thomas Schneeweis **
Original Version: August 2009
Current Update: January 2011
*Doctoral Candidate, Isenberg School of Management, University of Massachusetts, Amherst,
MA 01003, Director of Research, INGARM, Amherst, MA 01002. INGARM gratefully
acknowledges research support provided by the Options Industry Council. Research results,
however, represent those of the authors and do not necessarily represent the views of the OIC.
Please address correspondence to Edward Szado, INGARM, 29 S. Pleasant St., Amherst, MA
01002, 413-256-0195, or email: eszado@ingarm.org.
**Michael and Cheryl Philipp Professor of Finance, Director of CISDM, Isenberg School of
Management, University of Massachusetts, Amherst.
Abstract
This study provides an update to Szado and Schneeweis [2010]. The original study covered the
period from March 1999 through May 2009. This updated study extends the period of analysis
through September 2010.
The credit crisis and the associated decline in equity markets rekindled new interest in option
based equity collars and in protective strategies in general. In this paper we consider the
performance of passive and active implementations of the collar strategy on the QQQ ETF as
well as on a sample small cap equity mutual fund. As expected, the results of the analysis show
that a passive collar is most effective (relative to a long underlying position) in declining markets
and less effective in rising markets. This study also considers a more active implementation of
the collar strategy. Rather than simply applying a set of fixed rules as for the passive collar, in
the active collar adjusted strategy, we apply a set of rules which adapt the collar to varying
economic and market conditions. This approach is similar to applying a set of tactical asset
allocation rules to a set of investments. There are of course an unlimited number of conditioning
factors that can be used to determine the strategy implementation. In this paper, for purposes of
presentation, we combine three conditioning factors that have been suggested in academic
literature (momentum, volatility, and a compound macroeconomic factor (unemployment and
business cycle)) to generate a dynamic collar adjusted trading strategy. For the period of
analysis, the active collar adjustment strategy tends to outperform the passive collar both in-
sample as well as out-of-sample. Judgments as to the particular benefits of the passive and active
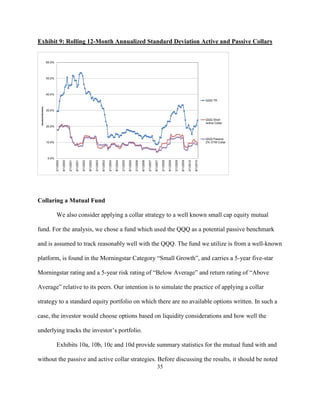
collar strategies are, of course, dependent on the risk tolerance of the individual investor.](https://image.slidesharecdn.com/cisdm-qqqactive-full-120804153036-phpapp01/85/Cisdm-qqqactive-full-1-320.jpg)
![Introduction
This study provides an update to Szado and Schneeweis [2010]1. The original study
covered the period from March 1999 through May 2009. This updated study extends the period
of analysis through September 2010. In addition to the original analysis, this update includes out-
of-sample performance for the active collar strategies based on the trading rules set out in the
original paper.
The credit crisis and the associated decline in equity markets rekindled new interest in
option based equity collars and in protective strategies in general. In 2008 the QQQ experienced
a drawdown of about 50% from peak to trough. Many other asset classes which are generally
considered effective equity diversifiers also faced significant losses. This type of contagion
across asset classes suggests that in times of major systematic stress, direct hedges through
protective option strategies may provide equity portfolios with greater downside risk protection
than standard multi-asset diversification programs. There are a variety of option strategies which
can provide capital protection for equity based portfolios. The focus of this paper is one of the
more straightforward options based strategies – the collar. A collar is an option based
investment strategy that effectively limits (or collars) the returns on an investment in an
underlying asset to fall within a chosen range. An investor who holds a long position in an
underlying asset can convert that position into a collar (collar his position) by purchasing a put
option on the underlying asset and simultaneously selling (writing) a call option on the
underlying asset. The strike price on the call defines the upper bound of the collar and is set
above the strike price for the put (which defines the lower bound of the collar). In a standard
1
See “Loosening Your Collar – Alternative Implementations of QQQ Collars,” Edward Szado and
Thomas Schneeweis, Journal of Trading, Spring 2010, Vol. 5, No. 2, pp. 35-56
2](https://image.slidesharecdn.com/cisdm-qqqactive-full-120804153036-phpapp01/85/Cisdm-qqqactive-full-2-320.jpg)
![collar, the call and put have the same expiration dates. The value of a portfolio constructed in
this manner will essentially be restricted to fluctuate within the bounds set by the strike prices of
the options (adjusted for the net cost of the option positions).2
In this paper, we extend previous research on collar strategies (Schneeweis and Spurgin
[2001] and Szado and Kazemi [2009] as well as the original paper this update is based on) by
considering the performance and risk characteristics of active as well as passive collars. In
addition, we provide an example of the effectiveness of applying a collar strategy to a sample
equity mutual fund on which options are not available. It is worth noting that this study does not
address whether these strategies generate “alpha” based on any specific definition of investor
risk aversion. The significance of the results may be interpreted differently by any individual
based on their particular risk aversion.
In this study the performance of passively implemented collars on the Powershares QQQ
ETF (ticker: QQQQ) is analyzed. The collars are passive in the sense that they follow a rigid set
of rules which do not vary with market conditions. The passive implementations do vary in their
choice of the initial moneyness and time to expiration of the calls and puts. This study also
considers a more active implementation of the collar strategy. Rather than simply applying a set
of fixed rules as for the passive collar, for the active collar adjustment strategy, we apply a set of
rules which adapt the collar to varying economic and market conditions. This approach is similar
to applying a set of tactical asset allocation rules to a set of investments. There are of course an
2
Collars can be visualized as a combination of covered call and protective put strategies. The collar
strategy essentially adds a long protective put to a covered call strategy. This provides the significant
downside protection which the covered call strategy lacks. The purchase of the long put is financed by the
sale of the call. In essence, the collar trades upside participation for downside protection. A tight collar
provides less upside participation and more downside protection than a loose collar. At one extreme, the
tightest collar (ATM puts and calls) effectively immunizes the portfolio from market movements. At the
other extreme (very far OTM puts and calls), the collar is essentially equivalent to a long index position.
3](https://image.slidesharecdn.com/cisdm-qqqactive-full-120804153036-phpapp01/85/Cisdm-qqqactive-full-3-320.jpg)
![unlimited number of conditioning factors that can be used to determine the strategy
implementation. In this paper, for purposes of presentation, we combine three conditioning
factors that have been suggested in academic literature (momentum, volatility, and a compound
macroeconomic factor (unemployment and business cycle)) to generate a dynamic collar
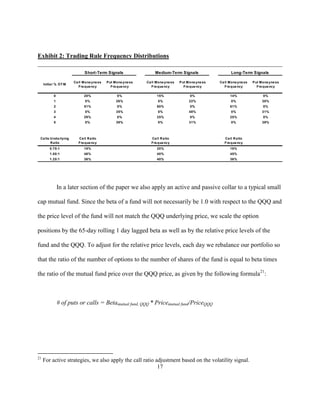
adjusted trading strategy.3 Finally, the study considers the implementation of an active and
passive collar strategy using QQQ options applied to a non-QQQ equity portfolio represented by
a small cap equity mutual fund. This provides an additional analysis of the use of the collar
strategy for a wider range of market participants.
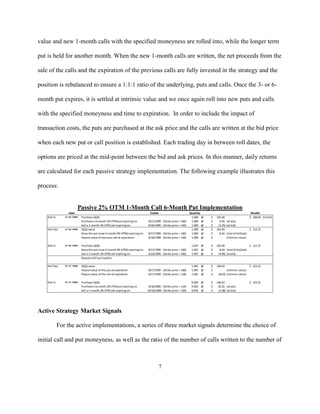
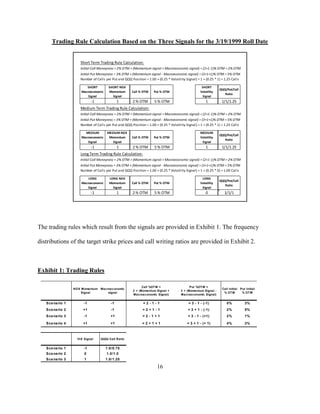
In the following sections we summarize the methodology and data used in this analysis. It
is important to note that all empirical research may be data and time period dependent. The
original analysis in Szado and Schneeweis [2010] covers the period from the introduction of
options on the QQQ (March 19, 1999) through May 31, 2009. This updated analysis covers the
period from March 19, 1999 through September 30, 2010. This period is broken into various sub-
periods to offer a better picture of the benefits and risk of the implemented collar strategies in
various market environments. In the methodology section we describe both the passive and
active collar implementations. In the active collar section we describe how we combine the
momentum, volatility and macroeconomic signals to generate a dynamic collar adjustment
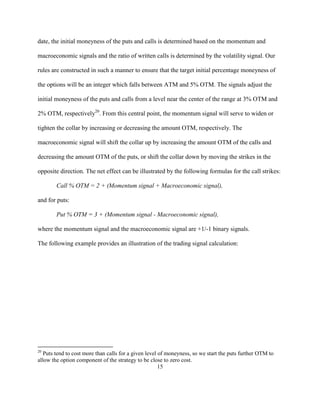
trading strategy process4. In this process, the initial moneyness of the puts and calls is
determined based on the momentum and macroeconomic signals and the ratio of written calls is
determined by the volatility signal. The marginal effect of the momentum signal is to widen or
3
While these collar implementations are active in the sense that the rules are dependent on manager
decisions, they are implemented systematically with no additional manager discretion.
4
While we combine the three signals to generate the strategy, any one of the signals could be used on its
own to generate an active strategy.
4](https://image.slidesharecdn.com/cisdm-qqqactive-full-120804153036-phpapp01/85/Cisdm-qqqactive-full-4-320.jpg)
![puts and QQQ shares purchased, while the initial time to expiration is fixed at one month for the
calls and 6 months for the puts.
Active Collar Adjustment Strategy: Three different sets of active market signals are used for the
strategy implementations, differing by their time horizon; short, medium and long-term. The
three signals are based on momentum, volatility and a compound macroeconomic indicator
(unemployment claims and business cycle), respectively. In order to ensure that the strategies are
investable, all signals use contemporaneously lagged data9.
Momentum Signal: The momentum signal is a simple moving average cross-over (SMACO) of
the NASDAQ-100 index (NDX)10. A SMACO compares a short-term moving average (SMA)
and a long-term moving average (LMA) to determine whether an upward or downward trend
exists. The rule is defined by the number of days covered by each of the moving averages. For
example, a 5/150 SMACO rule compares a 5 day SMA with a 150 day LMA. If the SMA is
greater (less) than the LMA, then an upward (downward) trend indicated, suggesting a buy (sell)
signal. Our choice of signals is based on Szakmary, Davidson, Schwarz [1999] and Lento
[2008]11, which both consider 1/50, 1/150, 5/150, 1/200 and 2/200 SMACO rules on the NDX.
Szakmary et al apply NASDAQ index SMACOs as buy/sell signals for individual stocks for the
period from 1973 to 199112. They find some significant excess returns, although their
significance does not survive transactions costs. Similarly, Lento finds some significant
9
The signals are designed so that they are based only on data which existed prior to the date on which the
signal would have been generated in practice. For example, a signal for the March 19, 1999 option roll-in
date would only use data which existed on March 18, 1999 or earlier.
10
The use of the NDX rather than the QQQ provides us with historical data beyond the introduction of the
QQQ. In this way, we can generate signals from the beginning of the QQQ data series.
11
Additional evidence of the existence of momentum and potential explanations for its existence can be
found in Jegadeesh and Titman [2001] and Schneeweis, Kazemi and Spurgin [2008].
12
In this paper they do not take short positions. They use the signals as in/out position indicators.
8](https://image.slidesharecdn.com/cisdm-qqqactive-full-120804153036-phpapp01/85/Cisdm-qqqactive-full-8-320.jpg)

![Volatility Signal: The volatility signal is based on Renicker and Mallick [2005]. Renicker and
Mallick create an “enhanced” S&P 500 buy-write strategy and back test it over the period from
1997 to September 2005.13 They find excess returns to a strategy which writes 0.75 calls to each
long index position when the markets short-term anxiety level is high (as indicated by a situation
in which the 1-month ATM S&P 500 implied volatility is more than 1 standard deviation above
its current 250-day moving average level), and writes 1.25 calls per index position when the
anxiety level is low (when the 1-month implied volatility is more than 1 standard deviation
below the 250-day average level)14. Their goal in varying the quantity of written calls is to have a
longer exposure to the market in times of high anxiety and shorter exposure in times of
complacency. We make two minor modifications to their strategy. First, we use the daily VIX
close as an indicator of implied volatility levels. Second, we consider a short, medium and long-
term time frame to generate the 3 corresponding signals. In order to match the time frames of our
momentum signals our short, medium and long-term volatility signals use 50, 150 and 250-day
windows respectively. In keeping with the methodology of Renicker and Mallick, on roll dates
we sell 0.75 (1.25) calls per index position when the previous day’s VIX close is more than 1
standard deviation above (below) its current moving average level, otherwise we sell 1 call per
index position as illustrated by the following formula:
# of Calls Written per Long Put and Long QQQ Position = 1 + (0.25 * Volatility Signal),
where the volatility signal is -1, 0 or +1.
13
Note that since the Renicker and Mallick study reported results based on the period used in this study, the use of
this variable is not independent from the period used to analyze its impact on the collar strategy.
14
When the 1-month implied volatility level is within the 1 standard deviation bounds, they follow a
standard 1:1 ratio buy-write.
10](https://image.slidesharecdn.com/cisdm-qqqactive-full-120804153036-phpapp01/85/Cisdm-qqqactive-full-10-320.jpg)
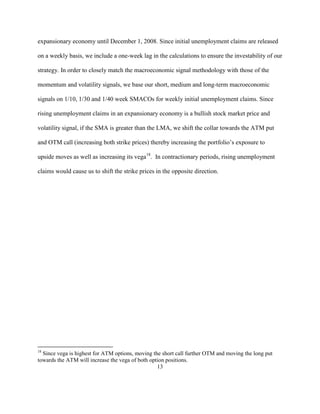
![Macroeconomic Signal: The final variable used in the active collar adjustment strategy signal
process is based on the trend of initial unemployment claims and the state of the economy with
respect to the business cycle. Boyd, Hu and Jagannathan [2005] consider the impact of
unemployment rate surprise on the stock market in the period from 1973 to 2000. They find that
in expansionary periods, stocks typically rise on bad unemployment news, while the opposite
relationship holds in contractionary periods16. This is consistent with Veronesi [1999] which
suggests that bad news in expansionary periods and good news in contractionary periods are
typically correlated with an increase in uncertainty and an increase in the equity risk premium
(corresponding to an increase in expected returns and reduction in current prices). We use these
findings to construct a signal based on initial unemployment claims. The announcements from
the NBER’s Business Cycle Dating Committee are used to identify the state of the business
cycle. It is worth noting that NBER does not define a recession as two consecutive quarters of
negative GDP growth. They define it as follows: “A recession is a significant decline in
economic activity spread across the economy, lasting more than a few months, normally visible
in real GDP, real income, employment, industrial production and wholesale-retail sales”17. These
announcements are generally considered the authority on the current state of the business cycle.
Since there is often a significant delay in announcement dates, we base the signals on
announcement dates to avoid hindsight biases. For example, the December 2007 peak was
announced about one year later on December 1, 2008. Our signal would be based on an
16
These results are somewhat counter-intuitive in the case of expansionary economies. One might expect
rising unemployment to negatively affect stock prices regardless of the business cycle, but the literature
cited above suggests that rising unemployment in expansionary economies causes expected future interest
rates to decline, increasing the value of equities, while rising unemployment in contractions indicates
slower future earnings growth rates, reducing the value of equities.
17
See http://www.nber.org/cycles.html
12](https://image.slidesharecdn.com/cisdm-qqqactive-full-120804153036-phpapp01/85/Cisdm-qqqactive-full-12-320.jpg)


![passive and active approach to collar protection, it is perhaps important to briefly discuss three
issues in option based risk management:
1) The use of alternative approaches to protecting equity investments,
2) the impact of option based strategies on traditional forms of risk comparisons (e.g. Sharpe
Ratio), and
3) the necessity for analyzing results over alternative time periods.
Alternative Approaches to Option Based Risk Management: There are alternative option based
approaches to protecting equity based investments. The most obvious choice is typically the use
of protective puts. Unfortunately, the use of protective puts tends to be a relatively expensive
method of capital protection, especially in periods of high volatility. The existence of a negative
volatility risk premium and the resulting excess returns associated with put writing are indicative
of the potential cost of purchasing protective puts24. Another option based approach is the buy-
write or covered call strategy. The covered call strategy typically entails the writing of call
options against a long underlying index position at a one-to-one ratio. A number of studies have
suggested that covered call writing can provide return enhancement as well as a cushion to
mitigate losses from market downturns. These include Schneeweis and Spurgin [2001], Whaley
[2002] and Hill et al. [2006] which apply the strategy to the S&P 500 and Kapadia and Szado
from Datastream to Bloomberg for some supplemental data.from those options with full data over the life of the
option. The previous study chose the closest strike nearer the ATM whereas the current methodology picks the
closest strike
24
The richness of put prices is not without controversy. While a great deal of literature supports option
richness (particularly for put options), extensive literature debates its existence (for example, see Ungar
and Moran [2009] and Bakshi and Kapadia [2003]).
20](https://image.slidesharecdn.com/cisdm-qqqactive-full-120804153036-phpapp01/85/Cisdm-qqqactive-full-20-320.jpg)
![[2007] which applies the buy-write to a broader index, the Russell 2000. Unfortunately, covered
call writing still leaves an investor exposed to large down moves.
Impact of Option Use on Traditional Risk Measures: It should also be noted that we have
included Sharpe ratios with our other performance measures for the sake of consistency with
previous literature, but great care should be taken in interpreting the Sharpe ratios. First, a
number of the calculated Sharpe ratios are negative. Negative Sharpe ratios are uninformative.
Second, even with positive excess returns, traditional risk-adjusted performance measures such
as the Sharpe ratio and Jensen’s alpha can be misleading. This is particularly true for portfolios
which include option strategies or other strategies which may result in skewed or kurtotic return
distributions. The Sharpe ratio and Jensen’s alpha assume normally distributed returns25. In
recognition of the fact that the return distributions generated by our collar strategies may be non-
normal, we utilize the Stutzer index and Leland’s alpha as measures of risk adjusted
performance. These measures adjust for the fact that investors which exhibit non-increasing
absolute risk aversion prefer positive skewness26. Therefore positively skewed return
distributions should exhibit lower expected returns than negatively skewed distributions, ceteris
paribus.
Alternative Time Period Analysis: This paper does not assume any particular model of investor
risk aversion. The significance of the results for any particular investor may therefore be
dependent on that investor’s individual risk tolerance. Results should therefore be presented over
25
It is also quite possible to manipulate the Sharpe ratio. For example, see Spurgin [2001].
26
See Arditti [1967].
21](https://image.slidesharecdn.com/cisdm-qqqactive-full-120804153036-phpapp01/85/Cisdm-qqqactive-full-21-320.jpg)
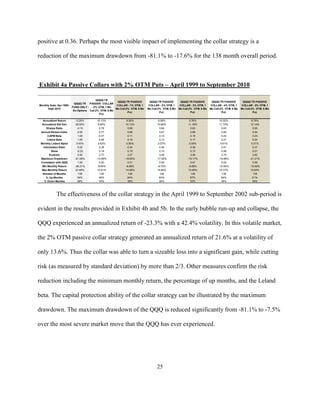
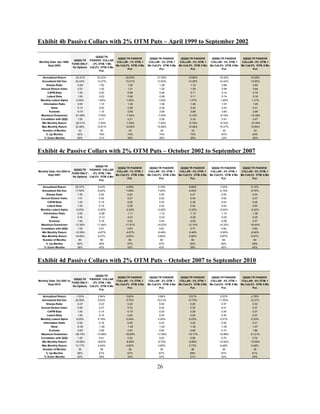
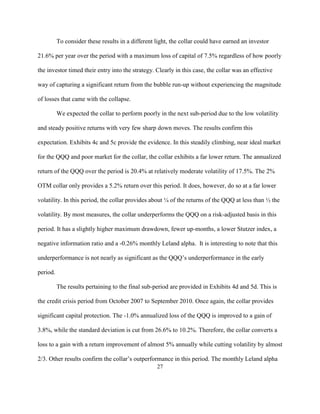
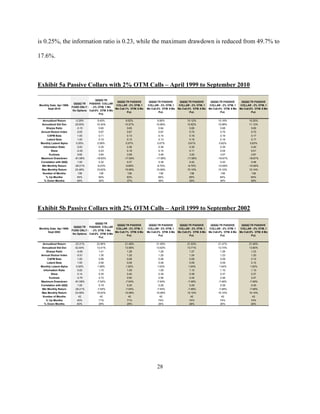
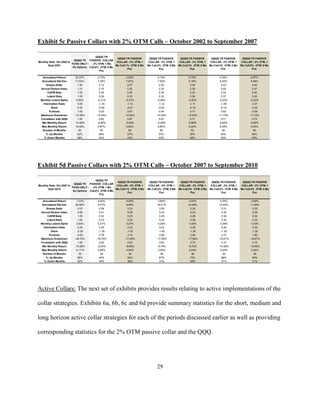
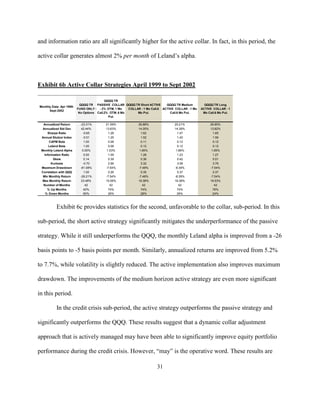
![Empirical Results
Passive Collars: We first consider the performance of passive collar strategies. Our discussion is
centered on 1-month call/6-month put collar strategies28. Results comparing the 1-month call/6-
month put collars to the 1-month call/1-month put collars are provided in Appendix B.
While the exhibits provide statistics for a wide range of collar implementations, our discussion is
focused on the 2% OTM strategies, since they represent a middle ground between the ATM and
the far OTM strategies. Exhibits 4a, 4b, 4c and 4d provide summary statistics for passive 1-
month call/6-month put collar strategies utilizing 2% OTM puts with ATM to 5% OTM calls for
the full period as well as the three sub-periods. Similarly, Exhibits 5a, 5b, 5c and 5d provide
summary statistics for 2% OTM call collars which use ATM to 5% OTM puts. It is immediately
apparent when reviewing the exhibits that, while the performance characteristics of the strategy
are sensitive to the choice of moneyness for the options, they are far more sensitive to the market
environment (rising and/or falling) in which the strategy is implemented. In contrast, the choice
of time to maturity for the calls of 1-month versus 6-month can have a far more significant
impact, as evidenced by the results provided in Appendix B.
The summary statistics for the overall period are provided in Exhibits 4a and 5a. Over the
138 months of the study, the 2% OTM collar significantly reduces risk and improves realized
returns. The returns are improved from a -0.3% annualized loss to a 9.6% gain, meanwhile
standard deviation is reduced by about 2/3 from 29.6% to 10.7%. Similarly, the Stutzer index
increased from 0.05 to 0.67, and the information ratio (relative to the QQQ) for the collar is
28
Previous research indicates that these strategies have typically outperformed 1-month call/1-month put
strategies in the recent past. See, for example Szado and Kazemi [2008].
24](https://image.slidesharecdn.com/cisdm-qqqactive-full-120804153036-phpapp01/85/Cisdm-qqqactive-full-24-320.jpg)
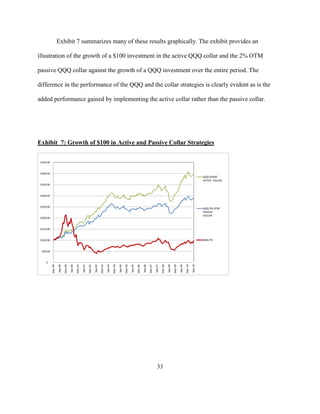
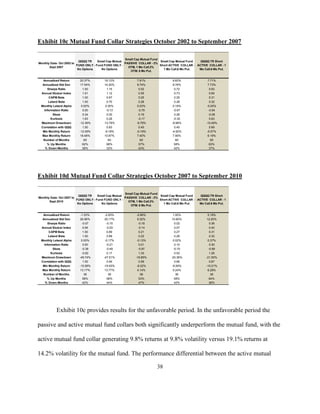
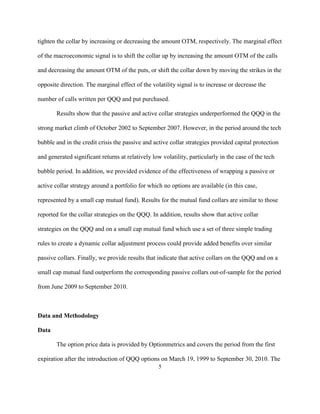
![Exhibit 11: Growth of $100 in Mutual Fund Strategies
$400
$350
Managers Small Cap
Short ACTIVE COLLAR
- 1 Mo Call.6 Mo Put.
$300
$250 Managers Small Cap
PASSIVE COLLAR - 2%
OTM, 1 Mo Call.2%
OTM. 6 Mo Put.
$200
Managers Small Cap
FUND ONLY - No
$150
Options
$100
QQQQ TR FUND ONLY
- No Options
$50
$0
Mar-01
Mar-99
Mar-00
Mar-02
Mar-03
Mar-04
Mar-05
Mar-06
Mar-07
Mar-08
Mar-09
Mar-10
Sep-00
Sep-06
Sep-99
Sep-01
Sep-02
Sep-03
Sep-04
Sep-05
Sep-07
Sep-08
Sep-09
Sep-10
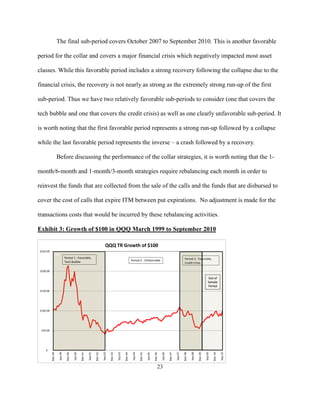
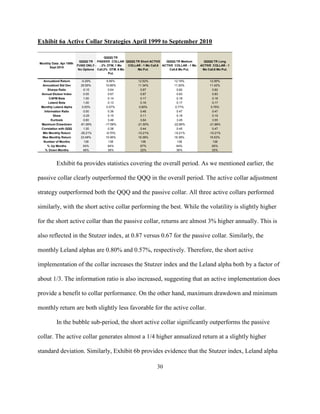
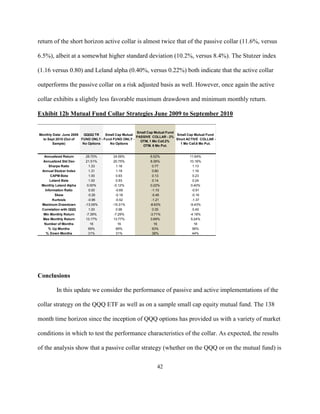
Out-of-Sample Performance of Active Collar Strategy Rules
The analysis in Szado and Schneeweis [2010] covered the period from March 1999 to
May 2009. This update extends the period of analysis by 16 months to September 2010. The
addition of data allows us to consider the performance of the active collar strategies out-of-
sample. Exhibits 12a and 12b provide results covering the out-of-sample period. This period
covers the post-crisis recovery and is an unfavorable period for a collar strategy. Not
surprisingly, the collars underperform the underlying in this period. Exhibit 12a provides results
for the passive QQQ collar in this period. The results indicate that the 2% OTM passive collar
underperforms the QQQ in this period with an 11.4% return versus the 28.7% return of the QQQ,
and a 1.30 Sturzer index versus 1.31 for the QQQ. In contrast, the Leland alpha for the passive
collar is positive at 0.36%.
40](https://image.slidesharecdn.com/cisdm-qqqactive-full-120804153036-phpapp01/85/Cisdm-qqqactive-full-40-320.jpg)


![where λ is the Sharpe ratio.
Thus, if returns are normally distributed, the expected values of the Sharpe ratio and the Stutzer
index are equal. Otherwise, the Stutzer index penalizes high kurtosis and negative skewness.
Leland’s Alpha and Beta
Leland’s (1999) alpha and beta assume that market returns are normal but allow for non-
normality in security or portfolio returns. Consistent with the Stutzer index, Leland’s measures
reflect the preference for low kurtosis and positive skewness.
Utilizing Rubinstein’s (1976) equilibrium pricing equation,
where ρ[x,y] is the correlation of x and y, and –b is the exponent of the average investor’s
marginal utility function, Leland models portfolio returns as:
where Leland’s beta is given by:
and b is a market price of risk. If market returns are normally distributed, b is given by:
Thus, the Leland alpha follows:
47](https://image.slidesharecdn.com/cisdm-qqqactive-full-120804153036-phpapp01/85/Cisdm-qqqactive-full-47-320.jpg)