SlideShare a Scribd company logo
1 of 3
Download to read offline
Part of State Street’s Vision Thought Leadership Series
SSgA CAPITALINSIGHTS EXCHANGE
EMU Managed Volatility
A ‘managed volatility’ approach seeks to provide competitive
returns and maintain low volatility, in each case compared to the
specified benchmark index, over the long term by constructing
a portfolio of stocks with low expected volatility relative to the
Index. We have tested the strategy in the EMU zone and find
that the Sharpe ratio and risk adjusted return are improved.
The Relationship Between Risk and Return
Markovitz’s theory of mean-variance optimisation1
and
Sharpe’s Capital Asset Pricing Model (CAPM)2
are two of
the most influential papers on investment theory to have
been published in the last century. Both papers model the
relationship between expected investment return and risk,
the key message being that there is no free lunch in the
investment world: the more risk you take on, the higher the
expected return.
According to Sharpe, in equilibrium, security prices adjust so
that expected return is an increasing linear function of risk
(with the risk of a security measured by its beta – exposure
to the market capitalisation-weighted portfolio). Yet Sharpe’s
finding has been challenged by empirical evidence: risk is not
perfectly correlated with returns and higher-risk (higher-beta)
stocks have actually not delivered higher average returns
over time.
1. Markowitz, H.M. (1952) Portfolio Selection.
2. Sharpe, W.F. (1964) Capital Asset Prices: A Theory of Market Equilibrium
Under Conditions of Risk.
Like Sharpe, Markovitz also believed that equity returns
increase with risk. As shown in Chart 1, Markovitz developed
a ‘mean-variance’ framework in which efficient portfolios
maximise expected return for any given level of risk (volatility).
A significant drawback of this model is that efficient portfolios
tend to be highly sensitive to input data i.e. the expected
return of each individual asset class and the covariance matrix
(which captures how assets are expected to move relative to
one another). As a result, minor changes in inputs can lead to
significant changes in the composition of the efficient portfolio.
Chart 1: Markovitz’s Efficient Frontier
Most efficient portfolios are highly sensitive to input data.
However, calculating expected returns is a difficult exercise
that can result in significant estimation errors. In contrast, risk
models tend to exhibit smaller and less frequent differences
between estimated and actual outcomes.
One portfolio on Markovitz’s efficient frontier – the ‘minimum
variance’ portfolio – does not require expected returns as an
input parameter. Instead it relies only on risk characteristics,
which are generally easier to forecast than expected returns.
This portfolio therefore uses the most reliable data in the
Markowitz framework.
Co-authored by: Selim Dekali Portfolio Manager, Index Equity
Frédéric P. Jamet Head of Investments, SSgA France
Return
Risk
Market Portfolio
Minimum-Variance Portfolio
SSSSSSggAA CACAPIPITATALL ININSISIGHGHTSSTS ||| EMU MANAGED VOLATILITY
Why Adopt a Managed Volatility Approach?
In the recent financial crisis, investors clearly demonstrated
their asymmetric risk tolerance to negative returns (i.e. higher
aversion to downside risk). In response to these heightened
concerns, strategies that seek to limit the downside risk in
investment portfolios, while still maintaining potential returns,
have become increasingly popular.
In the context of controlling risk independently from
returns, the managed volatility portfolio is an appealing
investment approach.
Managing volatility in eurozone portfolios is a particularly
interesting case given the absence of currency risk and thus
the need to quantify that risk in the investment process.
Simulating a Managed Volatility Strategy1
We conducted a simulation to compare the returns and
volatility of a managed volatility portfolio with those of the
market-cap-weighted MSCI EMU Index for the period
1999–2010. For the managed volatility portfolio we set
the following parameters:
25% Maximum absolute sector weight
10% Maximum absolute industry weight
2% Maximum holding on trade initiation
2.5% Maximum holding cap
20% Average daily volume constraint on trades
3% Country exposure deviation relative to the benchmark
As shown in Chart 2, the managed volatility portfolio (EMU
Managed Volatility) is shown to generate a higher Sharpe Ratio
for the period studied. The managed volatility portfolio recorded
volatility more than 28% lower than that of the index and
provided competitive risk adjusted return compared to the index.
Chart 2: Higher Returns and Lower Volatility from an Absolute
Approach to Managed Volatility Investing
The simulation time frame includes some particularly
interesting periods, as shown in Chart 3. During the technology
(‘dot.com’) bubble in 1999–2002, the managed volatility
strategy’s participation to both the upside and the downside
was significantly less relative to the MSCI EMU Index. As such,
risk, as measured by volatility, was reduced.
It is important to understand that while the return of a managed
volatility strategy has the potential to be materially greater than
the cap-weighted equity benchmark over certain periods,
particularly those periods consisting of multiple bear markets
such as those experienced during the first decade of the 21st
century, investors should not expect the return to be materially
greater than the cap-weighted benchmark over the long term.
2
28%
4%
24%
-18%
-33%
20%
13%
26%
23%
-45%
3%
31%
-34%
15%
7%
-7%
-17%
21%
32%
11%
30%
-1%
36%
10%
-50%
-40%
-30%
-20%
-10%
0%
10%
20%
30%
40%
1999 2000 2001 2002 2003 2004 2005 2006 2007 2008 2009 2010
Percentage
EMU Managed Volume
MSCI EMU
Chart 3: Simulated Managed Volatility Portfolio – Performance Over Time
EMU Managed
Volatility
MSCI
EMU Index
Difference
1 Year Return 10.77% 2.77% 8.00%
3 Years Return -3.10% -9.70% 6.60%
5 Years Return 4.43% -0.21% 4.64%
12 Years Return
(Since Inception)
7.63% 1.96% 5.67%
Volatility 16.52% 23.19% -6.67%
Volatility
Reduction
– – -28.77%
Sharpe Ratio 0.27 -0.05 0.32
Source: Axioma, SSgA, Performance in Euro
SSgA Capital Insights is an integrated thought leadership program
designed to educate clients on timely investment and market
topics. As part of State Street’s Vision thought leadership series,
the SSgA Capital Insights program gives clients access to the
expertise and viewpoints of SSgA’s thought leaders and investment
talent via a variety of multimedia channels.
Since 2006, State Street’s Vision series has been distilling
our distinct research, perspective and opinions on key themes
impacting institutional investors worldwide into publications for
our customers around the world.
This material is for your private information.
The views expressed are the views of State Street Global Advisors only through the period
ended 1 July 2011 and are subject to change based on market and other conditions. The
information we provide does not constitute investment advice and it should not be relied on
as such. It should not be considered a solicitation to buy or an offer to sell a security. It does
not take into account any investor’s particular investment objectives, strategies, tax status or
investment horizon. We encourage you to consult your tax or financial advisor. All material
has been obtained from sources believed to be reliable, but its accuracy is not guaranteed.
There is no representation or warranty as to the current accuracy of, nor liability for, decisions
based on such information. This document contains certain statements that may be
deemed forward-looking statements. These statements are based on certain assumptions
and analyses made by SSgA in light of its experience and perception of historical trends,
current conditions, expected future developments and other factors it believes appropriate
in the circumstances. Past performance is no guarantee of future results.
MSCI Indices are trademarks of MSCI, Inc.
©2011 State Street Corporation EUMKT-1049 Exp. Date: 07/31/2012
Chart 4 shows that, as expected, the simulated portfolio
is biased towards stocks with a low beta (given their lower
volatility than high beta stocks). Over the simulation time frame,
the portfolio’s beta ranges between 0.5 and 0.8. As at the end
of December 2010, the portfolio was overweight in Health Care
and Consumer Staples (i.e. defensive stocks) and underweight
in Materials (i.e. cyclical stocks).
Conclusion
For investors in the eurozone equity markets, risk-reduction
strategies based on the concept of managed volatility hold a
number of attractions. Given their objective of limiting downside
risk, they may be particularly appealing as the growth portfolio
of a broader liability-driven investment solution.
Investors have shown considerable interest in strategies that
focus on risk reduction. The simulation of an EMU managed
volatility portfolio versus the MSCI EMU Index featured provide
interesting results for the period studied on a risk and risk-
adjusted return basis.
SSSSSSggAA CACAPIPITATALL ININSISIGHGHTSSTS ||| EMU MANAGED VOLATILITY
0% 10% 20% 30% 40% 50% 60%
1 (1.85)
2 (1.45)
3 (1.35)
4 (1.2)
5 (1.05)
6 (0.95)
7 (0.9)
8 (0.85)
9 (0.75)
10 (0.45)
BetaDecile
EMU Managed Volume MSCI EMU
Chart 4: Decile of Beta Exposure of Simulated EMU Managed
Volatility and MSCI EMU (as of December 2010)
Axioma European Fundamental Factor Risk Model
Source: Axioma, SSgA
DISCLAIMER
1
Europe Managed Volatility Performance:
Returns are simulated from January 4, 1999 to December 31, 2010 and assume 30bp transaction costs each way. Turnover was approximately 20% annually (one-way), with quarterly rebalancing.
The results shown do not represent the results of actual trading using client assets but were achieved by means of the retroactive application of a model that was designed with the benefit of
hindsight. The simulated performance was compiled after the end of the period depicted and does not represent the actual investment decisions of the advisor. These results do not reflect the effect
of material economic and market factors on decision making.
The simulated performance data is reported on a gross of fees basis, and gross of administrative costs. Additional fees, such as the advisory fee, would reduce the return. For example, if an
annualized gross return of 10% was achieved over a 5-year period and a management fee of 1% per year was charged and deducted annually, then the resulting return would be reduced from 61%
to 54%. The performance includes the reinvestment of dividends and other corporate earnings and is calculated in Euro.
The simulated performance is not necessarily indicative of future performance, which could differ substantially. The benchmark used is the MSCI Europe Index. The index returns are unmanaged
and do not reflect the deduction of any fees or expenses. The index returns reflect all items of income, gain and loss and the reinvestment of dividends and other income. All trademarks are property
of their respective owners.
The strategy described may be executed in a commingled fund managed by SSgA which is not insured by the FDIC or by another governmental agency; it is not an obligation of the FDIC nor is it
a deposit or obligation of or guaranteed by State Street Bank and Trust Company. All SSgA commingled funds pay State Street Bank and Trust Company for services as custodian, transfer agent,
and shareholder servicing agent and may pay affiliates of State Street Bank and Trust Company for investment advisory services.
Not all products will be available to all investors, please contact SSgA for further information regarding this strategy.
The performance information should not be shown without these accompanying notes.
Backtest Creation: The testing methodology used the Axioma European Fundamental Factor Risk Model, and Axioma optimization model to generate historical portfolios. The data used was only
that data which would have been available at the time when the historical portfolios were generated, not what is available now. These processes help to eliminate various forms of survivorship bias,
both in terms of a “smarter model” and in terms of making decisions based on information that was not available at the time.
Quarterly portfolios were created, and returns are the result of a buy and hold assumption on each of these portfolios. Transaction costs were assumed as stated above.
This Europe Managed Volatility process was backtested in May 2011.

More Related Content

What's hot

Intro To VaR, Distributions, KRIs And Logic Test
Intro To VaR, Distributions, KRIs And Logic TestIntro To VaR, Distributions, KRIs And Logic Test
Intro To VaR, Distributions, KRIs And Logic TestJon Beckett
 
Midcap Category – riskier than largecaps but outperform over long run
Midcap Category – riskier than largecaps but outperform over long runMidcap Category – riskier than largecaps but outperform over long run
Midcap Category – riskier than largecaps but outperform over long runDhuraivel Gunasekaran
 
N Trust Investment Client Presentation 150409
N Trust Investment Client Presentation 150409N Trust Investment Client Presentation 150409
N Trust Investment Client Presentation 150409Chris Wicks CFP
 
Express measurement of market volatility using ergodicity concept
Express measurement of market volatility using ergodicity conceptExpress measurement of market volatility using ergodicity concept
Express measurement of market volatility using ergodicity conceptJack Sarkissian
 
Financial Economics Essay Maxwell Mayhew 2015
Financial Economics Essay Maxwell Mayhew 2015Financial Economics Essay Maxwell Mayhew 2015
Financial Economics Essay Maxwell Mayhew 2015Max Mayhew
 
Marginal Efficiency Of Investment(Mei) Revised Feb 2011
Marginal Efficiency Of Investment(Mei) Revised Feb 2011Marginal Efficiency Of Investment(Mei) Revised Feb 2011
Marginal Efficiency Of Investment(Mei) Revised Feb 2011Gary Crosbie
 
Performance persistence brown_goetzmann
Performance persistence brown_goetzmannPerformance persistence brown_goetzmann
Performance persistence brown_goetzmannbfmresearch
 
Risk And Return Of Security And Portfolio
Risk And Return Of Security And PortfolioRisk And Return Of Security And Portfolio
Risk And Return Of Security And Portfolioshekhar sharma
 
Visualizing the Effects of Holding Period and Data Window on Calculations of ...
Visualizing the Effects of Holding Period and Data Window on Calculations of ...Visualizing the Effects of Holding Period and Data Window on Calculations of ...
Visualizing the Effects of Holding Period and Data Window on Calculations of ...Ralph Goldsticker
 
Vol article
Vol articleVol article
Vol articlewrefai
 
ERM Risk Regime and IFRS17
ERM Risk Regime and IFRS17ERM Risk Regime and IFRS17
ERM Risk Regime and IFRS17Syed Danish Ali
 
Market ultimate profitability - ENEC 2010 proceedings
Market ultimate profitability - ENEC 2010 proceedingsMarket ultimate profitability - ENEC 2010 proceedings
Market ultimate profitability - ENEC 2010 proceedingsAlexei Kazakov
 

What's hot (19)

Intro To VaR, Distributions, KRIs And Logic Test
Intro To VaR, Distributions, KRIs And Logic TestIntro To VaR, Distributions, KRIs And Logic Test
Intro To VaR, Distributions, KRIs And Logic Test
 
Midcap Category – riskier than largecaps but outperform over long run
Midcap Category – riskier than largecaps but outperform over long runMidcap Category – riskier than largecaps but outperform over long run
Midcap Category – riskier than largecaps but outperform over long run
 
Cerra
CerraCerra
Cerra
 
N Trust Investment Client Presentation 150409
N Trust Investment Client Presentation 150409N Trust Investment Client Presentation 150409
N Trust Investment Client Presentation 150409
 
Dfa and the error term 12-2001
Dfa and the error term 12-2001Dfa and the error term 12-2001
Dfa and the error term 12-2001
 
Express measurement of market volatility using ergodicity concept
Express measurement of market volatility using ergodicity conceptExpress measurement of market volatility using ergodicity concept
Express measurement of market volatility using ergodicity concept
 
Financial Economics Essay Maxwell Mayhew 2015
Financial Economics Essay Maxwell Mayhew 2015Financial Economics Essay Maxwell Mayhew 2015
Financial Economics Essay Maxwell Mayhew 2015
 
Risk and return
Risk and returnRisk and return
Risk and return
 
Marginal Efficiency Of Investment(Mei) Revised Feb 2011
Marginal Efficiency Of Investment(Mei) Revised Feb 2011Marginal Efficiency Of Investment(Mei) Revised Feb 2011
Marginal Efficiency Of Investment(Mei) Revised Feb 2011
 
Performance persistence brown_goetzmann
Performance persistence brown_goetzmannPerformance persistence brown_goetzmann
Performance persistence brown_goetzmann
 
Risk And Return Of Security And Portfolio
Risk And Return Of Security And PortfolioRisk And Return Of Security And Portfolio
Risk And Return Of Security And Portfolio
 
APT portfolio mnagmnt
APT portfolio mnagmntAPT portfolio mnagmnt
APT portfolio mnagmnt
 
Visualizing the Effects of Holding Period and Data Window on Calculations of ...
Visualizing the Effects of Holding Period and Data Window on Calculations of ...Visualizing the Effects of Holding Period and Data Window on Calculations of ...
Visualizing the Effects of Holding Period and Data Window on Calculations of ...
 
Vol article
Vol articleVol article
Vol article
 
CAPM 1.1
CAPM 1.1CAPM 1.1
CAPM 1.1
 
ERM Risk Regime and IFRS17
ERM Risk Regime and IFRS17ERM Risk Regime and IFRS17
ERM Risk Regime and IFRS17
 
Case listed equity
Case listed equityCase listed equity
Case listed equity
 
Market ultimate profitability - ENEC 2010 proceedings
Market ultimate profitability - ENEC 2010 proceedingsMarket ultimate profitability - ENEC 2010 proceedings
Market ultimate profitability - ENEC 2010 proceedings
 
Fact sheets may 2020 pdf
Fact sheets may 2020 pdfFact sheets may 2020 pdf
Fact sheets may 2020 pdf
 

Viewers also liked

Indian education system challenges
Indian education system challenges Indian education system challenges
Indian education system challenges Swaraj93Mane
 
Introdução à gestão de pessoas psicologia organizacional
Introdução à gestão de pessoas   psicologia organizacionalIntrodução à gestão de pessoas   psicologia organizacional
Introdução à gestão de pessoas psicologia organizacionalKarina Bruna
 
Ejercicios Propuestos. EDII
Ejercicios Propuestos. EDIIEjercicios Propuestos. EDII
Ejercicios Propuestos. EDIIDaniloUrdaneta
 
Portafolio estudiantil
Portafolio estudiantilPortafolio estudiantil
Portafolio estudiantilJexon Zaicel
 
Presentacion resumen lizarzaburu
Presentacion resumen lizarzaburuPresentacion resumen lizarzaburu
Presentacion resumen lizarzaburuJohNPibE
 
Social Media for Inventors Society of South Florida (ISSF)
Social Media for Inventors Society of South Florida (ISSF)Social Media for Inventors Society of South Florida (ISSF)
Social Media for Inventors Society of South Florida (ISSF)Digital Compass
 
El plan de ordenamiento territorial de Tunja Boyacá
El plan de ordenamiento territorial de Tunja BoyacáEl plan de ordenamiento territorial de Tunja Boyacá
El plan de ordenamiento territorial de Tunja BoyacáAlesoad924
 
How To Plan A Campaign: Strategic Planning Process & Cross-Culture Campaign P...
How To Plan A Campaign: Strategic Planning Process & Cross-Culture Campaign P...How To Plan A Campaign: Strategic Planning Process & Cross-Culture Campaign P...
How To Plan A Campaign: Strategic Planning Process & Cross-Culture Campaign P...BFA
 
Abhimanyu Roy Recent Resume
Abhimanyu Roy Recent ResumeAbhimanyu Roy Recent Resume
Abhimanyu Roy Recent ResumeAbhimanyu Roy
 
Alpha Pam Informe Medico Can Picafort 28 Febrero
Alpha Pam Informe Medico Can Picafort 28 FebreroAlpha Pam Informe Medico Can Picafort 28 Febrero
Alpha Pam Informe Medico Can Picafort 28 FebreroPintiparada
 

Viewers also liked (16)

Indian education system challenges
Indian education system challenges Indian education system challenges
Indian education system challenges
 
Introdução à gestão de pessoas psicologia organizacional
Introdução à gestão de pessoas   psicologia organizacionalIntrodução à gestão de pessoas   psicologia organizacional
Introdução à gestão de pessoas psicologia organizacional
 
online diamond jewellery store
online diamond jewellery storeonline diamond jewellery store
online diamond jewellery store
 
Ejercicios Propuestos. EDII
Ejercicios Propuestos. EDIIEjercicios Propuestos. EDII
Ejercicios Propuestos. EDII
 
Evaluaciones
EvaluacionesEvaluaciones
Evaluaciones
 
Dzfewf
DzfewfDzfewf
Dzfewf
 
Portafolio estudiantil
Portafolio estudiantilPortafolio estudiantil
Portafolio estudiantil
 
Asean project
Asean projectAsean project
Asean project
 
Presentacion resumen lizarzaburu
Presentacion resumen lizarzaburuPresentacion resumen lizarzaburu
Presentacion resumen lizarzaburu
 
Social Media for Inventors Society of South Florida (ISSF)
Social Media for Inventors Society of South Florida (ISSF)Social Media for Inventors Society of South Florida (ISSF)
Social Media for Inventors Society of South Florida (ISSF)
 
Klebsiella
KlebsiellaKlebsiella
Klebsiella
 
El plan de ordenamiento territorial de Tunja Boyacá
El plan de ordenamiento territorial de Tunja BoyacáEl plan de ordenamiento territorial de Tunja Boyacá
El plan de ordenamiento territorial de Tunja Boyacá
 
How To Plan A Campaign: Strategic Planning Process & Cross-Culture Campaign P...
How To Plan A Campaign: Strategic Planning Process & Cross-Culture Campaign P...How To Plan A Campaign: Strategic Planning Process & Cross-Culture Campaign P...
How To Plan A Campaign: Strategic Planning Process & Cross-Culture Campaign P...
 
Escherichia coli
Escherichia coliEscherichia coli
Escherichia coli
 
Abhimanyu Roy Recent Resume
Abhimanyu Roy Recent ResumeAbhimanyu Roy Recent Resume
Abhimanyu Roy Recent Resume
 
Alpha Pam Informe Medico Can Picafort 28 Febrero
Alpha Pam Informe Medico Can Picafort 28 FebreroAlpha Pam Informe Medico Can Picafort 28 Febrero
Alpha Pam Informe Medico Can Picafort 28 Febrero
 

Similar to 2011 EMU Managed Volatility

2012 what drives value tilt portfolios overperformance
2012 what drives value tilt portfolios overperformance2012 what drives value tilt portfolios overperformance
2012 what drives value tilt portfolios overperformanceFrederic Jamet
 
Introducing-the-Two-Sigma-Factor-Lens.10.18.pdf
Introducing-the-Two-Sigma-Factor-Lens.10.18.pdfIntroducing-the-Two-Sigma-Factor-Lens.10.18.pdf
Introducing-the-Two-Sigma-Factor-Lens.10.18.pdfClarenceTee1
 
[EN] The use of convertible bonds in the asset allocation process
[EN] The use of convertible bonds in the asset allocation process[EN] The use of convertible bonds in the asset allocation process
[EN] The use of convertible bonds in the asset allocation processNN Investment Partners
 
[LU] Mindscope / The use of convertible bonds in the asset allocation process
[LU] Mindscope / The use of convertible bonds in the asset allocation process[LU] Mindscope / The use of convertible bonds in the asset allocation process
[LU] Mindscope / The use of convertible bonds in the asset allocation processNN Investment Partners
 
[LATAM EN] The use of convertible bonds in the asset allocation process
[LATAM EN] The use of convertible bonds in the asset allocation process[LATAM EN] The use of convertible bonds in the asset allocation process
[LATAM EN] The use of convertible bonds in the asset allocation processNN Investment Partners
 
[UK] The use of convertible bonds in the asset allocation process
[UK] The use of convertible bonds in the asset allocation process[UK] The use of convertible bonds in the asset allocation process
[UK] The use of convertible bonds in the asset allocation processNN Investment Partners
 
[CH] The use of convertible bonds in the asset allocation process
[CH] The use of convertible bonds in the asset allocation process[CH] The use of convertible bonds in the asset allocation process
[CH] The use of convertible bonds in the asset allocation processNN Investment Partners
 
[JP] The use of convertible bonds in the asset allocation process
[JP] The use of convertible bonds in the asset allocation process[JP] The use of convertible bonds in the asset allocation process
[JP] The use of convertible bonds in the asset allocation processNN Investment Partners
 
capital asset pricing model
capital asset pricing modelcapital asset pricing model
capital asset pricing modelAditya Mehta
 
Global Value Equity Portfolio (March 2011)
Global Value Equity Portfolio (March 2011)Global Value Equity Portfolio (March 2011)
Global Value Equity Portfolio (March 2011)Trading Floor
 
Parametric perspectives-winter-2010 (1)
Parametric perspectives-winter-2010 (1)Parametric perspectives-winter-2010 (1)
Parametric perspectives-winter-2010 (1)Kola Wade
 
Redington and Societe Generale CIB - Equity Hedging for UK Pension Funds - Ma...
Redington and Societe Generale CIB - Equity Hedging for UK Pension Funds - Ma...Redington and Societe Generale CIB - Equity Hedging for UK Pension Funds - Ma...
Redington and Societe Generale CIB - Equity Hedging for UK Pension Funds - Ma...Redington
 
Risk returns analysis
Risk returns analysisRisk returns analysis
Risk returns analysisJoseph Ukpong
 
2010 Currency Hedging in World Index Equity Fund
2010 Currency Hedging in World Index Equity Fund2010 Currency Hedging in World Index Equity Fund
2010 Currency Hedging in World Index Equity FundFrederic Jamet
 
Quant BC Fund
Quant BC FundQuant BC Fund
Quant BC Fundbalthakre
 
AIAR Winter 2015 - Henry Ma Adaptive Invest Approach
AIAR Winter 2015 - Henry Ma Adaptive Invest ApproachAIAR Winter 2015 - Henry Ma Adaptive Invest Approach
AIAR Winter 2015 - Henry Ma Adaptive Invest ApproachHenry Ma
 
Managing Risk In A Complex World - Bob Maynard
Managing Risk In A Complex World - Bob MaynardManaging Risk In A Complex World - Bob Maynard
Managing Risk In A Complex World - Bob MaynardTrading Game Pty Ltd
 

Similar to 2011 EMU Managed Volatility (20)

2012 what drives value tilt portfolios overperformance
2012 what drives value tilt portfolios overperformance2012 what drives value tilt portfolios overperformance
2012 what drives value tilt portfolios overperformance
 
Cs turbulence
Cs turbulenceCs turbulence
Cs turbulence
 
Introducing-the-Two-Sigma-Factor-Lens.10.18.pdf
Introducing-the-Two-Sigma-Factor-Lens.10.18.pdfIntroducing-the-Two-Sigma-Factor-Lens.10.18.pdf
Introducing-the-Two-Sigma-Factor-Lens.10.18.pdf
 
[EN] The use of convertible bonds in the asset allocation process
[EN] The use of convertible bonds in the asset allocation process[EN] The use of convertible bonds in the asset allocation process
[EN] The use of convertible bonds in the asset allocation process
 
[LU] Mindscope / The use of convertible bonds in the asset allocation process
[LU] Mindscope / The use of convertible bonds in the asset allocation process[LU] Mindscope / The use of convertible bonds in the asset allocation process
[LU] Mindscope / The use of convertible bonds in the asset allocation process
 
[LATAM EN] The use of convertible bonds in the asset allocation process
[LATAM EN] The use of convertible bonds in the asset allocation process[LATAM EN] The use of convertible bonds in the asset allocation process
[LATAM EN] The use of convertible bonds in the asset allocation process
 
[UK] The use of convertible bonds in the asset allocation process
[UK] The use of convertible bonds in the asset allocation process[UK] The use of convertible bonds in the asset allocation process
[UK] The use of convertible bonds in the asset allocation process
 
[CH] The use of convertible bonds in the asset allocation process
[CH] The use of convertible bonds in the asset allocation process[CH] The use of convertible bonds in the asset allocation process
[CH] The use of convertible bonds in the asset allocation process
 
[JP] The use of convertible bonds in the asset allocation process
[JP] The use of convertible bonds in the asset allocation process[JP] The use of convertible bonds in the asset allocation process
[JP] The use of convertible bonds in the asset allocation process
 
IPE Article
IPE ArticleIPE Article
IPE Article
 
capital asset pricing model
capital asset pricing modelcapital asset pricing model
capital asset pricing model
 
Global Value Equity Portfolio (March 2011)
Global Value Equity Portfolio (March 2011)Global Value Equity Portfolio (March 2011)
Global Value Equity Portfolio (March 2011)
 
Parametric perspectives-winter-2010 (1)
Parametric perspectives-winter-2010 (1)Parametric perspectives-winter-2010 (1)
Parametric perspectives-winter-2010 (1)
 
Redington and Societe Generale CIB - Equity Hedging for UK Pension Funds - Ma...
Redington and Societe Generale CIB - Equity Hedging for UK Pension Funds - Ma...Redington and Societe Generale CIB - Equity Hedging for UK Pension Funds - Ma...
Redington and Societe Generale CIB - Equity Hedging for UK Pension Funds - Ma...
 
Risk returns analysis
Risk returns analysisRisk returns analysis
Risk returns analysis
 
2010 Currency Hedging in World Index Equity Fund
2010 Currency Hedging in World Index Equity Fund2010 Currency Hedging in World Index Equity Fund
2010 Currency Hedging in World Index Equity Fund
 
An introduction to asset
An introduction to assetAn introduction to asset
An introduction to asset
 
Quant BC Fund
Quant BC FundQuant BC Fund
Quant BC Fund
 
AIAR Winter 2015 - Henry Ma Adaptive Invest Approach
AIAR Winter 2015 - Henry Ma Adaptive Invest ApproachAIAR Winter 2015 - Henry Ma Adaptive Invest Approach
AIAR Winter 2015 - Henry Ma Adaptive Invest Approach
 
Managing Risk In A Complex World - Bob Maynard
Managing Risk In A Complex World - Bob MaynardManaging Risk In A Complex World - Bob Maynard
Managing Risk In A Complex World - Bob Maynard
 

Recently uploaded

05_Annelore Lenoir_Docbyte_MeetupDora&Cybersecurity.pptx
05_Annelore Lenoir_Docbyte_MeetupDora&Cybersecurity.pptx05_Annelore Lenoir_Docbyte_MeetupDora&Cybersecurity.pptx
05_Annelore Lenoir_Docbyte_MeetupDora&Cybersecurity.pptxFinTech Belgium
 
TEST BANK For Corporate Finance, 13th Edition By Stephen Ross, Randolph Weste...
TEST BANK For Corporate Finance, 13th Edition By Stephen Ross, Randolph Weste...TEST BANK For Corporate Finance, 13th Edition By Stephen Ross, Randolph Weste...
TEST BANK For Corporate Finance, 13th Edition By Stephen Ross, Randolph Weste...ssifa0344
 
VIP Kolkata Call Girl Jodhpur Park 👉 8250192130 Available With Room
VIP Kolkata Call Girl Jodhpur Park 👉 8250192130  Available With RoomVIP Kolkata Call Girl Jodhpur Park 👉 8250192130  Available With Room
VIP Kolkata Call Girl Jodhpur Park 👉 8250192130 Available With Roomdivyansh0kumar0
 
Q3 2024 Earnings Conference Call and Webcast Slides
Q3 2024 Earnings Conference Call and Webcast SlidesQ3 2024 Earnings Conference Call and Webcast Slides
Q3 2024 Earnings Conference Call and Webcast SlidesMarketing847413
 
Independent Lucknow Call Girls 8923113531WhatsApp Lucknow Call Girls make you...
Independent Lucknow Call Girls 8923113531WhatsApp Lucknow Call Girls make you...Independent Lucknow Call Girls 8923113531WhatsApp Lucknow Call Girls make you...
Independent Lucknow Call Girls 8923113531WhatsApp Lucknow Call Girls make you...makika9823
 
Bladex Earnings Call Presentation 1Q2024
Bladex Earnings Call Presentation 1Q2024Bladex Earnings Call Presentation 1Q2024
Bladex Earnings Call Presentation 1Q2024Bladex
 
Instant Issue Debit Cards - School Designs
Instant Issue Debit Cards - School DesignsInstant Issue Debit Cards - School Designs
Instant Issue Debit Cards - School Designsegoetzinger
 
Dividend Policy and Dividend Decision Theories.pptx
Dividend Policy and Dividend Decision Theories.pptxDividend Policy and Dividend Decision Theories.pptx
Dividend Policy and Dividend Decision Theories.pptxanshikagoel52
 
(ANIKA) Budhwar Peth Call Girls Just Call 7001035870 [ Cash on Delivery ] Pun...
(ANIKA) Budhwar Peth Call Girls Just Call 7001035870 [ Cash on Delivery ] Pun...(ANIKA) Budhwar Peth Call Girls Just Call 7001035870 [ Cash on Delivery ] Pun...
(ANIKA) Budhwar Peth Call Girls Just Call 7001035870 [ Cash on Delivery ] Pun...ranjana rawat
 
High Class Call Girls Nashik Maya 7001305949 Independent Escort Service Nashik
High Class Call Girls Nashik Maya 7001305949 Independent Escort Service NashikHigh Class Call Girls Nashik Maya 7001305949 Independent Escort Service Nashik
High Class Call Girls Nashik Maya 7001305949 Independent Escort Service NashikCall Girls in Nagpur High Profile
 
Call US 📞 9892124323 ✅ Kurla Call Girls In Kurla ( Mumbai ) secure service
Call US 📞 9892124323 ✅ Kurla Call Girls In Kurla ( Mumbai ) secure serviceCall US 📞 9892124323 ✅ Kurla Call Girls In Kurla ( Mumbai ) secure service
Call US 📞 9892124323 ✅ Kurla Call Girls In Kurla ( Mumbai ) secure servicePooja Nehwal
 
VVIP Pune Call Girls Katraj (7001035870) Pune Escorts Nearby with Complete Sa...
VVIP Pune Call Girls Katraj (7001035870) Pune Escorts Nearby with Complete Sa...VVIP Pune Call Girls Katraj (7001035870) Pune Escorts Nearby with Complete Sa...
VVIP Pune Call Girls Katraj (7001035870) Pune Escorts Nearby with Complete Sa...Call Girls in Nagpur High Profile
 
20240429 Calibre April 2024 Investor Presentation.pdf
20240429 Calibre April 2024 Investor Presentation.pdf20240429 Calibre April 2024 Investor Presentation.pdf
20240429 Calibre April 2024 Investor Presentation.pdfAdnet Communications
 
Russian Call Girls In Gtb Nagar (Delhi) 9711199012 💋✔💕😘 Naughty Call Girls Se...
Russian Call Girls In Gtb Nagar (Delhi) 9711199012 💋✔💕😘 Naughty Call Girls Se...Russian Call Girls In Gtb Nagar (Delhi) 9711199012 💋✔💕😘 Naughty Call Girls Se...
Russian Call Girls In Gtb Nagar (Delhi) 9711199012 💋✔💕😘 Naughty Call Girls Se...shivangimorya083
 
03_Emmanuel Ndiaye_Degroof Petercam.pptx
03_Emmanuel Ndiaye_Degroof Petercam.pptx03_Emmanuel Ndiaye_Degroof Petercam.pptx
03_Emmanuel Ndiaye_Degroof Petercam.pptxFinTech Belgium
 
VIP Call Girls Service Dilsukhnagar Hyderabad Call +91-8250192130
VIP Call Girls Service Dilsukhnagar Hyderabad Call +91-8250192130VIP Call Girls Service Dilsukhnagar Hyderabad Call +91-8250192130
VIP Call Girls Service Dilsukhnagar Hyderabad Call +91-8250192130Suhani Kapoor
 
Solution Manual for Principles of Corporate Finance 14th Edition by Richard B...
Solution Manual for Principles of Corporate Finance 14th Edition by Richard B...Solution Manual for Principles of Corporate Finance 14th Edition by Richard B...
Solution Manual for Principles of Corporate Finance 14th Edition by Richard B...ssifa0344
 
20240417-Calibre-April-2024-Investor-Presentation.pdf
20240417-Calibre-April-2024-Investor-Presentation.pdf20240417-Calibre-April-2024-Investor-Presentation.pdf
20240417-Calibre-April-2024-Investor-Presentation.pdfAdnet Communications
 
Instant Issue Debit Cards - High School Spirit
Instant Issue Debit Cards - High School SpiritInstant Issue Debit Cards - High School Spirit
Instant Issue Debit Cards - High School Spiritegoetzinger
 
The Economic History of the U.S. Lecture 22.pdf
The Economic History of the U.S. Lecture 22.pdfThe Economic History of the U.S. Lecture 22.pdf
The Economic History of the U.S. Lecture 22.pdfGale Pooley
 

Recently uploaded (20)

05_Annelore Lenoir_Docbyte_MeetupDora&Cybersecurity.pptx
05_Annelore Lenoir_Docbyte_MeetupDora&Cybersecurity.pptx05_Annelore Lenoir_Docbyte_MeetupDora&Cybersecurity.pptx
05_Annelore Lenoir_Docbyte_MeetupDora&Cybersecurity.pptx
 
TEST BANK For Corporate Finance, 13th Edition By Stephen Ross, Randolph Weste...
TEST BANK For Corporate Finance, 13th Edition By Stephen Ross, Randolph Weste...TEST BANK For Corporate Finance, 13th Edition By Stephen Ross, Randolph Weste...
TEST BANK For Corporate Finance, 13th Edition By Stephen Ross, Randolph Weste...
 
VIP Kolkata Call Girl Jodhpur Park 👉 8250192130 Available With Room
VIP Kolkata Call Girl Jodhpur Park 👉 8250192130  Available With RoomVIP Kolkata Call Girl Jodhpur Park 👉 8250192130  Available With Room
VIP Kolkata Call Girl Jodhpur Park 👉 8250192130 Available With Room
 
Q3 2024 Earnings Conference Call and Webcast Slides
Q3 2024 Earnings Conference Call and Webcast SlidesQ3 2024 Earnings Conference Call and Webcast Slides
Q3 2024 Earnings Conference Call and Webcast Slides
 
Independent Lucknow Call Girls 8923113531WhatsApp Lucknow Call Girls make you...
Independent Lucknow Call Girls 8923113531WhatsApp Lucknow Call Girls make you...Independent Lucknow Call Girls 8923113531WhatsApp Lucknow Call Girls make you...
Independent Lucknow Call Girls 8923113531WhatsApp Lucknow Call Girls make you...
 
Bladex Earnings Call Presentation 1Q2024
Bladex Earnings Call Presentation 1Q2024Bladex Earnings Call Presentation 1Q2024
Bladex Earnings Call Presentation 1Q2024
 
Instant Issue Debit Cards - School Designs
Instant Issue Debit Cards - School DesignsInstant Issue Debit Cards - School Designs
Instant Issue Debit Cards - School Designs
 
Dividend Policy and Dividend Decision Theories.pptx
Dividend Policy and Dividend Decision Theories.pptxDividend Policy and Dividend Decision Theories.pptx
Dividend Policy and Dividend Decision Theories.pptx
 
(ANIKA) Budhwar Peth Call Girls Just Call 7001035870 [ Cash on Delivery ] Pun...
(ANIKA) Budhwar Peth Call Girls Just Call 7001035870 [ Cash on Delivery ] Pun...(ANIKA) Budhwar Peth Call Girls Just Call 7001035870 [ Cash on Delivery ] Pun...
(ANIKA) Budhwar Peth Call Girls Just Call 7001035870 [ Cash on Delivery ] Pun...
 
High Class Call Girls Nashik Maya 7001305949 Independent Escort Service Nashik
High Class Call Girls Nashik Maya 7001305949 Independent Escort Service NashikHigh Class Call Girls Nashik Maya 7001305949 Independent Escort Service Nashik
High Class Call Girls Nashik Maya 7001305949 Independent Escort Service Nashik
 
Call US 📞 9892124323 ✅ Kurla Call Girls In Kurla ( Mumbai ) secure service
Call US 📞 9892124323 ✅ Kurla Call Girls In Kurla ( Mumbai ) secure serviceCall US 📞 9892124323 ✅ Kurla Call Girls In Kurla ( Mumbai ) secure service
Call US 📞 9892124323 ✅ Kurla Call Girls In Kurla ( Mumbai ) secure service
 
VVIP Pune Call Girls Katraj (7001035870) Pune Escorts Nearby with Complete Sa...
VVIP Pune Call Girls Katraj (7001035870) Pune Escorts Nearby with Complete Sa...VVIP Pune Call Girls Katraj (7001035870) Pune Escorts Nearby with Complete Sa...
VVIP Pune Call Girls Katraj (7001035870) Pune Escorts Nearby with Complete Sa...
 
20240429 Calibre April 2024 Investor Presentation.pdf
20240429 Calibre April 2024 Investor Presentation.pdf20240429 Calibre April 2024 Investor Presentation.pdf
20240429 Calibre April 2024 Investor Presentation.pdf
 
Russian Call Girls In Gtb Nagar (Delhi) 9711199012 💋✔💕😘 Naughty Call Girls Se...
Russian Call Girls In Gtb Nagar (Delhi) 9711199012 💋✔💕😘 Naughty Call Girls Se...Russian Call Girls In Gtb Nagar (Delhi) 9711199012 💋✔💕😘 Naughty Call Girls Se...
Russian Call Girls In Gtb Nagar (Delhi) 9711199012 💋✔💕😘 Naughty Call Girls Se...
 
03_Emmanuel Ndiaye_Degroof Petercam.pptx
03_Emmanuel Ndiaye_Degroof Petercam.pptx03_Emmanuel Ndiaye_Degroof Petercam.pptx
03_Emmanuel Ndiaye_Degroof Petercam.pptx
 
VIP Call Girls Service Dilsukhnagar Hyderabad Call +91-8250192130
VIP Call Girls Service Dilsukhnagar Hyderabad Call +91-8250192130VIP Call Girls Service Dilsukhnagar Hyderabad Call +91-8250192130
VIP Call Girls Service Dilsukhnagar Hyderabad Call +91-8250192130
 
Solution Manual for Principles of Corporate Finance 14th Edition by Richard B...
Solution Manual for Principles of Corporate Finance 14th Edition by Richard B...Solution Manual for Principles of Corporate Finance 14th Edition by Richard B...
Solution Manual for Principles of Corporate Finance 14th Edition by Richard B...
 
20240417-Calibre-April-2024-Investor-Presentation.pdf
20240417-Calibre-April-2024-Investor-Presentation.pdf20240417-Calibre-April-2024-Investor-Presentation.pdf
20240417-Calibre-April-2024-Investor-Presentation.pdf
 
Instant Issue Debit Cards - High School Spirit
Instant Issue Debit Cards - High School SpiritInstant Issue Debit Cards - High School Spirit
Instant Issue Debit Cards - High School Spirit
 
The Economic History of the U.S. Lecture 22.pdf
The Economic History of the U.S. Lecture 22.pdfThe Economic History of the U.S. Lecture 22.pdf
The Economic History of the U.S. Lecture 22.pdf
 

2011 EMU Managed Volatility

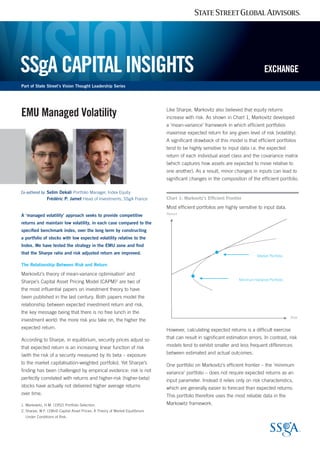
  • 1. Part of State Street’s Vision Thought Leadership Series SSgA CAPITALINSIGHTS EXCHANGE EMU Managed Volatility A ‘managed volatility’ approach seeks to provide competitive returns and maintain low volatility, in each case compared to the specified benchmark index, over the long term by constructing a portfolio of stocks with low expected volatility relative to the Index. We have tested the strategy in the EMU zone and find that the Sharpe ratio and risk adjusted return are improved. The Relationship Between Risk and Return Markovitz’s theory of mean-variance optimisation1 and Sharpe’s Capital Asset Pricing Model (CAPM)2 are two of the most influential papers on investment theory to have been published in the last century. Both papers model the relationship between expected investment return and risk, the key message being that there is no free lunch in the investment world: the more risk you take on, the higher the expected return. According to Sharpe, in equilibrium, security prices adjust so that expected return is an increasing linear function of risk (with the risk of a security measured by its beta – exposure to the market capitalisation-weighted portfolio). Yet Sharpe’s finding has been challenged by empirical evidence: risk is not perfectly correlated with returns and higher-risk (higher-beta) stocks have actually not delivered higher average returns over time. 1. Markowitz, H.M. (1952) Portfolio Selection. 2. Sharpe, W.F. (1964) Capital Asset Prices: A Theory of Market Equilibrium Under Conditions of Risk. Like Sharpe, Markovitz also believed that equity returns increase with risk. As shown in Chart 1, Markovitz developed a ‘mean-variance’ framework in which efficient portfolios maximise expected return for any given level of risk (volatility). A significant drawback of this model is that efficient portfolios tend to be highly sensitive to input data i.e. the expected return of each individual asset class and the covariance matrix (which captures how assets are expected to move relative to one another). As a result, minor changes in inputs can lead to significant changes in the composition of the efficient portfolio. Chart 1: Markovitz’s Efficient Frontier Most efficient portfolios are highly sensitive to input data. However, calculating expected returns is a difficult exercise that can result in significant estimation errors. In contrast, risk models tend to exhibit smaller and less frequent differences between estimated and actual outcomes. One portfolio on Markovitz’s efficient frontier – the ‘minimum variance’ portfolio – does not require expected returns as an input parameter. Instead it relies only on risk characteristics, which are generally easier to forecast than expected returns. This portfolio therefore uses the most reliable data in the Markowitz framework. Co-authored by: Selim Dekali Portfolio Manager, Index Equity Frédéric P. Jamet Head of Investments, SSgA France Return Risk Market Portfolio Minimum-Variance Portfolio
  • 2. SSSSSSggAA CACAPIPITATALL ININSISIGHGHTSSTS ||| EMU MANAGED VOLATILITY Why Adopt a Managed Volatility Approach? In the recent financial crisis, investors clearly demonstrated their asymmetric risk tolerance to negative returns (i.e. higher aversion to downside risk). In response to these heightened concerns, strategies that seek to limit the downside risk in investment portfolios, while still maintaining potential returns, have become increasingly popular. In the context of controlling risk independently from returns, the managed volatility portfolio is an appealing investment approach. Managing volatility in eurozone portfolios is a particularly interesting case given the absence of currency risk and thus the need to quantify that risk in the investment process. Simulating a Managed Volatility Strategy1 We conducted a simulation to compare the returns and volatility of a managed volatility portfolio with those of the market-cap-weighted MSCI EMU Index for the period 1999–2010. For the managed volatility portfolio we set the following parameters: 25% Maximum absolute sector weight 10% Maximum absolute industry weight 2% Maximum holding on trade initiation 2.5% Maximum holding cap 20% Average daily volume constraint on trades 3% Country exposure deviation relative to the benchmark As shown in Chart 2, the managed volatility portfolio (EMU Managed Volatility) is shown to generate a higher Sharpe Ratio for the period studied. The managed volatility portfolio recorded volatility more than 28% lower than that of the index and provided competitive risk adjusted return compared to the index. Chart 2: Higher Returns and Lower Volatility from an Absolute Approach to Managed Volatility Investing The simulation time frame includes some particularly interesting periods, as shown in Chart 3. During the technology (‘dot.com’) bubble in 1999–2002, the managed volatility strategy’s participation to both the upside and the downside was significantly less relative to the MSCI EMU Index. As such, risk, as measured by volatility, was reduced. It is important to understand that while the return of a managed volatility strategy has the potential to be materially greater than the cap-weighted equity benchmark over certain periods, particularly those periods consisting of multiple bear markets such as those experienced during the first decade of the 21st century, investors should not expect the return to be materially greater than the cap-weighted benchmark over the long term. 2 28% 4% 24% -18% -33% 20% 13% 26% 23% -45% 3% 31% -34% 15% 7% -7% -17% 21% 32% 11% 30% -1% 36% 10% -50% -40% -30% -20% -10% 0% 10% 20% 30% 40% 1999 2000 2001 2002 2003 2004 2005 2006 2007 2008 2009 2010 Percentage EMU Managed Volume MSCI EMU Chart 3: Simulated Managed Volatility Portfolio – Performance Over Time EMU Managed Volatility MSCI EMU Index Difference 1 Year Return 10.77% 2.77% 8.00% 3 Years Return -3.10% -9.70% 6.60% 5 Years Return 4.43% -0.21% 4.64% 12 Years Return (Since Inception) 7.63% 1.96% 5.67% Volatility 16.52% 23.19% -6.67% Volatility Reduction – – -28.77% Sharpe Ratio 0.27 -0.05 0.32 Source: Axioma, SSgA, Performance in Euro
  • 3. SSgA Capital Insights is an integrated thought leadership program designed to educate clients on timely investment and market topics. As part of State Street’s Vision thought leadership series, the SSgA Capital Insights program gives clients access to the expertise and viewpoints of SSgA’s thought leaders and investment talent via a variety of multimedia channels. Since 2006, State Street’s Vision series has been distilling our distinct research, perspective and opinions on key themes impacting institutional investors worldwide into publications for our customers around the world. This material is for your private information. The views expressed are the views of State Street Global Advisors only through the period ended 1 July 2011 and are subject to change based on market and other conditions. The information we provide does not constitute investment advice and it should not be relied on as such. It should not be considered a solicitation to buy or an offer to sell a security. It does not take into account any investor’s particular investment objectives, strategies, tax status or investment horizon. We encourage you to consult your tax or financial advisor. All material has been obtained from sources believed to be reliable, but its accuracy is not guaranteed. There is no representation or warranty as to the current accuracy of, nor liability for, decisions based on such information. This document contains certain statements that may be deemed forward-looking statements. These statements are based on certain assumptions and analyses made by SSgA in light of its experience and perception of historical trends, current conditions, expected future developments and other factors it believes appropriate in the circumstances. Past performance is no guarantee of future results. MSCI Indices are trademarks of MSCI, Inc. ©2011 State Street Corporation EUMKT-1049 Exp. Date: 07/31/2012 Chart 4 shows that, as expected, the simulated portfolio is biased towards stocks with a low beta (given their lower volatility than high beta stocks). Over the simulation time frame, the portfolio’s beta ranges between 0.5 and 0.8. As at the end of December 2010, the portfolio was overweight in Health Care and Consumer Staples (i.e. defensive stocks) and underweight in Materials (i.e. cyclical stocks). Conclusion For investors in the eurozone equity markets, risk-reduction strategies based on the concept of managed volatility hold a number of attractions. Given their objective of limiting downside risk, they may be particularly appealing as the growth portfolio of a broader liability-driven investment solution. Investors have shown considerable interest in strategies that focus on risk reduction. The simulation of an EMU managed volatility portfolio versus the MSCI EMU Index featured provide interesting results for the period studied on a risk and risk- adjusted return basis. SSSSSSggAA CACAPIPITATALL ININSISIGHGHTSSTS ||| EMU MANAGED VOLATILITY 0% 10% 20% 30% 40% 50% 60% 1 (1.85) 2 (1.45) 3 (1.35) 4 (1.2) 5 (1.05) 6 (0.95) 7 (0.9) 8 (0.85) 9 (0.75) 10 (0.45) BetaDecile EMU Managed Volume MSCI EMU Chart 4: Decile of Beta Exposure of Simulated EMU Managed Volatility and MSCI EMU (as of December 2010) Axioma European Fundamental Factor Risk Model Source: Axioma, SSgA DISCLAIMER 1 Europe Managed Volatility Performance: Returns are simulated from January 4, 1999 to December 31, 2010 and assume 30bp transaction costs each way. Turnover was approximately 20% annually (one-way), with quarterly rebalancing. The results shown do not represent the results of actual trading using client assets but were achieved by means of the retroactive application of a model that was designed with the benefit of hindsight. The simulated performance was compiled after the end of the period depicted and does not represent the actual investment decisions of the advisor. These results do not reflect the effect of material economic and market factors on decision making. The simulated performance data is reported on a gross of fees basis, and gross of administrative costs. Additional fees, such as the advisory fee, would reduce the return. For example, if an annualized gross return of 10% was achieved over a 5-year period and a management fee of 1% per year was charged and deducted annually, then the resulting return would be reduced from 61% to 54%. The performance includes the reinvestment of dividends and other corporate earnings and is calculated in Euro. The simulated performance is not necessarily indicative of future performance, which could differ substantially. The benchmark used is the MSCI Europe Index. The index returns are unmanaged and do not reflect the deduction of any fees or expenses. The index returns reflect all items of income, gain and loss and the reinvestment of dividends and other income. All trademarks are property of their respective owners. The strategy described may be executed in a commingled fund managed by SSgA which is not insured by the FDIC or by another governmental agency; it is not an obligation of the FDIC nor is it a deposit or obligation of or guaranteed by State Street Bank and Trust Company. All SSgA commingled funds pay State Street Bank and Trust Company for services as custodian, transfer agent, and shareholder servicing agent and may pay affiliates of State Street Bank and Trust Company for investment advisory services. Not all products will be available to all investors, please contact SSgA for further information regarding this strategy. The performance information should not be shown without these accompanying notes. Backtest Creation: The testing methodology used the Axioma European Fundamental Factor Risk Model, and Axioma optimization model to generate historical portfolios. The data used was only that data which would have been available at the time when the historical portfolios were generated, not what is available now. These processes help to eliminate various forms of survivorship bias, both in terms of a “smarter model” and in terms of making decisions based on information that was not available at the time. Quarterly portfolios were created, and returns are the result of a buy and hold assumption on each of these portfolios. Transaction costs were assumed as stated above. This Europe Managed Volatility process was backtested in May 2011.