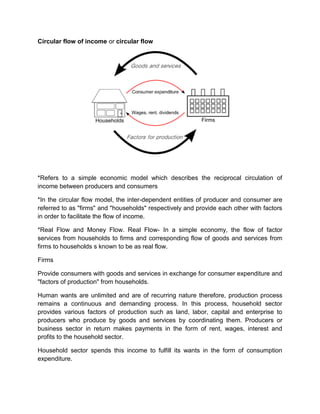
The document describes the circular flow of income model and its evolution from a simple two-sector model to a more complex five-sector model. It explains the key components of each model - households and firms in the two-sector model and the additions of government and foreign sectors in later models. It also discusses the concept of equilibrium between total leakages (savings, taxes, imports) and injections (investment, government spending, exports) and how disequilibrium can cause economic expansion or contraction until equilibrium is regained.
Circular Flow and Intro to MacroeconomicsMark Anthony
The document summarizes key concepts of macroeconomics including the circular flow model. The circular flow model shows how money flows between households and firms through factor payments and the purchase of goods and services. Firms utilize resources from households like labor, capital, land and entrepreneurship to produce goods and services. This generates income for households which they can use to purchase goods and services from firms. There are also inflows and outflows in the circular flow from sectors like government, investment, exports and imports that affect income and spending in the economy. The circular flow framework helps explain the interdependence between production and consumption in the macroeconomy.
The document describes the circular flow of income model of the economy. It shows the flows of incomes and expenditures between households and businesses. Households supply resources to businesses through factor markets in exchange for money. Businesses then use those resources to produce goods and services, which they sell to households through product markets in exchange for money. The model can be expanded to include the government sector, which purchases goods and services from businesses, hires resources from households, provides public goods to both, and finances these activities through tax payments from households and businesses.
The document discusses various concepts related to national income such as GDP, NDP, NNP, per capita income. It provides estimates of these figures for India from 1999-2000 to 2004-2005 at both current and constant prices. It also explains key terms like domestic territory, normal residents, stock and flow variables, closed and open economies, and methods of measuring national income such as the product, income and expenditure methods.
The document discusses various topics related to labour markets including:
- Labour is one of the four factors of production and its supply is determined by the number of able people and their willingness to work. Demand is determined by economic conditions.
- Labour markets exist at the international, national, local, and internal levels and labour can transfer between these markets.
- Unemployment rates are used to measure economic performance and are a target of macroeconomic policy, with different types of unemployment like frictional and structural unemployment.
- Current labour issues include topics like globalization, technological changes, job mismatches, and developing human capital with the right skills. The Philippine government addresses these through strategies in the Philippine Labor and Employment Plan.
This document defines and explains key macroeconomic concepts related to measuring a nation's income and production. It discusses Gross Domestic Product (GDP) as the total market value of all final goods and services produced within a country in a given period. GDP is calculated using the expenditure and income approaches and is adjusted for inflation using the GDP deflator to determine real GDP. The document also outlines factors that influence GDP growth and limitations of GDP as a measure of economic well-being.
The public sector is the part of the economy controlled by governments that provides services like the military, police, public transit, education, and healthcare. It aims to provide services that benefit all of society. Public sector economics studies how governments can address market failures through public spending, taxation, state ownership of firms, and regulation. It analyzes how governments can improve economic welfare and quality of life.
This document discusses the relationship between investment, national income, and the stock of capital over multiple time periods. It presents a formula to calculate the present value of future returns from a capital asset. It also shows a table illustrating how output, income, capital stock, replacement costs, net investment, and gross investment change over 6 time periods. The capital output ratio and depreciation rate are assumed to remain constant.
Consumer Behavior: Income and Substitution Effects
The Consumer’s Reaction to a Change in Income
Engel Curve or Engel’s Law
The Consumer’s Reaction to a Change in Price
The Consumer’s Demand Function
Cobb-Douglas Utility Function
The Slutsky Substitution Effect
The Hicks substitution effect
A fantastic PPT on the topic circular flow of income. It gives a complete understanding of the working of an economy in two sector, three sector and four sector models. It explains how production, income and expenditure are interrelated and how they move in a circular way.
Consumption refers to the final purchase of goods and services by individuals. It is an important economic concept that helps determine economic growth. Consumption is affected by factors like income, prices, taxes, and savings.
Keynesian theory states that current real income is the most important determinant of short-term consumption. Savings means consuming less now to consume more later. It differs from investment, which economists define as additions to real capital assets. There are various types of savings like personal savings and national savings.
Investment refers to committing money or acquiring property to generate future income. Traditional investments include assets like bonds, real estate and shares. Alternative investments comprise things like hedge funds and commodities. Investment decisions consider the expected
The document discusses the standard trade model and gains from trade. It introduces a 2x2x2 model with two countries producing two goods using two factors of production. Opening trade leads to gains for both countries as production and consumption move to new equilibrium points that exploit each country's comparative advantage. The terms of trade adjust to balance trade between the countries. Economic growth can impact a country's terms of trade depending on whether it is export- or import-biased. Government policies like tariffs, subsidies, and transfers also affect equilibrium terms of trade.
This chapter discusses how to determine national income and its fluctuations. It introduces the concepts of aggregate expenditure (AE), equilibrium income, the consumption function, savings function, investment, and the multiplier. AE is the total planned spending in the economy. Equilibrium occurs when AE equals national income (Y). The chapter shows that an increase in investment (I) or autonomous consumption will increase AE and equilibrium Y through the multiplier effect. It also discusses the "paradox of thrift" where an increase in savings can reduce income.
A brief study on the measures of income distribution for both analytic and quantitative purposes in terms of size distribution and functional distribution.
The study includes discussion on following concepts-
Lorenz Curve
Gini Coefficient
Absolute Poverty
Foster Greer Thorbecke Measure
The document discusses market failure and the role of government in responding to market failures. It defines market failure as situations where markets fail to allocate resources efficiently. Market failures can occur due to market imperfections, public goods, externalities, and inequalities. The government's roles in response include regulation, allocation of resources for collective goods, redistribution of income, and maintaining economic stability. Regulatory responses include controlling industry structure, prices, and pollution. The government also uses subsidies, grants, taxes, and transfers to influence production and consumption in the presence of market failures.
The document discusses the circular flow of income model and its key components. It describes the five sectors - households, firms, government, financial institutions, and foreign - and the flows between them. It explains how savings, taxes, and imports are leakages that reduce income circulating in the economy, and how investment, government spending, and exports are injections that increase income circulating in the economy. Equilibrium occurs when total leakages equal total injections.
The document presents information about the economy of Pakistan. It discusses key economic indicators such as GDP, GDP growth rate, GDP per capita, inflation rate, population below the poverty line, labor force, unemployment rate, top industries, ease of doing business ranking, exports, export partners, imports, import partners, public finances including debt, revenues and expenses, and credit ratings. It provides an overview of Pakistan's economy in terms of size, sectors, trade, and fiscal situation.
The document discusses national income accounting and macroeconomic aggregates. It defines GDP as the total market value of final goods and services produced domestically in a given period. GDP can be measured through the expenditure, income, and production approaches. Key components of GDP include personal consumption, private investment, government spending, and net exports. The circular flow diagram models the flows of money between households and firms.
This chapter discusses the determination of national income and its distribution in a closed economy. It introduces the production function and factors of production, capital and labor. It explains that total output is determined by factor supplies and technology. Factor prices, the wage rate and rental rate, are determined by supply and demand in factor markets. Total income is distributed to factors based on their marginal products. The chapter then covers the components of aggregate demand - consumption, investment, and government spending. It presents the loanable funds market model to show how interest rates adjust to equilibrate saving and investment.
This document examines the measurement of economic growth in Nigeria using gross domestic product (GDP) data from 1980 to 2014. It defines GDP and related terms like gross national product, real GDP, nominal GDP, and GDP deflator. GDP is the total value of goods and services produced within a country in a year. Real GDP accounts for inflation to measure actual economic output. The author analyzes Nigeria's GDP figures over the period and finds little significant economic growth. They recommend the government improve infrastructure to aid business and formulate sound monetary and fiscal policies to mitigate inflation and boost productivity.
Total, Average and Marginal Product.pptxIkramSabir4
Total product is the total quantity of goods or services produced using a given quantity of inputs like labor. Average product is the amount of output produced per unit of a variable input, calculated as total product divided by total inputs. Marginal product is the change in total output from adding one more unit of a variable input, while holding other inputs constant.
This document discusses Gross Domestic Product (GDP) and its measurement. It begins by defining GDP as the market value of all final goods and services produced within a country in a given period of time. It then explains the components of GDP - consumption, investment, government purchases, and net exports. The document provides examples and exercises to illustrate real GDP versus nominal GDP, and how to compute GDP, real GDP, and the GDP deflator.
The document discusses various price indices used to measure inflation and price changes in an economy including the Consumer Price Index (CPI), Wholesale Price Index (WPI), and Sensitive Price Indicator (SPI). The CPI measures price changes of consumer goods and services and is the main measure of inflation in a country. The WPI measures price changes in primary and wholesale markets. The SPI measures price movements of essential commodities on a weekly basis. Each index provides important information about inflation and price levels in different sectors of the economy.
Production and cost (economics presentation)AliAkberMehedi
This document discusses production costs, including:
- It defines production functions, total, average, and marginal costs and products.
- It explains the relationships between total, average, and marginal costs and how they are impacted by changes in production levels.
- It distinguishes between short-run costs, which include fixed factors, and long-run costs, which have no fixed factors and all inputs can be varied.
This document provides an overview of circular flow models in economics. It begins with defining the circular flow of income as the circulation of money, goods, and services between producers and consumers. It then covers the two sector model which includes households and firms exchanging money for goods. It introduces the three sector model which adds the government sector that collects taxes, spends on goods/services, and provides transfers. Key points are explained through diagrams and the document signifies how these models underpin national accounting and macroeconomics.
The circular flow of income model describes the reciprocal flow of money between households and firms. Households supply factors of production like labor to firms and receive income, while firms supply goods and services to households in exchange. This forms a continuous loop referred to as the circular flow of income, with payments in each direction. The model can be expanded to include government and foreign trade. It helps explain macroeconomic concepts like GDP, equilibrium, and the effects of policies.
The document describes the circular flow of economic activity between households and firms. It shows that households receive income from firms for supplying factors of production like labor, capital and land. Households then use this income to purchase goods and services from firms. Firms take these factor payments and use them to pay for costs like wages, rent, interest and profit. The cycle then repeats with firms producing goods that households demand. This circular flow involves the continuous movement of goods, services and money between households and firms.
This document discusses demand and supply from the perspective of firms and households. It defines firms as organizations that transform resources into products, and entrepreneurs as people who organize and manage firms. Households are the consuming units that demand goods and services. The circular flow diagram shows the connections between firms, households, input markets, and output markets. Demand is determined by price, income, wealth, tastes and preferences. The law of demand states that as price increases, quantity demanded decreases. A shift in demand occurs when a determinant of demand other than price changes, causing the demand curve to shift.
This document discusses key concepts related to demand and supply, including:
1) Demand and supply schedules show the relationship between price and quantity at different price levels. Demand and supply curves graph this relationship.
2) A change in a non-price factor like income causes a shift of the demand or supply curve, while a price change results in movement along the curve.
3) Equilibrium occurs where quantity demanded equals quantity supplied. Price controls can result in surpluses or shortages from the equilibrium.
4) Elasticity measures the responsiveness of one variable to changes in another. It is used to analyze how changes in price or other factors affect revenue and consumer behavior.
The document discusses the circular flow of economic activities. It describes how there are two basic activities - production by firms and consumption by households. Firms produce goods and services using resources (land, labor, capital) owned by households. Households provide resources to firms and use their income to purchase goods and services from firms. This circular flow involves a continuous exchange of resources, production, income and expenditure between households and firms without a beginning or end.
The circular flow of income model shows the interdependence between different sectors of the economy. It illustrates how income and spending flow between households and businesses. Households supply resources and labor to businesses, receive income, and use that income to purchase goods and services. Businesses use those resources to produce output, sell it for a profit, and pay incomes. This continuous flow creates equilibrium in the economy when total injections equal total leakages.
The document discusses measures of national income and output, specifically Gross National Product (GNP). It provides definitions of GNP, explaining that GNP is the sum of the market values of all final goods and services produced within a country in a given period of time. It notes that GNP can be calculated using the expenditure approach, income approach, or industrial origin approach. The document also discusses what activities are excluded from GNP calculations and provides an example GNP calculation for the Philippines using both the industrial origin and expenditure approaches.
The circular flow model describes the reciprocal flow of income between two main sectors: households and firms. Households provide factors of production like labor, capital, and land to firms, and in turn receive income payments from firms. Firms then use these factors to produce goods and services, which they sell to households. Households use their income to purchase goods and services from firms, completing the circular flow. Money facilitates the exchange of goods, services, and income between the two sectors.
This document provides an overview of macroeconomics and key macroeconomic concepts. It discusses that macroeconomics is concerned with the performance of the overall economy or large sectors, and attempts to explain fluctuations in total output and the business cycle. It also covers national income accounting, which provides aggregate measures of the economy, and its importance. The document discusses the circular flow model and how a more comprehensive model incorporates the government and foreign sectors. It defines gross national product and gross domestic product as measures of aggregate output and how they are calculated. It also summarizes different approaches to measuring GNP/GDP.
The document summarizes the circular flow of income and expenditure in a four sector economy consisting of household, business, government, and foreign sectors. It describes the receipts and payments between each sector. For example, households receive factor income from businesses and pay taxes to the government. Businesses receive income from sales and exports and pay factor costs to households. The government collects taxes and makes transfer payments. The foreign sector receives payments for imports and makes payments for exports. An equilibrium equation balances aggregate demand and supply in the economy.
National income is generated as households supply factors of production to firms and firms supply goods and services in return. Factors of production earn income which contributes to national income.
The circular flow of income shows how income and spending flow between households and firms. Income from the sale of goods leads to more spending, which generates more income and spending in a continuous cycle. Savings, investment, taxes, government spending, imports and exports can inject or withdraw from the circular flow and influence national income.
The document provides an introduction to macroeconomics, describing the four main sectors of the macroeconomy - households (consumers), business (producers), government (regulators and tax collectors), and foreign (other economies). It explains that households consume goods and services, businesses produce goods and services for households to consume, the government collects taxes and provides services, and the foreign sector involves international trade. It also introduces the circular flow model showing how income and spending flow between these sectors.
Class Lecture Notes Measuring the MacroeconomyProfessor Shari Lyman,.docxmccormicknadine86
Class Lecture Notes Measuring the MacroeconomyProfessor Shari Lyman, Ph.D.
GDP Measures
GDP is Gross Domestic Product
GDP is the value of all final goods and services produced within a country’s borders by its own citizens or foreign citizens in a given time period.
GNP is Gross National Product
GNP is the value of all final goods and services produced by a country’s citizens within the country’s borders or in foreign lands in a given time period. http://www.diffen.com/difference/GDP_vs_GNP
Intermediate goods are used to produce other goods. For example, when Pizza Hut buys cheese to produce pizzas, the cheese is an intermediate good.
Final goods are purchased by the end user. When the Lyman household purchases cheese, the cheese is a final good.
GDP is represented by the variable Y in macroeconomic calculations.
The formula for GDP is:
Y=Consumption(C)+Investment(I)+Government Expenditures(G)+Net Exports(X-M).
Consumption (durable and non-durable goods and services for individual household consumption)
Investment (Consumption of new physical capital and new housing such as factories, machines, tools, transportation systems, new houses, etc.) Investment is purchased using financial capital instruments.
Government expenditures (all Federal, State, and Local government purchases from paper clips to aircraft carriers).
Net Exports (Trade Balance=Exports-Imports)
Macroeconomic Measures introduces the student to 3 different methods of measuring GDP:
1.the incomes approach (simplified circular flow model-resource flow approach)
2.the expenditures approach (simplified circular flow model (D) money flow approach)
3.the output approach (simplified circular flow model (S) product flow approach).
Incomes Approach (Input/resource approach)
GDP (also known as national income which is indicated by Y) is equal to the inputs used in the production process. The inputs include:
land in the form of rent
labor in the form of wages
capital in the form of interest
entrepreneurship in the form of profit.
Y = rent + wages + interest + profit.
Expenditures Approach (Demand side approach)
GDP (also known as aggregate demand (AD) which is indicated by Y) is equal to the total output demanded in the economy. The outputs include:
consumption
investment
government expenditures
net exports
Y=Consumption(C)+Investment(I)+Government Expenditures(G)+Net Exports(X-M)
Output Approach (Supply side approach)
GDP (also known as national output which is indicated by Y) is equal to the outputs supplied to the economy. The outputs include:
household goods (durable and nondurable goods and services)
investment goods (new housing and capital)
government (durable and nondurable goods and services)
net exports (goods for export minus goods imported)
Y = Household (C) + Firm and HH (I) + (G) + Net Exports (X-M)
The Keynesian Consumption (Spending) Multiplier
The Keynesian Consumption Multiplier is based on the assumption that for each additional dollar a household receives some ...
The document discusses the economic concept of the multiplier. It provides three key points:
1) A multiplier measures how much an economic variable (like income or output) changes in response to a change in another variable (like investment or government spending). For example, a $100 increase in investment may lead to a $300 increase in income, so the multiplier is 3.
2) The multiplier captures the ripple effect of spending as income from the initial transaction is spent again and again in the economy. This leads to a larger increase in overall income than the initial change in spending.
3) The size of the multiplier depends on the marginal propensity to consume (MPC). A higher MPC means more
This document provides an overview of macroeconomics and the circular flow of income through several models. It discusses key concepts such as:
1. Macroeconomics studies the economy as a whole by looking at aggregates like total output and income, whereas microeconomics looks at individual units.
2. Common macroeconomic policy objectives are full employment, price stability, economic growth, and balance of payments equilibrium.
3. The circular flow of income can be modeled in a two-sector closed economy with households and firms or a three-sector model that includes government. Savings and investment are incorporated through financial markets to achieve equilibrium.
The document discusses the circular flow of income model and its key concepts. It explains the five sector circular flow model which shows the flows of money and goods between households, firms, the government, financial institutions, and the foreign sector. It describes how savings, taxes, and imports are leakages that reduce the flow of income in the circular flow, while investment, government spending, and exports are injections that increase the flow. The model shows the economy is in equilibrium when total leakages equal total injections.
This document provides an overview and explanation of the circular flow model and its application to economic growth. It outlines the five sectors of the model - households, producers, government, financial and overseas. It describes the flows between these sectors, including consumption, income, taxes, savings and imports/exports. The document discusses how injections, such as increases in government spending or exports, can stimulate economic growth by creating flow-on effects that increase income and spending in other sectors. Limitations of the model are also acknowledged.
The circular flow of income refers to the continuous flow of payments between two main sectors - the household sector and the business sector. The household sector owns factors of production like labor, land, and capital and receives income by supplying these factors to businesses. Businesses take these factors to produce goods and services, which they sell to households. Households then use their income to purchase goods and services. This continuous flow creates a circular pattern between the two sectors, with money constantly moving from businesses to households and back again. The model can be expanded to three sectors with the addition of the government sector, which engages in taxation as a leakage from the circular flow and government purchases as an injection into it. Understanding the circular flow is important for
The document defines key macroeconomic concepts including aggregate expenditure, output, income, consumption, saving, investment, government spending, taxes, imports, exports, and equilibrium. It also discusses the consumption function, marginal propensity to consume, marginal propensity to save, and the multiplier effect.
This document discusses measures of income and output in a simplified economy. It provides examples of how national income can be calculated by tracking money flows between different sectors. It then expands the simple model to include additional sectors like financial institutions, government, and overseas trade. Leakages from the circular flow like savings, taxes, and imports are defined as outflows, while injections like investments, government spending, and exports increase the flow of income. An equation is presented showing that national income depends on household consumption and business sector investment.
This document discusses circular flow of income and expenditure in different types of economies. It begins by describing the basic circular flow between households and businesses in a two-sector closed economy. It then expands on this by introducing the government sector, creating a three-sector closed economy model. Finally, it introduces an open, four-sector economy model that includes international trade between the domestic economy and the foreign sector. Key aspects like assumptions, flows of goods/services/income, and the overall circular nature of expenditures and incomes are described for each economy type.
This document discusses general equilibrium models using input-output analysis and its relationship to aggregate demand and supply. It covers the five main sectors in an economy - households, firms, government, foreign trade, and financial - and how they interact. The firm sector produces goods equal to total expenditures. Households receive income and allocate to consumption and savings. Government balances spending and taxes. Foreign trade balances exports, imports and borrowing. Financial sector balances investment and national savings. It also discusses how input-output matrices can model intersectoral flows and the total interrelated economic system.
This document discusses key macroeconomic measures used by governments, including GDP, GNP, NNP, NDP, and factors that influence comparing economic growth between countries. It also covers the circular flow of income, aggregate expenditure, consumption and investment functions, and differences between the Keynesian and monetarist approaches to macroeconomics.
The circular flow of income describes the movement of expenditure and income throughout an economy. Households provide factors of production like labor to firms, who use these to produce goods and services sold to households. Households then spend money on these goods and services, which firms use to pay households wages. This process repeats in a circular flow. However, not all income is spent domestically - some is saved, taxed, or spent on imports, representing leakages from the circular flow. Injections like investment, government spending, and exports add spending back into the circular flow.
The document discusses various anatomical planes, directional terms, and movement terms used to describe the human body. It defines anterior, posterior, superior, inferior and other planes. It also lists various movement terms like flexion, extension, abduction, adduction and others. Finally, it discusses anatomical position and different body positions like supine and prone.
Vital signs are measurements of basic body functions like temperature, pulse, blood pressure, and respiratory rate. Taking vital signs involves measuring body temperature, pulse rate, and blood pressure to evaluate a person's basic physiological status. Normal ranges vary by age but body temperature is typically around 37°C, pulse is 60-100 bpm for adults, blood pressure below 120/80 mmHg, and respiratory rate is 12-20 breaths per minute for adults.
This document provides an overview of basic trauma life support. It defines trauma as any bodily injury caused by external energy sources. The primary survey involves a quick assessment of the patient's airway, breathing, circulation, disability, and exposure to identify life-threatening issues. The secondary survey involves a more focused physical exam and history to identify hidden injuries. Key skills covered include spinal immobilization, bleeding control techniques, wound management principles like RICE, and splinting. The overall goal is to rapidly identify and treat life-threatening injuries before transporting the patient to definitive care.
The document provides information on basic life support (BLS) including definitions, the adult chain of survival, call or CPR first considerations, signs requiring CPR, approaching a victim, and high quality CPR techniques. It discusses refining the recognition of cardiac arrest and initiation of CPR or calling emergency services. Emphasis is placed on minimizing interruptions during chest compressions and avoiding excessive ventilation.
This document discusses different forms of escaping taxation and exemption from taxation. It covers shifting the tax burden, capitalization, transformation, avoidance, exemption, and evasion. Shifting involves transferring the tax burden legally to another party like consumers. Capitalization is reducing the price of taxed goods based on future taxes. Transformation is improving production to offset tax costs. Avoidance uses legal methods to minimize taxes, while evasion uses illegal means. Exemption grants immunity from taxes to certain groups. Evasion involves fraudulent attempts to lessen taxes owed.
This document provides an introduction to economics by defining key economic terms and concepts in short entries. It defines economics as the social science that studies the production, distribution, and consumption of goods and services. It then proceeds to define related terms such as value, market, consumption, distribution, exchange, microeconomics, macroeconomics, public finance, and production.
The document is a quiz about monetary policy that contains multiple choice questions and answers about key concepts including:
- How monetary policy controls the supply of money in an economy to impact interest rates and promote economic growth and stability.
- How expansionary and contractionary monetary policies are used to combat unemployment and inflation respectively.
- Other related economic concepts like trade deficits, budget deficits, required reserve ratios, and bonds.
This document contains a quiz about key concepts related to measuring unemployment, including definitions of labor force, producer price indexes, deflation, cyclical unemployment, structural unemployment, frictional unemployment, and real interest rate.
This document contains a quiz on the Philippines' agrarian land reform program with multiple choice questions and answers. It asks about the first law establishing 50-50 crop sharing between landlords and tenants (RA 4054), the law establishing security of tenure (CA No. 608), and the percentage of the harvest going to those who shoulder expenses under RA No. 34 (70%). It also asks about President Roxas negotiating for land purchases in Batangas, the executive order establishing LASEDECO, the 1955 Land Reform Act, President Garcia continuing programs of President Maysaysay, President Macapagal being considered the "Father of Agrarian Reform", and RA No. 3844 being the most comprehensive agrarian
This document contains a quiz about taxation, fiscal policy, and forms of escaping taxation. It defines key terms like taxation, broad basing taxes, adequacy of taxes, fiscal policy, expansionary and contractionary fiscal policy, taxes, corporate taxes, shifting taxes, and capitalization of taxes. The quiz provides definitions and expects the reader to identify the correct term for each definition provided.
Taxes are financial charges imposed by governments on taxpayers that are punishable by law if not paid. They include direct taxes like income tax and indirect taxes like value added tax. Governments also obtain resources through activities like borrowing, money creation, and confiscating wealth. Common taxes are on income, corporate profits, capital gains, property, payroll, goods and services, wealth, and various financial transactions. Taxes can be proportional, progressive, or regressive based on how the tax rate changes relative to the amount being taxed.
Tax, taxation, forms of escape from taxation, computation, fiscal policyMarvin Morales
A tax is a compulsory financial charge imposed by a state on taxpayers to fund government activities. Taxes are either direct, such as income tax, or indirect, such as value added tax. The document outlines many types of taxes including income tax, capital gains tax, corporate tax, sales tax, property tax, inheritance tax, and excise taxes. It also discusses the economic and legal definitions of taxes and how tax collection systems work.
Fiscal policy involves the use of government spending, taxation, and borrowing to influence a nation's economy. It aims to achieve full employment, economic growth, price stability, and other economic goals. Keynesians argue that expansionary fiscal policy can boost aggregate demand and pull an economy out of recession, while contractionary fiscal policy can reduce demand and curb inflation. However, critics note that large government deficits may crowd out private sector borrowing and investment by raising interest rates.
This document provides an example computation of income tax for Mr. De Castro, a professor with a monthly salary of 85,000 pesos. It calculates his monthly and annual tax under two scenarios: as a single filer and as married with 4 dependents. As a single filer, Mr. De Castro's tax due is 270,792 pesos resulting in an overpayment of 55,608 pesos. As married with 4 dependents, his tax due is 238,792 pesos resulting in an overpayment of 87,608 pesos.
Taxation refers to payments made to the government for which no direct benefit or service is received in return. The amount paid in taxes is unrelated to any specific government service. There are basic principles that guide an equitable tax regime, including that taxes should generate adequate revenue, be spread broadly across the population to minimize individual burden, and be coordinated, convenient, efficient, equitable, neutral, predictable, and simple for taxpayers. Exemptions should be restricted and for specific policy purposes only.
The document is a quiz about the circular flow of income model which describes the reciprocal flow of income between producers and consumers. It discusses key aspects of the model including the roles of firms and households, the significance of studying the model, and different approaches to measuring national income such as the output, income, and expenditure approaches.
The document is a quiz about market structures that contains multiple choice questions. It asks the reader to identify the type of market structure that has less market power and price takers. It also asks about barriers to entry in oligopoly markets and provides examples like the telecommunications industry starting as a monopoly.
The document contains a quiz about key terms related to market structure and the business cycle. It defines phases of the business cycle like peaks, troughs, expansions and recessions. It also discusses leading and lagging economic indicators that can be used to analyze and predict the business cycle.
This document defines key concepts relating to elasticity, including: price elasticity of demand which measures how quantity demanded responds to price changes; perfectly elastic demand where quantity demanded changes significantly with small price changes; inelastic demand where quantity demanded changes less than price; and perfectly inelastic demand where quantity demanded does not change with price. It also defines similar concepts for price elasticity of supply.
This document contains a quiz about supply and production concepts. It defines the law of supply, supply as the amount producers are willing to sell at a given price, a supply schedule as a table showing quantities supplied at different prices, a supply equation as the mathematical relationship between supply and factors affecting willingness to sell, and a supply curve as a graphical representation of the price-quantity relationship. It also defines production as the act of creating output, a production function as relating physical output to inputs, a market supply curve as the horizontal summation of individual supply curves, and factors of production as stocks like land, labor, and capital that are applied to production. Finally, it discusses an aggregate production process framework for distinguishing economic growth sources.
1. Circular flow of income or circular flow
*Refers to a simple economic model which describes the reciprocal circulation of
income between producers and consumers
*In the circular flow model, the inter-dependent entities of producer and consumer are
referred to as "firms" and "households" respectively and provide each other with factors
in order to facilitate the flow of income.
*Real Flow and Money Flow. Real Flow- In a simple economy, the flow of factor
services from households to firms and corresponding flow of goods and services from
firms to households s known to be as real flow.
Firms
Provide consumers with goods and services in exchange for consumer expenditure and
"factors of production" from households.
Human wants are unlimited and are of recurring nature therefore, production process
remains a continuous and demanding process. In this process, household sector
provides various factors of production such as land, labor, capital and enterprise to
producers who produce by goods and services by coordinating them. Producers or
business sector in return makes payments in the form of rent, wages, interest and
profits to the household sector.
Household sector spends this income to fulfill its wants in the form of consumption
expenditure.
2. Business sector supplies those goods and services produced and get income in return
of it.
Thus expenditure of one sector becomes the income of the other and supply of goods
and services by one section of the community becomes demand for the other.
A continuous flow of production, income and expenditure is known as circular flow of
income. It is circular because it has neither any beginning nor an end. The circular flow
of income involves two basic assumptions
1. In any exchange process, the seller or producer receives the same amount what
buyer or consumer spends.
2. Goods and services flow in one direction and money payment to get these flow in
return direction, causes a circular flow.
Money Flow- In a modern two sector economy, money acts as a medium of exchange
between goods and factor services.
Money flow of income refers to a monetary payment from firms to households for their
factor services and in return monetary payments from households to firms against their
goods and services.
Household sector gets monetary reward for their services in the form of rent, wages,
interest, and profit form firm sector and spends it for obtaining various types of goods to
satisfy their wants. Money acts as a helping agent in such an exchange.
Two Sector Model
In the simple two sector circular flow of income model the state of equilibrium is
defined as a situation in which there is no tendency for the levels of income (Y),
expenditure (E) and output (O) to change,
Y=E=O
This means that the expenditure of buyers (households) becomes income for sellers
(firms). The firms then spend this income on factors of production such as labour,
capital and raw materials, "transferring" their income to the factor owners. The factor
owners spend this income on goods which leads to a circular flow of income.
Three Sector Model
It includes household sector, producing sector and government sector.
3. It will study a circular flow income in these sectors excluding rest of the world i.e. closed
economy income.
Here flows from household sector and producing sector to government sector are in the
form of taxes.
The income received from the government sector flows to producing and household
sector in the form of payments for government purchases of goods and services as well
as payment of subsides and transfer payments.
Every payment has a receipt in response of it by which aggregate expenditure of an
economy becomes identical to aggregate income and makes this circular flow and
unending.
Four Sector Model
A modern monetary economy comprises a network of four sector economies this are-
1.Household sector 2.Firms or producing sector 3.Government sector 4.Rest of the
world sector.
Each of the above sectors receives some payments from the other in lieu of goods and
services which makes a regular flow of goods and physical services. Money facilitates
such an exchange smoothly.
A residual of each market comes in capital market as saving which inturn is invested in
firms and government sector.
Five sector model
LEAKAGES INJECTION
Saving (S) Investment (I)
Taxes (T) Government Spending (G)
Imports (M) Exports (X)
The five sector model of the circular flow of income is a more realistic representation of
the economy.
The first is the Financial Sector that consists of banks and non-bank intermediaries who
engage in the borrowing (savings from households) and lending of money. In terms of
the circular flow of income model the leakage that financial institutions provide in the
economy is the option for households to save their money.
4. This is a leakage because the saved money cannot be spent in the economy and thus
is an idle asset that means not all output will be purchased.
The injection that the financial sector provides into the economy is investment (I) into
the business/firms sector.
The leakage that the Government sector provides is through the collection of revenue
through Taxes (T) that is provided by households and firms to the government. For this
reason they are a leakage because it is a leakage out of the current income thus
reducing the expenditure on current goods and services.
The injection provided by the government sector is Government spending (G) that
provides collective services and welfare payments to the community. An example of a
tax collected by the government as a leakage is income tax and an injection into the
economy can be when the government redistributes this income in the form of welfare
payments that is a form of government spending back into the economy.
The final sector in the circular flow of income model is the overseas sector which
transforms the model from a closed economy to an open economy. The main leakage
from this sector are imports (M), which represent spending by residents into the rest of
the world. The main injection provided by this sector is the exports of goods and
services which generate income for the exporters from overseas residents.
In terms of the five sector circular flow of income model the state of equilibrium
occurs when the total leakages are equal to the total injections that occur in the
economy. This can be shown as:
Savings + Taxes + Imports = Investment + Government Spending + Exports
S + T + M = I + G + X.
This can be further illustrated through the fictitious economy of Noka where:
S + T + M = I + G + X
$100 + $150 + $50 = $50 + $100 + $150
$300 = $300
Therefore since the leakages are equal to the injections the economy is in a stable state
of equilibrium. This state can be contrasted to the state of disequilibrium where unlike
that of equilibrium the sum of total leakages does not equal the sum of total injections.
By giving values to the leakages and injections the circular flow of income can be used
to show the state of disequilibrium. Disequilibrium can be shown as:
S+T+M≠I+G+X
5. Therefore it can be shown as one of the below equations where:
Total leakages > Total injections
P150 (S) + P250 (T) + P150 (M) >P75 (I) + P200 (G) + 150 (X)
Or
Total Leakages < Total injections
P50 (S) + P200 (T) + $125 (M) <P75 (I) + P200 (G) + P150 (X)
The effects of disequilibrium vary according to which of the above equations they
belong to.
If S + T + M > I + G + X the levels of income, output, expenditure and employment will
fall causing a recession or contraction in the overall economic activity. But if S + T + M <
I + G + X the levels of income, output, expenditure and employment will rise causing a
boom or expansion in economic activity.
To manage this problem, if disequilibrium were to occur in the five sector circular flow of
income model, changes in expenditure and output will lead to equilibrium being
regained. An example of this is if:
S + T + M > I + G + X the levels of income, expenditure and output will fall causing a
contraction or recession in the overall economic activity. As the income falls (Figure 4)
households will cut down on all leakages such as saving, they will also pay less in
taxation and with a lower income they will spend less on imports. This will lead to a fall
in the leakages until they equal the injections and a lower level of equilibrium will be the
result.
The other equation of disequilibrium, if S + T + M < I + G + X in the five sector model the
levels of income, expenditure and output will greatly rise causing a boom in economic
activity. As the households income increases there will be a higher opportunity to save
therefore saving in the financial sector will increase, taxation for the higher threshold will
increase and they will be able to spend more on imports. In this case when the leakages
increase they will continue to rise until they are equal to the level injections. The end
result of this disequilibrium situation will be a higher level of equilibrium.
Significance of Study of Circular Flow of Income
1.Measurement of National Income- National income is an estimation of aggregation of
any of economic activity of the circular flow. It is either the income of all the factors of
production or the expenditure of various sectors of economy. However, aggregate
amount of each of the activity is identical to each other.
6. 2.Knowledge of Interdependence- Circular flow of income signifies the interdependence
of each of activity upon one another. If there is no consumption, there will be no
demand and expenditure which infacts restricts the amount of production and income.
3.Unending Nature of Economic Activities- It signifies that production, income and
expenditure are of unending nature, therefore, economic activities in an economy can
never come to a halt. National income is also bound to rise in future.
4.Injections and Leakages Reference- A General Approach to Macroeconomic Policy.
Difference between Real Flow and Money Flow
1. Real flow is the exchange of goods and services between household and firms
whereas money flow is the monetary exchange between two sectors.
2. In real flow household sector supplies raw material, land, labour, capital and
enterprise to firms and in return firms sector provides finished goods and services to
household sector. Whereas in money flow, firm sector gives remuneration in the form of
money to household sector a wages and salaries, rent, interest etc.
3. Difficulties of barter system for the exchange of goods and factor services between
households and firms sector in real flow, whereas no such difficulty or inconvenience
arise in money flow.
4. When goods and services flow from one sector of the economy to another, it is
known as real flow.
Phases or Stages of Circular Flow of Income
Production, consumption expenditure and generation of income are the three basic
economic activities of an economy that go on endlessly and are titled as circular flow of
income. Production gives rise to income, income gives rise to demand for goods and
services ; such a demand gives rise to expenditure and expenditure induces for further
production. The whole process forms the basis for circular flow of income and related
activities- production, income and expenditure are known as phases or stages of
circular flow of income.
Production → Income → Expenditure → Production.
1. Production Phase- Production means creation of utility to satisfy human wants. It
involves the co-ordination of all the factors of production in some desired ratio. This job
is performed by a producer or firm who takes an initiative with the motive of earning
profits. He hires land, labour, capital and an organization and makes them payment in
the form of rent, wages and salaries and interest. This phase is to produce goods and
services and after selling them, it generates income.
7. 2. Income Phase- Producing firms earn revenue from the sale of goods and services
produced by them. Whole of the earning is divided between factors provided by
household sector in the form of rent, wages, interest and profits. Such an income is
classified into three parts:- •Compensation of employees- Wages, salaries, commission,
bonus etc. •Operating Surplus- Profits, rent, interest, royalty etc. •Mixed Income- Income
of self- employed Thus production takes the shape of income of household sector.
3. Expenditure Phase- Household sector spends its income to satisfy unlimited and
recurring human wants. Any saving out of total income takes the shape of investment
on capital goods that helps in generating the income of the economy. Expenditure
becomes the income of producing sector that promotes further the uninterrupted flow of
income.
Gross national income
The Gross national income (GNI) consists of: the personal consumption expenditure,
the gross private investment, the government consumption expenditures, the net
income from assets abroad (net income receipts), and the gross exports of goods and
services, after deducting two components: the gross imports of goods and services, and
the indirect business taxes.
The GNI is similar to the gross national product (GNP), except that in measuring the
GNP one does not deduct the indirect business taxes.
GNI versus GDP
For example, the profits of a Philippines-owned company operating in the UK will only
count towards PHL GNI and UK GDP. If a country becomes heavily indebted, and pays
large amounts of interest to service this debt, this will be reflected in a decreased GNI
but not a decreased GDP. If a country sells off its resources to entities outside their
country this will also be reflected over time in decreased GNI, but not decreased GDP.
Therefore, the GDP appears more attractive for countries with increasing national debt
and decreasing assets.
GNP is a concept that goes hand in hand with GNI, GDP, and NNI. In contrast to the
GNI, the GNP does not account for the balance of cross-country income, such as
interest and dividends. In contrast to the GDP, the GNP account for the values of
products and services based on citizenship of the owners rather than the territory of the
activity
How to Calculate the GNI
GNI is an add up of Net Income from abroad and the GDP, one can calculate the GNI
by the following formula.
8. Measures of national income and output
A variety of measures of national income and output are used in economics to estimate
total economic activity in a country or region, including gross domestic product (GDP),
gross national product (GNP), net national income (NNI), and adjusted national income
(NNI* adjusted for natural resource depletion). All are especially concerned with
counting the total amount of goods and services produced within some "boundary”
The boundary is usually defined by geography or citizenship, and may also restrict the
goods and services that are counted. For instance, some measures count only goods
and services that are exchanged for money, excluding bartered goods, while other
measures may attempt to include bartered goods by imputing monetary values to them.
National accounts
Arriving at a figure for the total production of goods and services in a large region like a
country entails a large amount of data-collection and calculation. Although some
attempts were made to estimate national incomes as long ago as the 17th century,
The systematic keeping of national accounts, of which these figures are a part, only
began in the 1930s, in the United States and some European countries. The impetus for
that major statistical effort was the Great Depression and the rise of Keynesian
economics, which prescribed a greater role for the government in managing an
economy, and made it necessary for governments to obtain accurate information so that
their interventions into the economy could proceed as well-informed as possible.
Market value
In order to count a good or service, it is necessary to assign value to it.
The value that the measures of national income and output assign to a good or service
is its market value – the price it fetches when bought or sold.
The actual usefulness of a product (its use-value) is not measured – assuming the use-
value to be any different from its market value.
Three strategies have been used to obtain the market values of all the goods and
services produced: the product (or output) method, the expenditure method, and the
income method.
The product method looks at the economy on an industry-by-industry basis.
The total output of the economy is the sum of the outputs of every industry. However,
since an output of one industry may be used by another industry and become part of the
9. output of that second industry, to avoid counting the item twice we use not the value
output by each industry, but the value-added; that is, the difference between the value
of what it puts out and what it takes in.
The total value produced by the economy is the sum of the values-added by every
industry.
The expenditure method is based on the idea that all products are bought by somebody
or some organisation.
Therefore we sum up the total amount of money people and organisations spend in
buying things.
This amount must equal the value of everything produced. Usually expenditures by
private individuals, expenditures by businesses, and expenditures by government are
calculated separately and then summed to give the total expenditure. Also, a correction
term must be introduced to account for imports and exports outside the boundary.
The income method works by summing the incomes of all producers within the
boundary. Since what they are paid is just the market value of their product, their total
income must be the total value of the product. Wages, proprieter's incomes, and
corporate profits are the major subdivisions of income.
The output approach
The output approach focuses on finding the total output of a nation by directly finding
the total value of all goods and services a nation produces.
Because of the complication of the multiple stages in the production of a good or
service, only the final value of a good or service is included in the total output. This
avoids an issue often called 'double counting', wherein the total value of a good is
included several times in national output, by counting it repeatedly in several stages of
production. In the example of meat production, the value of the good from the farm may
be P10, then P30 from the butchers, and then P60 from the supermarket. The value that
should be included in final national output should be P60, not the sum of all those
numbers, P100. The values added at each stage of production over the previous stage
are respectively P10, P20, and P30. Their sum gives an alternative way of calculating
the value of final output.
Formulae:
GDP(gross domestic product) at market price = value of output in an economy in the
particular year - intermediate consumption
10. NNP at factor cost = GDP at market price - depreciation + NFIA (net factor income from
abroad) - net indirect taxes
The income approach
The income approach equates the total output of a nation to the total factor income
received by residents or citizens of the nation. The main types of factor income are:
Employee compensation (cost of fringe benefits, including unemployment, health,
and retirement benefits);
Interest received net of interest paid;
Rental income (mainly for the use of real estate) net of expenses of landlords;
Royalties paid for the use of intellectual property and extractable natural
resources.
All remaining value added generated by firms is called the residual or profit. If a firm has
stockholders, they own the residual, some of which they receive as dividends. Profit
includes the income of the entrepreneur - the businessman who combines factor inputs
to produce a good or service.
Formula
NDP at factor cost = Compensation of employees + Net interest + Rental & royalty
income + Profit of incorporated and unincorporated NDP at factor cost.
The expenditure approach
The expenditure approach is basically an output accounting method. It focuses on
finding the total output of a nation by finding the total amount of money spent. This is
acceptable, because like income, the total value of all goods is equal to the total amount
of money spent on goods. The basic formula for domestic output takes all the different
areas in which money is spent within the region, and then combines them to find the
total output.
Where:
C = household consumption expenditures / personal consumption expenditures
I = gross private domestic investment
G = government consumption and gross investment expenditures
X = gross exports of goods and services
M = gross imports of goods and services
Note: (X - M) is often written as XN, which stands for "net exports"
11. GDP and Gross domestic product (GDP) is defined as "the value of all final goods and
services produced in a country in 1 year".
Gross National Product (GNP) is defined as "the market value of all goods and services
produced in one year by labour and property supplied by the residents of a country."
As an example, the table below shows some GDP and GNP, and NNI data for the
United States:
National income and output (Billions of dollars)
Period Ending 2003
Gross national product 11,063.3
Net U.S. income receipts from rest of the world 55.2
U.S. income receipts 329.1
U.S. income payments -273.9
Gross domestic product 11,008.1
Private consumption of fixed capital 1,135.9
Government consumption of fixed capital 218.1
Statistical discrepancy 25.6
National Income 9,679.
NDP: Net domestic product is defined as "gross domestic product (GDP) minus
depreciation of capital",[ similar to NNP.
GDP per capita: Gross domestic product per capita is the mean value of the
output produced per person, which is also the mean income.
National income and welfare
GDP per capita (per person) is often used as a measure of a person's welfare.
Countries with higher GDP may be more likely to also score highly on other measures
of welfare, such as life expectancy. However, there are serious limitations to the
usefulness of GDP as a measure of welfare:
Measures of GDP typically exclude unpaid economic activity, most importantly
domestic work such as childcare. This leads to distortions; for example, a paid
nanny's income contributes to GDP, but an unpaid parent's time spent caring for
children will not, even though they are both carrying out the same economic
activity.
GDP takes no account of the inputs used to produce the output. For example, if
everyone worked for twice the number of hours, then GDP might roughly double,
but this does not necessarily mean that workers are better off as they would have
12. less leisure time. Similarly, the impact of economic activity on the environment is
not measured in calculating GDP.
Comparison of GDP from one country to another may be distorted by movements
in exchange rates. Measuring national income at purchasing power parity may
overcome this problem at the risk of overvaluing basic goods and services, for
example subsistence farming.
GDP does not measure factors that affect quality of life, such as the quality of the
environment (as distinct from the input value) and security from crime. This leads
to distortions - for example, spending on cleaning up an oil spill is included in
GDP, but the negative impact of the spill on well-being (e.g. loss of clean
beaches) is not measured.
GDP is the mean (average) wealth rather than median (middle-point) wealth.
Countries with a skewed income distribution may have a relatively high per-
capita GDP while the majority of its citizens have a relatively low level of income,
due to concentration of wealth in the hands of a small fraction of the population.
Because of this, other measures of welfare such as the Human Development Index
(HDI), Index of Sustainable Economic Welfare (ISEW), Genuine Progress Indicator
(GPI), gross national happiness (GNH), and sustainable national income (SNI) are
used.
Difficulties in Measurement of National Income
There are many difficulties when it comes to measuring national income, however these
can be grouped into conceptual difficulties and practical difficulties.
Conceptual Difficulties
Inclusion of Services: There has been some debate about whether to include
services in the counting of national income, and if it counts as output. Marxian
economists are of the belief that services should be excluded from national
income, most other economists though are in agreement that services should be
included.
Identifying Intermediate Goods: The basic concept of national income is to only
include final goods, intermediate goods are never included, but in reality it is very
hard to draw a clear cut line as to what intermediate goods are. Many goods can
be justified as intermediate as well as final goods depending on their use.
Identifying Factor Incomes: Separating factor incomes and non factor incomes is
also a huge problem. Factor incomes are those paid in exchange for factor
services like wages, rent, interest etc. Non factor are sale of shares selling old
cars property etc., but these are made to look like factor incomes and hence are
mistakenly included in national income.
Services of Housewives and other similar services: National income includes
those goods and services for which payment has been made, but there are
scores of jobs, for which money as such is not paid, also there are jobs which
people do themselves like maintain the gardens etc., so if they hired someone
13. else to do this for them, then national income would increase, the argument then
is why are these acts not accounted for now, but the bigger issue would be how
to keep a track of these activities and include them in national income.
Practical Difficulties
Unreported Illegal Income: Sometimes, people don't provide all the right
information about their incomes to evade taxes so this obviously causes
disparities in the counting of national income.
Non Monetized Sector: In many developing nations, there is this issue that goods
and services are traded through barter, i.e. without any money. Such goods and
services should be included in accounting of national income, but the absence of
data makes this inclusion difficult.