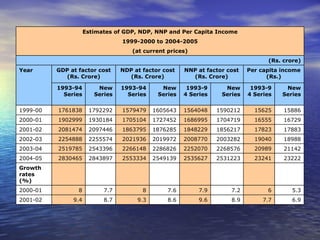
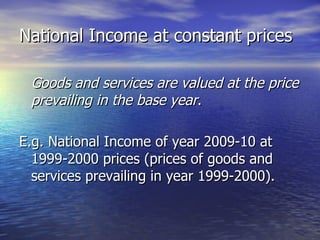
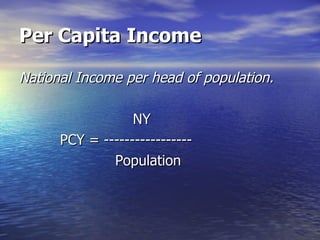
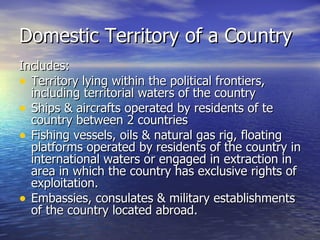
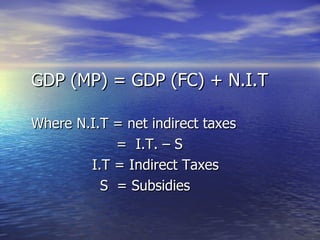
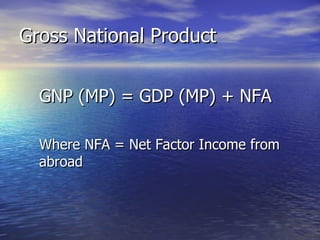
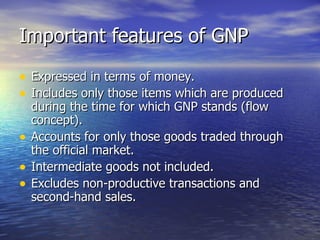
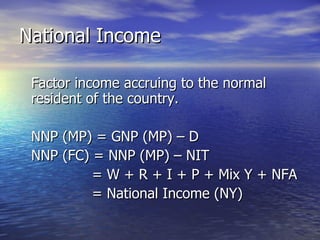
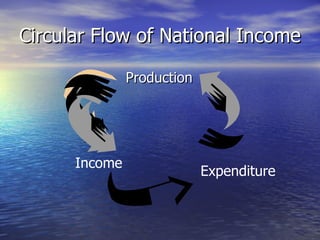
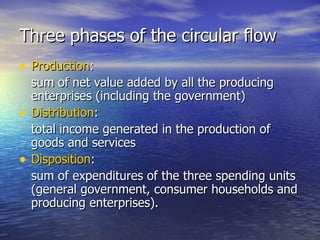
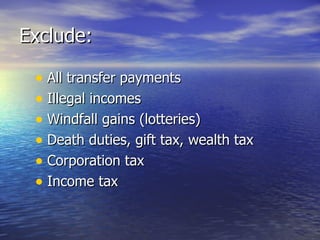
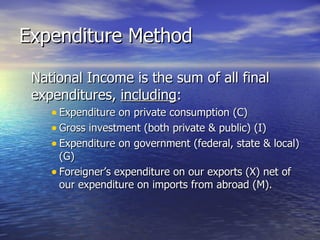
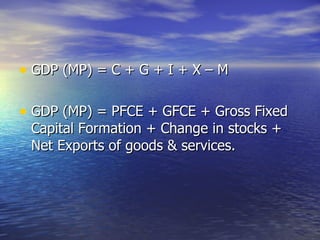
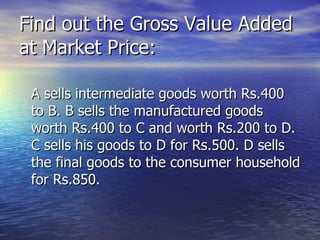
National Income & Related Concepts
National Income National income is the money value of all the final goods and services produced by a country during one year.
National Income at current prices Goods and services are valued at the prices prevailing in the markets in that particular year. E.g. National Income of 2009-10: goods and services are valued at prices prevailing in the year 2009-10.
Estimates of GDP, NDP, NNP and Per Capita Income 1999-2000 to 2004-2005 (at current prices) (Rs. crore) Year GDP at factor cost (Rs. Crore) NDP at factor cost (Rs. Crore) NNP at factor cost (Rs. Crore) Per capita income (Rs.) 1993-94 Series New Series 1993-94 Series New Series 1993-94 Series New Series 1993-94 Series New Series 1999-00 1761838 1792292 1579479 1605643 1564048 1590212 15625 15886 2000-01 1902999 1930184 1705104 1727452 1686995 1704719 16555 16729 2001-02 2081474 2097446 1863795 1876285 1848229 1856217 17823 17883 2002-03 2254888 2255574 2021936 2019972 2008770 2003282 19040 18988 2003-04 2519785 2543396 2266148 2286826 2252070 2268576 20989 21142 2004-05 2830465 2843897 2553334 2549139 2535627 2531223 23241 23222 Growth rates (%)                       2000-01 8 7.7 8 7.6 7.9 7.2 6 5.3 2001-02 9.4 8.7 9.3 8.6 9.6 8.9 7.7 6.9
National Income at constant prices Goods and services are valued at the price prevailing in the base year .  E.g. National Income of year 2009-10 at 1999-2000 prices (prices of goods and services prevailing in year 1999-2000).
Estimates of GDP, NDP, NNP and Per Capita Income 1999-2000 to 2004-2005 (at constant prices) (old series at 1993-94 prices and new series at 1999-2000 prices) (Rs. crore) Year GDP at factor cost (Rs. Crore) NDP at factor cost (Rs. Crore) NNP at factor cost (Rs. Crore) Per Capita Income (Rs.) 1993-94 Series New Series 1993-94 Series New Series 1993-94 Series New Series 1993-94 Series New Series 1999-00 1148367 1792292 1019296 1605643 1008114 1590212 10071 15886 2000-01 1198592 1870388 1062492 1675633 1050338 1653088 10308 16223 2001-02 1267945 1978056 1125480 1775952 1115171 1755281 10754 16910 2003-04 1430548 2226041 1274074 2004703 1266005 1986858 11799 18517
Per Capita Income National Income per head of population.   NY   PCY = -----------------   Population
Some Basic Concepts
Domestic Territory of a Country Includes: Territory lying within the political frontiers, including territorial waters of the country Ships & aircrafts operated by residents of te country between 2 countries Fishing vessels, oils & natural gas rig, floating platforms operated by residents of the country in international waters or engaged in extraction in area in which the country has exclusive rights of exploitation. Embassies, consulates & military establishments of the country located abroad.
Normal Residents of a Country Resident => a person who “ordinarily” resides in a country and whose centre of interest lies in that country. Normal residents => covers both individuals and institutions. It includes nationals and non-nationals residing in a country.
Exceptions  International organisations like World Health Organisation, World Bank, IMF, ILO Resident HHs & individuals cover all individuals living within the domestic territory except the following: Foreign visitors for recreation, holidays, medical treatment, study tours, conferences, etc. Crew member of foreign vessels, commercial travelers & seasonal workers. Officials, diplomats & members of armed forces of a foreign country Employees of international organisations who are not citizen of the country in which the office is located Foreigners who are the employees of non-resident enterprises and who have come to the country for installing machines or equipment purchased from their employers.
Stock variables Measures of economic activity at a point in time .
Examples of Stock Var. Wealth (an accumulation of savings over time)    Debt (an accumulation of borrowing over time)  Capital Stock (Factories, Machinery, Inventory, Infrastructure)  The Money Supply  Any Balance Sheet measures (Assets, Liabilities, Owner's Equity)
Flow Variables Economic activity measured per unit of time  .
Examples of Flow Var. Income (Household, Per-Capita, National)  Budget Deficits  Investment Expenditure  Consumption Expenditure  Any Income Statement measures (Sales Revenue, Gross Profit, Expenses)
Closed Economy A country which has no economic relations with other countries. All other countries (except the one under consideration) are grouped into one category “rest of the world”.
Open Economy A country having economic relations with the rest of the world. Selling goods and services to foreigners (exports) Purchasing goods and services from the rest of the world (imports) Selling shares, bonds, debentures to foreigners  Lending and borrowing Sending gifts to foreigners and receiving gifts from them Normal resident going to foreign countries to work there, and foreign residents coming and working in the domestic territory of the country.
Net Factor Income from Abroad Income attributable to factor services rendered by the normal residents of a country to the rest of the world  less  factor services rendered to them by the rest of the world. Includes: Net  compensation of employees Net  income from property and entrepreneurship (interest, rent, profits and dividends); and Net  retained earnings of resident companies abroad.
Basic Economic Activities
Production Consumption Capital Accumulation
Production Any activity which produces a commodity or increases the value of a commodity already produced.
Consumption Using up of goods and services to satisfy human wants. Destruction of utility.
Capital Formation Surplus of production over consumption in an accounting year. That which adds to further production.
Construction of New Assets (buildings, roads, bridges, transport equipment). Production of machine and equipment Increase in the stock of raw materials, semi-finished goods and finished goods during an accounting year.
Income Concepts
Net Domestic Product at Factor Cost Also called Domestic Factor Income (DFY) NDP (FC) is defined as the net value added by all the producers within the domestic territory of the country.
NDP (FC) = Wages + Rent + Interest + Profit + Mixed Income of the self-employed NDP (FC) = compensation of employees + operating surplus + mixed income of self-employed
Gross Domestic Product  GDP (FC) = NDP (FC) + D Where D = depreciation
GDP (MP) = GDP (FC) + N.I.T Where N.I.T = net indirect taxes =  I.T. – S  I.T = Indirect Taxes   S  = Subsidies
Gross National Product GNP (MP) = GDP (MP) + NFA Where NFA = Net Factor Income from abroad
Important features of GNP Expressed in terms of money. Includes only those items which are produced during the time for which GNP stands (flow concept). Accounts for only those goods traded through the official market. Intermediate goods not included. Excludes non-productive transactions and second-hand sales.
National Income Factor income accruing to the normal resident of the country. NNP (MP) = GNP (MP) – D NNP (FC) = NNP (MP) – NIT   = W + R + I + P + Mix Y + NFA   = National Income (NY)
  NFA  (6)     NIT  (5) 5 6     D  (4) 4 4 5 6 Wages (1) 1 1 1 1 1 R+I+P (2) 2 2 2 2 2 Mixed Income (3) 3 3 3 3 3 NDP   (FC) GDP (FC) GDP (MP) GNP (MP) NNP (MP) NNP (FC)   NY
Important relations Gross – Net = Depreciation M.P. – FC = N.I.T National – Domestic = NFA
Quick Review NDP (FC) W + I + R + P + Mix Y GDP (MP) NDP(FC) + D + NIT (=IT - S) Widest concept of NY? GNP (MP)  = NDP(FC) + D + NIT (=IT - S) + NFA = GDP (MP) + NFA National Income (NY) NNP (FC) = NDP (FC) + NFA   = GNP (MP) – D – NIT
Other Income Concepts
Sectors of the Economy Economy = Government + Private Government = central, state & local Private = households (HH). Firms = government + HH
Private Income Private Income = NDP (FC)  –  Income from property & entrepreneurship accruing to government  –  savings of non-departmental enterprises  + National Debt Interest  + NFA  + current transfers from government  + other transactions from rest of the world.
Personal Income Current Income of persons or HHs from all sources. Personal Income = Private Income  –  savings of private corporate sector  net  of retained earnings of foreign sector  –  Corporation Tax
Personal Disposable Income Income at the disposal of the HHs from all sources. PDY = Personal Income –  Direct Taxes paid by HHs  –  miscellaneous receipts of government.
Methods to Measure National Income
Circular Flow of National Income   Production Income Expenditure
Three phases of the circular flow Production : sum of net value added by all the producing enterprises (including the government)  Distribution : total income generated in the production of goods and services Disposition :  sum of expenditures of the three spending units (general government, consumer households and producing enterprises).
Product (Value Added) Method Measures the contribution of each producing enterprise in the domestic territory of the country.
An Example
Value of Output = Volume of physical output x Market Price Value of intermediate consumption = price paid by the enterprise.
Include: Own account production of fixed assets by government, enterprises & households Production for self consumption Imputed rent of owner-occupied houses Not included :  Sale of second-hand goods Brokerage and commission earned by dealers of second hand goods are a part of current production.
GDP (MP) =    NVA by Primary sector  + NVA by Secondary sector  + NVA by Tertiary sector NDP (FC) = Value of Output  –  Value of intermediate consumption  –  D - NIT
Income Method For every rupee’s worth of goods & services produced, a rupee’s worth of income is generated. Income Method should give the same value of National Income as Value Added Method.
NDP (FC) = Wages + Rent + Interest + Profits + Mixed Income of self-employed National Income = NDP (FC) + NFA
Include: Value of production for self consumption. Imputed rent of owner occupied houses.
Exclude: All transfer payments Illegal incomes Windfall gains (lotteries) Death duties, gift tax, wealth tax Corporation tax Income tax
Expenditure Method National Income is the sum of all final expenditures,  including : Expenditure on private consumption (C) Gross investment (both private & public) (I) Expenditure on government (federal, state & local) (G) Foreigner’s expenditure on our exports (X) net of our expenditure on imports from abroad (M).
GDP (MP) = C + G + I + X – M GDP (MP) = PFCE + GFCE + Gross Fixed Capital Formation + Change in stocks + Net Exports of goods & services.
Find out the Gross Value Added at Market Price: A sells intermediate goods worth Rs.400 to B. B sells the manufactured goods worth Rs.400 to C and worth Rs.200 to D. C sells his goods to D for Rs.500. D sells the final goods to the consumer household for Rs.850.
Happy Counting!!!

4 national income

  • 1.
    National Income &Related Concepts
  • 2.
    National Income Nationalincome is the money value of all the final goods and services produced by a country during one year.
  • 3.
    National Income atcurrent prices Goods and services are valued at the prices prevailing in the markets in that particular year. E.g. National Income of 2009-10: goods and services are valued at prices prevailing in the year 2009-10.
  • 4.
    Estimates of GDP,NDP, NNP and Per Capita Income 1999-2000 to 2004-2005 (at current prices) (Rs. crore) Year GDP at factor cost (Rs. Crore) NDP at factor cost (Rs. Crore) NNP at factor cost (Rs. Crore) Per capita income (Rs.) 1993-94 Series New Series 1993-94 Series New Series 1993-94 Series New Series 1993-94 Series New Series 1999-00 1761838 1792292 1579479 1605643 1564048 1590212 15625 15886 2000-01 1902999 1930184 1705104 1727452 1686995 1704719 16555 16729 2001-02 2081474 2097446 1863795 1876285 1848229 1856217 17823 17883 2002-03 2254888 2255574 2021936 2019972 2008770 2003282 19040 18988 2003-04 2519785 2543396 2266148 2286826 2252070 2268576 20989 21142 2004-05 2830465 2843897 2553334 2549139 2535627 2531223 23241 23222 Growth rates (%)                       2000-01 8 7.7 8 7.6 7.9 7.2 6 5.3 2001-02 9.4 8.7 9.3 8.6 9.6 8.9 7.7 6.9
  • 5.
    National Income atconstant prices Goods and services are valued at the price prevailing in the base year . E.g. National Income of year 2009-10 at 1999-2000 prices (prices of goods and services prevailing in year 1999-2000).
  • 6.
    Estimates of GDP,NDP, NNP and Per Capita Income 1999-2000 to 2004-2005 (at constant prices) (old series at 1993-94 prices and new series at 1999-2000 prices) (Rs. crore) Year GDP at factor cost (Rs. Crore) NDP at factor cost (Rs. Crore) NNP at factor cost (Rs. Crore) Per Capita Income (Rs.) 1993-94 Series New Series 1993-94 Series New Series 1993-94 Series New Series 1993-94 Series New Series 1999-00 1148367 1792292 1019296 1605643 1008114 1590212 10071 15886 2000-01 1198592 1870388 1062492 1675633 1050338 1653088 10308 16223 2001-02 1267945 1978056 1125480 1775952 1115171 1755281 10754 16910 2003-04 1430548 2226041 1274074 2004703 1266005 1986858 11799 18517
  • 7.
    Per Capita IncomeNational Income per head of population. NY PCY = ----------------- Population
  • 8.
  • 9.
    Domestic Territory ofa Country Includes: Territory lying within the political frontiers, including territorial waters of the country Ships & aircrafts operated by residents of te country between 2 countries Fishing vessels, oils & natural gas rig, floating platforms operated by residents of the country in international waters or engaged in extraction in area in which the country has exclusive rights of exploitation. Embassies, consulates & military establishments of the country located abroad.
  • 10.
    Normal Residents ofa Country Resident => a person who “ordinarily” resides in a country and whose centre of interest lies in that country. Normal residents => covers both individuals and institutions. It includes nationals and non-nationals residing in a country.
  • 11.
    Exceptions Internationalorganisations like World Health Organisation, World Bank, IMF, ILO Resident HHs & individuals cover all individuals living within the domestic territory except the following: Foreign visitors for recreation, holidays, medical treatment, study tours, conferences, etc. Crew member of foreign vessels, commercial travelers & seasonal workers. Officials, diplomats & members of armed forces of a foreign country Employees of international organisations who are not citizen of the country in which the office is located Foreigners who are the employees of non-resident enterprises and who have come to the country for installing machines or equipment purchased from their employers.
  • 12.
    Stock variables Measuresof economic activity at a point in time .
  • 13.
    Examples of StockVar. Wealth (an accumulation of savings over time)   Debt (an accumulation of borrowing over time) Capital Stock (Factories, Machinery, Inventory, Infrastructure) The Money Supply Any Balance Sheet measures (Assets, Liabilities, Owner's Equity)
  • 14.
    Flow Variables Economicactivity measured per unit of time .
  • 15.
    Examples of FlowVar. Income (Household, Per-Capita, National) Budget Deficits Investment Expenditure Consumption Expenditure Any Income Statement measures (Sales Revenue, Gross Profit, Expenses)
  • 16.
    Closed Economy Acountry which has no economic relations with other countries. All other countries (except the one under consideration) are grouped into one category “rest of the world”.
  • 17.
    Open Economy Acountry having economic relations with the rest of the world. Selling goods and services to foreigners (exports) Purchasing goods and services from the rest of the world (imports) Selling shares, bonds, debentures to foreigners Lending and borrowing Sending gifts to foreigners and receiving gifts from them Normal resident going to foreign countries to work there, and foreign residents coming and working in the domestic territory of the country.
  • 18.
    Net Factor Incomefrom Abroad Income attributable to factor services rendered by the normal residents of a country to the rest of the world less factor services rendered to them by the rest of the world. Includes: Net compensation of employees Net income from property and entrepreneurship (interest, rent, profits and dividends); and Net retained earnings of resident companies abroad.
  • 19.
  • 20.
  • 21.
    Production Any activitywhich produces a commodity or increases the value of a commodity already produced.
  • 22.
    Consumption Using upof goods and services to satisfy human wants. Destruction of utility.
  • 23.
    Capital Formation Surplusof production over consumption in an accounting year. That which adds to further production.
  • 24.
    Construction of NewAssets (buildings, roads, bridges, transport equipment). Production of machine and equipment Increase in the stock of raw materials, semi-finished goods and finished goods during an accounting year.
  • 25.
  • 26.
    Net Domestic Productat Factor Cost Also called Domestic Factor Income (DFY) NDP (FC) is defined as the net value added by all the producers within the domestic territory of the country.
  • 27.
    NDP (FC) =Wages + Rent + Interest + Profit + Mixed Income of the self-employed NDP (FC) = compensation of employees + operating surplus + mixed income of self-employed
  • 28.
    Gross Domestic Product GDP (FC) = NDP (FC) + D Where D = depreciation
  • 29.
    GDP (MP) =GDP (FC) + N.I.T Where N.I.T = net indirect taxes = I.T. – S I.T = Indirect Taxes S = Subsidies
  • 30.
    Gross National ProductGNP (MP) = GDP (MP) + NFA Where NFA = Net Factor Income from abroad
  • 31.
    Important features ofGNP Expressed in terms of money. Includes only those items which are produced during the time for which GNP stands (flow concept). Accounts for only those goods traded through the official market. Intermediate goods not included. Excludes non-productive transactions and second-hand sales.
  • 32.
    National Income Factorincome accruing to the normal resident of the country. NNP (MP) = GNP (MP) – D NNP (FC) = NNP (MP) – NIT = W + R + I + P + Mix Y + NFA = National Income (NY)
  • 33.
      NFA (6)     NIT (5) 5 6     D (4) 4 4 5 6 Wages (1) 1 1 1 1 1 R+I+P (2) 2 2 2 2 2 Mixed Income (3) 3 3 3 3 3 NDP (FC) GDP (FC) GDP (MP) GNP (MP) NNP (MP) NNP (FC)   NY
  • 34.
    Important relations Gross– Net = Depreciation M.P. – FC = N.I.T National – Domestic = NFA
  • 35.
    Quick Review NDP(FC) W + I + R + P + Mix Y GDP (MP) NDP(FC) + D + NIT (=IT - S) Widest concept of NY? GNP (MP) = NDP(FC) + D + NIT (=IT - S) + NFA = GDP (MP) + NFA National Income (NY) NNP (FC) = NDP (FC) + NFA = GNP (MP) – D – NIT
  • 36.
  • 37.
    Sectors of theEconomy Economy = Government + Private Government = central, state & local Private = households (HH). Firms = government + HH
  • 38.
    Private Income PrivateIncome = NDP (FC) – Income from property & entrepreneurship accruing to government – savings of non-departmental enterprises + National Debt Interest + NFA + current transfers from government + other transactions from rest of the world.
  • 39.
    Personal Income CurrentIncome of persons or HHs from all sources. Personal Income = Private Income – savings of private corporate sector net of retained earnings of foreign sector – Corporation Tax
  • 40.
    Personal Disposable IncomeIncome at the disposal of the HHs from all sources. PDY = Personal Income – Direct Taxes paid by HHs – miscellaneous receipts of government.
  • 41.
    Methods to MeasureNational Income
  • 42.
    Circular Flow ofNational Income Production Income Expenditure
  • 43.
    Three phases ofthe circular flow Production : sum of net value added by all the producing enterprises (including the government) Distribution : total income generated in the production of goods and services Disposition : sum of expenditures of the three spending units (general government, consumer households and producing enterprises).
  • 44.
    Product (Value Added)Method Measures the contribution of each producing enterprise in the domestic territory of the country.
  • 45.
  • 46.
    Value of Output= Volume of physical output x Market Price Value of intermediate consumption = price paid by the enterprise.
  • 47.
    Include: Own accountproduction of fixed assets by government, enterprises & households Production for self consumption Imputed rent of owner-occupied houses Not included : Sale of second-hand goods Brokerage and commission earned by dealers of second hand goods are a part of current production.
  • 48.
    GDP (MP) = NVA by Primary sector + NVA by Secondary sector + NVA by Tertiary sector NDP (FC) = Value of Output – Value of intermediate consumption – D - NIT
  • 49.
    Income Method Forevery rupee’s worth of goods & services produced, a rupee’s worth of income is generated. Income Method should give the same value of National Income as Value Added Method.
  • 50.
    NDP (FC) =Wages + Rent + Interest + Profits + Mixed Income of self-employed National Income = NDP (FC) + NFA
  • 51.
    Include: Value ofproduction for self consumption. Imputed rent of owner occupied houses.
  • 52.
    Exclude: All transferpayments Illegal incomes Windfall gains (lotteries) Death duties, gift tax, wealth tax Corporation tax Income tax
  • 53.
    Expenditure Method NationalIncome is the sum of all final expenditures, including : Expenditure on private consumption (C) Gross investment (both private & public) (I) Expenditure on government (federal, state & local) (G) Foreigner’s expenditure on our exports (X) net of our expenditure on imports from abroad (M).
  • 54.
    GDP (MP) =C + G + I + X – M GDP (MP) = PFCE + GFCE + Gross Fixed Capital Formation + Change in stocks + Net Exports of goods & services.
  • 55.
    Find out theGross Value Added at Market Price: A sells intermediate goods worth Rs.400 to B. B sells the manufactured goods worth Rs.400 to C and worth Rs.200 to D. C sells his goods to D for Rs.500. D sells the final goods to the consumer household for Rs.850.
  • 56.