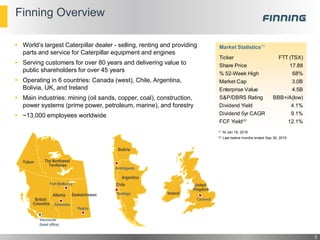
- Finning International is the world's largest Caterpillar dealer, selling and servicing Caterpillar equipment and engines in Canada, South America, UK and Ireland.
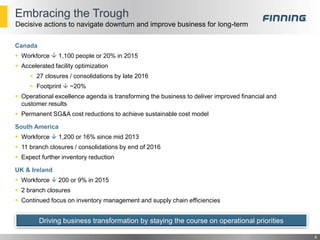
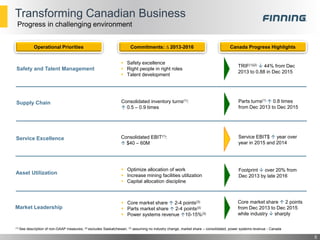
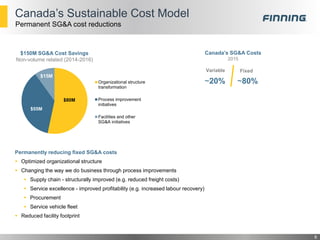
- In response to downturns, Finning has taken decisive actions like reducing workforce by over 20% in Canada and 16% in South America, closing underperforming locations, and permanently reducing fixed costs through organizational restructuring and process improvements.
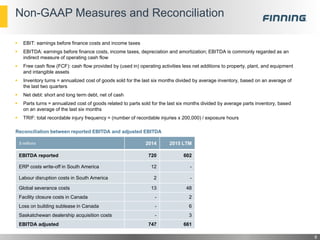
- Finning has a resilient business model with consistently strong cash flows, paying dividends at a sustainable rate of 13-19% of EBITDA and generating positive free cash flow even in difficult markets.