1) Finning International is acquiring the operating assets of the Caterpillar dealership in Saskatchewan for $230 million. This will make Finning the approved Caterpillar dealer in the province.
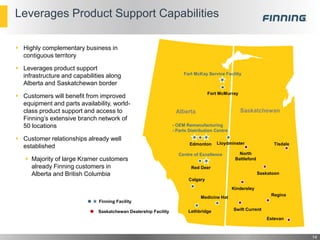
2) The acquisition is immediately accretive to earnings per share and leverages Finning's existing product support infrastructure along the Alberta-Saskatchewan border.
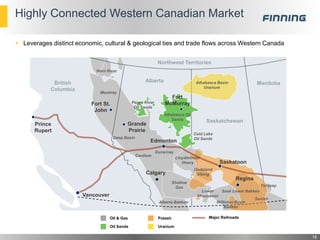
3) It provides opportunities for synergies across Finning's territories in Western Canada through improved equipment availability and seamless customer relationships in Saskatchewan, Alberta, and British Columbia.