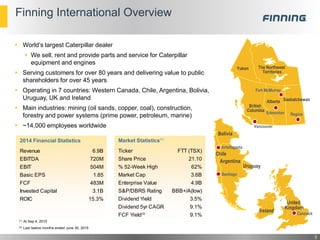
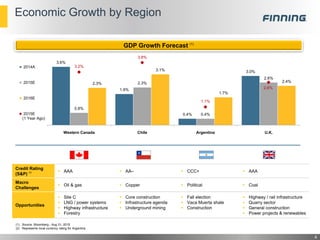
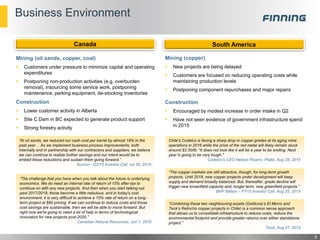
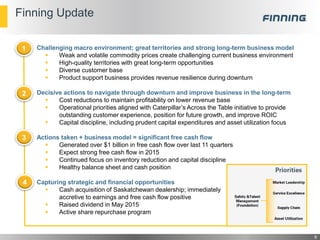
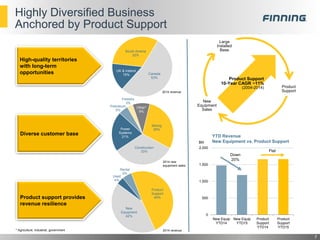
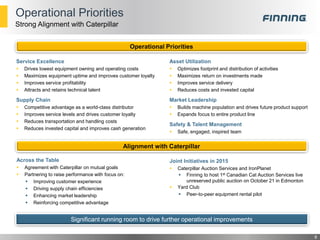
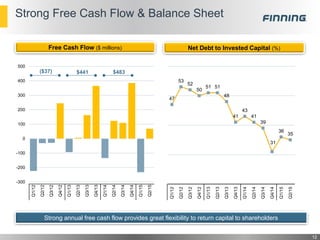
SlideShare a Scribd company logo
INVESTOR PRESENTATION
Scott Thomson, President & CEO
Steve Nielsen, EVP & CFO
Mauk Breukels, VP Investor Relations & Corporate Affairs
New York, Toronto
September 8-9, 2015
Forward Looking Information
2
Monetary amounts are in Canadian dollars and from continuing operations unless noted otherwise
This report contains statements about the Company’s business outlook, objectives, plans, strategic priorities and other statements that are not historical facts. A
statement Finning makes is forward-looking when it uses what the Company knows and expects today to make a statement about the future. Forward-looking
statements may include words such as aim, anticipate, assumption, believe, could, expect, goal, guidance, intend, may, objective, outlook, plan, project, seek,
should, strategy, strive, target, and will. Forward-looking statements in this report include, but are not limited to, statements with respect to: expectations with respect
to the economy and associated impact on the Company’s financial results; expected revenue; expected free cash flow; EBIT margin; ROIC; market share growth;
expected results from service excellence action plans; anticipated asset utilization; inventory turns and parts service levels; the expected target range of the
Company’s net debt to invested capital ratio; and the expected financial impact from the acquisition of the operating assets of the Caterpillar dealer in
Saskatchewan. All such forward-looking statements are made pursuant to the ‘safe harbour’ provisions of applicable Canadian securities laws.
Unless otherwise indicated by us, forward-looking statements in this report reflect Finning’s expectations at September 8, 2015. Except as may be required by
Canadian securities laws, Finning does not undertake any obligation to update or revise any forward-looking statement, whether as a result of new information,
future events, or otherwise.
Forward-looking statements, by their very nature, are subject to numerous risks and uncertainties and are based on several assumptions which give rise to the
possibility that actual results could differ materially from the expectations expressed in or implied by such forward-looking statements and that Finning’s business
outlook, objectives, plans, strategic priorities and other statements that are not historical facts may not be achieved. As a result, Finning cannot guarantee that any
forward-looking statement will materialize. Factors that could cause actual results or events to differ materially from those expressed in or implied by these forward-
looking statements include: general economic and market conditions; foreign exchange rates; commodity prices; the level of customer confidence and spending,
and the demand for, and prices of, Finning’s products and services; Finning’s dependence on the continued market acceptance of Caterpillar’s products and
Caterpillar’s timely supply of parts and equipment; Finning’s ability to continue to improve productivity and operational efficiencies while continuing to maintain
customer service; Finning’s ability to manage cost pressures as growth in revenue occurs; Finning’s ability to reduce costs in response to slowing activity levels;
Finning’s ability to attract sufficient skilled labour resources to meet growing product support demand; Finning’s ability to negotiate and renew collective bargaining
agreements with satisfactory terms for Finning’s employees and the Company; the intensity of competitive activity; Finning’s ability to raise the capital needed to
implement its business plan; regulatory initiatives or proceedings, litigation and changes in laws or regulations; stock market volatility; changes in political and
economic environments for operations; the integrity, reliability, availability and benefits from information technology and the data processed by that technology.
Forward-looking statements are provided in this report for the purpose of giving information about management’s current expectations and plans and allowing
investors and others to get a better understanding of Finning’s operating environment. However, readers are cautioned that it may not be appropriate to use such
forward-looking statements for any other purpose.
Forward-looking statements made in this report are based on a number of assumptions that Finning believed were reasonable on the day the Company made the
forward-looking statements. Refer in particular to the Outlook section of this MD&A. Some of the assumptions, risks, and other factors which could cause results to
differ materially from those expressed in the forward-looking statements contained in this report are discussed in Section 4 of the Company’s current AIF.
Finning cautions readers that the risks described in the AIF are not the only ones that could impact the Company. Additional risks and uncertainties not currently
known to the Company or that are currently deemed to be immaterial may also have a material adverse effect on Finning’s business, financial condition, or results of
operations.
Except as otherwise indicated, forward-looking statements do not reflect the potential impact of any non-recurring or other unusual items or of any dispositions,
mergers, acquisitions, other business combinations or other transactions that may be announced or that may occur after the date hereof. The financial impact of
these transactions and non-recurring and other unusual items can be complex and depends on the facts particular to each of them. Finning therefore cannot
describe the expected impact in a meaningful way or in the same way Finning presents known risks affecting its business.
Finning International Overview
 World’s largest Caterpillar dealer
 We sell, rent and provide parts and service for Caterpillar
equipment and engines
 Serving customers for over 80 years and delivering value to public
shareholders for over 45 years
 Operating in 7 countries: Western Canada, Chile, Argentina, Bolivia,
Uruguay, UK and Ireland
 Main industries: mining (oil sands, copper, coal), construction,
forestry and power systems (prime power, petroleum, marine)
 ~14,000 employees worldwide
3
Santiago
Antofagasta
Bolivia
Argentina
Chile
Uruguay
Cannock
United
Kingdom
Ireland
(1) At Sep 4, 2015
(2) Last twelve months ended June 30, 2015
Vancouver
Edmonton
Fort McMurray
British
Columbia
Yukon
Alberta
The Northwest
Territories
Regina
Saskatchewan
2014 Financial Statistics
Revenue 6.9B
EBITDA 720M
EBIT 504M
Basic EPS 1.85
FCF 483M
Invested Capital 3.1B
ROIC 15.3%
Market Statistics(1)
Ticker FTT (TSX)
Share Price 21.10
% 52-Week High 62%
Market Cap 3.6B
Enterprise Value 4.9B
S&P/DBRS Rating BBB+/A(low)
Dividend Yield 3.5%
Dividend 5yr CAGR 9.1%
FCF Yield(2)
9.1%
Credit Rating
(S&P) (2)  AAA  AA–  CCC+  AAA
Macro
Challenges
 Oil & gas  Copper  Political  Coal
Opportunities
 Site C
 LNG / power systems
 Highway infrastructure
 Forestry
 Core construction
 Infrastructure agenda
 Underground mining
 Fall election
 Vaca Muerta shale
 Construction
 Highway / rail infrastructure
 Quarry sector
 General construction
 Power projects & renewables
Economic Growth by Region
4
GDP Growth Forecast (1)
(1) Source: Bloomberg - Aug 31, 2015
(2) Represents local currency rating for Argentina
3.6%
1.9%
0.4%
3.0%
0.8%
2.3%
0.4%
2.6%
2.3%
3.1%
1.7%
2.4%
3.2%
3.8%
1.1%
2.6%
Western Canada Chile Argentina U.K.
2014A
2015E
2016E
2015E
(1 Year Ago)
Business Environment
5
South AmericaCanada
Mining (oil sands, copper, coal)
 Customers under pressure to minimize capital and operating
expenditures
 Postponing non-production activities (e.g. overburden
removal), insourcing some service work, postponing
maintenance, parking equipment, de-stocking inventories
Construction
 Lower customer activity in Alberta
 Site C Dam in BC expected to generate product support
 Strong forestry activity
Mining (copper)
 New projects are being delayed
 Customers are focused on reducing operating costs while
maintaining production levels
 Postponing component repurchases and major repairs
Construction
 Encouraged by modest increase in order intake in Q2
 Have not seen evidence of government infrastructure spend
in 2015
“At oil sands, we reduced our cash cost per barrel by almost 18% in the
past year… As we implement business process improvements, both
internally and in partnership with our contractors and suppliers, we believe
we can continue to realize further savings and our intent would be to
embed these reductions and sustain them going forward.”
Suncor - Q2/15 Investor Call, Jul 30, 2015
“The challenge that you have when you talk about the future is underlying
economics. We do need an internal rate of return of 15% after-tax to
continue on with any new projects. And then when you start talking out
past 2017/2018, those become a little nebulous, and in today's cost
environment, it is very difficult to achieve a 15% rate of return on a long-
term project at $60 pricing. If we can continue to reduce costs and those
cost savings are sustainable, then we will be able to move forward. But
right now we're going to need a lot of help in terms of technological
innovation for new projects post-2020.”
Canadian Natural Resources, Jun 1, 2015
Chile's Codelco is facing a sharp drop in copper grades at its aging mine
operations in 2016 while the price of the red metal will likely remain stuck
around $2.50/lb. “It does not look like it will be a year to be smiling. Next
year is going to be very tough."
Codelco’s CEO Nelson Pizarro, Platts, Aug 28, 2015
“The copper markets are still attractive, though, for long-term growth
projects. Until 2018, new copper projects under development will keep
supply and demand broadly balanced. But, thereafter, grade decline will
trigger new brownfield capacity and, longer term, new greenfield projects.”
BHP Billiton – FY15 Investor Call, Aug 25, 2015
“Combining these two neighbouring assets (Goldcorp’s El Morro and
Teck’s Relincho copper projects in Chile) is a common sense approach
that allows us to consolidate infrastructure to reduce costs, reduce the
environmental footprint and provide greater returns over either standalone
project.”
Teck, Aug 27, 2015
Finning Update
Challenging macro environment; great territories and strong long-term business model
 Weak and volatile commodity prices create challenging current business environment
 High-quality territories with great long-term opportunities
 Diverse customer base
 Product support business provides revenue resilience during downturn
Decisive actions to navigate through downturn and improve business in the long-term
 Cost reductions to maintain profitability on lower revenue base
 Operational priorities aligned with Caterpillar’s Across the Table initiative to provide
outstanding customer experience, position for future growth, and improve ROIC
 Capital discipline, including prudent capital expenditures and asset utilization focus
Actions taken + business model = significant free cash flow
 Generated over $1 billion in free cash flow over last 11 quarters
 Expect strong free cash flow in 2015
 Continued focus on inventory reduction and capital discipline
 Healthy balance sheet and cash position
Capturing strategic and financial opportunities
 Cash acquisition of Saskatchewan dealership; immediately
accretive to earnings and free cash flow positive
 Raised dividend in May 2015
 Active share repurchase program
1
2
3
4
6
Product
Support
49%
New
Equipment
42%
Used
4%
Rental
5%
Construction
33%
Power
Systems
21%
Petroleum
5%
Forestry
3%
Other*
9%
Mining
29%
7
* Agriculture, industrial, government
High-quality territories
with long-term
opportunities
Diverse customer base
Highly Diversified Business
Anchored by Product Support
UK & Ireland
15%
South Ameria
32%
Canada
53%
2014 revenue
2014 new
equipment sales
2014 revenue
Product support provides
revenue resilience
Large
Installed
Base
Product
Support
New
Equipment
Sales
Product Support
10-Year CAGR ~11%
(2004-2014)
0
500
1,000
1,500
2,000
New Equip
YTD14
New Equip
YTD15
Product
Support
YTD14
Product
Support
YTD15
Down
20%
Flat
$M
YTD Revenue
New Equipment vs. Product Support
Operational Priorities
8
Strong Alignment with Caterpillar
Service Excellence
 Drives lowest equipment owning and operating costs
 Maximizes equipment uptime and improves customer loyalty
 Improves service profitability
 Attracts and retains technical talent
Supply Chain
 Competitive advantage as a world-class distributor
 Improves service levels and drives customer loyalty
 Reduces transportation and handling costs
 Reduces invested capital and improves cash generation
Alignment with Caterpillar
Operational Priorities
Across the Table
 Agreement with Caterpillar on mutual goals
 Partnering to raise performance with focus on:
 Improving customer experience
 Driving supply chain efficiencies
 Enhancing market leadership
 Reinforcing competitive advantage
Asset Utilization
 Optimizes footprint and distribution of activities
 Maximizes return on investments made
 Improves service delivery
 Reduces costs and invested capital
Market Leadership
 Builds machine population and drives future product support
 Expands focus to entire product line
Safety & Talent Management
 Safe, engaged, inspired team
Joint Initiatives in 2015
 Caterpillar Auction Services and IronPlanet
 Finning to host 1st Canadian Cat Auction Services live
unreserved public auction on October 21 in Edmonton
 Yard Club
 Peer-to-peer equipment rental pilot
Significant running room to drive further operational improvements
Taking Action – Safe, Engaged, Inspired Team
9
Category Actions Statistics
 Global best practices
 Aligned on Life Saving Rules
 Pre-task hazard assessment for all jobs
 Highest personal protective equipment
standards
 Mix of role adjustments and new talent
 Significant realignment in Canada
 Full executive team now in place
 Strong executive leadership visibility
 Focus on communication and employee recognition
 Strategic clarity and focus
 Full alignment with Operational Priorities
 Emphasis on improving ROIC
 Change at executive and management level
Employee
Engagement
Focus on
Safety
Right People
in the Right
Roles
Aligned
Incentives
Short Term
 Safety
 EBIT margin
 Free cash flow
 Customer loyalty
 Invested capital turnover
Long Term
 Return on invested capital
 Total shareholder return
(1) Total Recordable Injury Frequency (3) In the last two years(2) Regional presidents included in Finning International headcount
# Exec(2)
New to
Role (3)
New to
FTT(3)
Finning Int’l 8 5 3
Canada 8 6 2
FINSA 6 2 2
UK 4 1 1
TRIF(1)
2013 2014 % Change
Finning Int’l 0.99 0.75 25%
Canada 1.69 1.16 31%
FINSA 0.52 0.46 12%
UK 0.76 0.58 24%
Taking Action – Cost Reductions
10
Workforce reductions
 Headcount 14% in Canada from mid-2014;
8% in FINSA from mid-2013 peak
 Workforce optimization in all regions,
including spans and layers of control
Sustainable SG&A reductions
 Reset all non-mission-critical expenses
Austerity measures
 Union agreements in Canada and
FINSA reflect operating environment
 Frozen salaries and unpaid vacation
in Canada
NAVIGATING DOWNTURN
Decisive actions to reduce cost structure
and maintain profitability during lower
market activity
 2014 - South America
 2015 - Canada
Service Excellence
 Sustained improvement in service profitability
Supply Chain
 Reduced transportation and handling costs
 Improved service levels
Asset Utilization
 Optimizing facilities footprint, reducing
operating expenses
DRIVING COST DISCIPLINE
Executing on Operational Priorities to
position for future growth and improve
ROIC
 Sustainable cost model
 Effective response to market
dynamics
 Culture of accountability
 Parts turns trending 
 Customer loyalty scores trending 
Sustainable cost reductions to maintain profitability during downturn and drive improved ROIC long-term
7.5%
4.9%
8.0%
5.8%
6.5%
0.0%
2.0%
4.0%
6.0%
8.0%
10.0%
FY08 FY09 FY14 Q1/15 Q2/15
Canada EBIT Margin(1)
(1) Excluding severance and facility closure costs
08-09 downturn
300
350
400
450
500
550
600
Q2 2014 Q2 2015
Equipment
Inventory ($M)
200
250
300
350
400
450
Q2 2014 Q2 2015
Parts
Inventory ($M)
Down
18%
Finning Canada
11
Capital Discipline ($ millions)
(1)
Taking Action – Asset Utilization & Capital
Discipline
 Closed 16 facilities
 Leveraging capacity built in recent years
 Optimizing facilities footprint in the oil sands
 Closed 4 facilities
 Facilities right-sizing continues
 Consolidating parts warehouses
 Closed 2 branches
 Reviewing branch network
 Consolidating parts warehouses
(1) Net capital expenditures
Canada Facilities Map
BC AB
NT
Castlegar
YT
Hay River
Fort Nelson
Tumbler Ridge
Squamish
Chilliwack
Kelowna
Revelstoke
Sparwood
Rocky Mountain
House
Edmonton(2)Hinton
Edson
Whitecourt
Drayton Valley
Branch
Depot
The Cat Rental Store
Facility Closures
Finning Locations
-
50
100
150
200
2011 2012 2013 2014 YTD15
Annualized
Strong Free Cash Flow & Balance Sheet
12
47
53
52
50
51 51
48
41
43
41
39
31
36
35
Q1/12
Q2/12
Q3/12
Q4/12
Q1/13
Q2/13
Q3/13
Q4/13
Q1/14
Q2/14
Q3/14
Q4/14
Q1/15
Q2/15
-300
-200
-100
0
100
200
300
400
500
Q1/12
Q2/12
Q3/12
Q4/12
Q1/13
Q2/13
Q3/13
Q4/13
Q1/14
Q2/14
Q3/14
Q4/14
Q1/15
Q2/15
$441($37) $483
Free Cash Flow ($ millions) Net Debt to Invested Capital (%)
Strong annual free cash flow provides great flexibility to return capital to shareholders
Capturing Strategic & Financial Opportunities
13
Category Details
 Completed acquisition of Saskatchewan dealership, effective July 1, 2015
 Contiguous territory that creates growth opportunities and benefits for customers and employees
 ~$240 million purchase price funded with cash
 Immediately accretive to earnings per share and free cash flow positive
 7 to 9 cents accretive to 2016 EPS
 Dividend raised in May 2015 by 3% to $0.73/share (annualized)
 14 years of consecutive dividend increases
 5-year dividend CAGR of 9%
 10-year dividend CAGR of 13%
 Current dividend yield of 3.5%
 Active Normal Course Issuer Bid program initiated in May 2015
 Repurchased close to 1 million of shares in Q2
 Consider share buybacks an effective use of cash when shares trading at significant discount
 Expect to continue repurchasing shares in step with free cash flow delivery
Share
Repurchase
Program
Acquisition
Dividends
Reinvesting and returning capital in a balanced and disciplined fashion
APPENDIX
Acquisition of Saskatchewan Dealership
 Effective July 1, 2015
 Purchase price ~$240 million, subject to post-closing working capital adjustments; funded with cash
 Immediately accretive to EPS; 2016 EPS accretion: $0.07 to $0.09
 Free cash flow positive
 Contiguous Caterpillar dealership in a highly attractive growth territory
 Diversification into new sectors, including potash and uranium
 Significant customer overlap and opportunity to create seamless relationships across Saskatchewan, Alberta and
British Columbia
 Customers benefit from improved equipment and parts availability, world-class product support and access to
Finning’s extensive branch network
 Opportunity to leverage distinct economic, cultural and geological ties, and trade flows across Western Canada
 Talented employees with well-established customer relationships and understanding of the local market
 ~475 employees, including ~160 Caterpillar-trained heavy equipment technicians
 7 dealership branches and 2 rental locations integrated into Finning Canada platform
 Deriving some operational synergies
 Equipment and parts inventory
 Customer relationships
15
Transaction Summary
Compelling Strategic Rationale
Successful Transition
Canada Parts Supply Chain Transformation
16
Progress Update
Network Optimization Update
 16 branches receiving direct shipment from Spokane
 Parts turns improved by 0.7 times from Dec 2012 to June 2015
 Successfully transitioning the Saskatchewan business; integration and growth activities on plan
 Implementing Warehouse Excellence model; pilot at West Edmonton Regional Distribution Centre
65%
70%
75%
80%
85%
90%
2012 2013 2014 2015
YTD
Parts Fill Rate - 24 Hours
20%
25%
30%
35%
40%
45%
50%
55%
2012 2013 2014 2015
YTD
Emergency Purchases
20%
30%
40%
50%
60%
70%
2012 2013 2014 2015
YTD
Parts Customer Loyalty(2)
1.0
1.5
2.0
2.5
3.0
3.5
2012 2013 2014 2015
YTD
Parts Turns (times)(1)
(1) Six months rolling
(2) As measured by Net Promoter Score
Sustained improvement in performance for Parts Supply Chain over last 2 ½ years;
Continue to optimize network and implement Warehouse Excellence model
Construction Opportunities in Western Canada
17
Source: Top 100 Canada’s Biggest Infrastructure Projects; Finning estimates
Infrastructure Opportunities Location Completion Estimated Cost ($B)
British Columbia
LNG - Pacific Northwest/PETRONAS Lelu Island 2019 10.0
Site C Dam - Clean Energy Project Ft. St. John 2020 8.8
George Massey Tunnel Replacement Project Lower Mainland 2022 3.0
Roberts Bank Container Expansion Program Lower Mainland 2020 2.0
Vancouver International Airport Upgrades Lower Mainland 2022 1.8
Evergreen Rapid Transit Lower Mainland 2016 1.4
Alberta
Southwest Calgary Ring Road - 16 km Calgary 2022 5.5
Calgary Transit - Green Line Calgary 2024 5.0
Edmonton Valley Line Edmonton 2020 3.2
Fort McMurray West 500 kV Transmission Project Edmonton-Ft. McMurray 2019 3.2
Anthony Henday Drive North East - 26 km Edmonton 2016 1.8
H.R. Milner Coal Plant Expansion Grand Cache 2018 1.5
Great Spirit Power Project Lake Wabamun 2018 1.5
Saskatchewan
K&S Potash Mine Moose Jaw 2016 4.4
Regina Bypass Project Regina 2018 2.1
Mosaic Stadium Regina 2016 0.7
Sanctioned Regional Pipeline Opportunities Timeline Estimated Cost ($B)
Trans Canada, North Montney Mainline Project (305km) - natural gas Ft. St. John, BC 2015 - 2018 1.5
Enbridge, Norlite (447km) - oil diluent Ft. McMurray, AB 2015 - 2017 1.5
Trans Canada, Liege Lateral Loop (56km) - natural gas Ft. McMurray, AB 2016 n/a
Long-haul: Energy East, Trans Mountain, Northern Gateway, Keystone

More Related Content

What's hot

BioLife Solutions (NASDAQ: BLFS) Investor Presentation September 2021
BioLife Solutions (NASDAQ: BLFS) Investor Presentation September 2021 BioLife Solutions (NASDAQ: BLFS) Investor Presentation September 2021
BioLife Solutions (NASDAQ: BLFS) Investor Presentation September 2021 tberard
 
Cibc whistler conference presentation print final
Cibc whistler conference presentation print finalCibc whistler conference presentation print final
Cibc whistler conference presentation print finalFinningInternational
 
Investor Presentation - Los Angeles, San Francisco
Investor Presentation - Los Angeles, San FranciscoInvestor Presentation - Los Angeles, San Francisco
Investor Presentation - Los Angeles, San FranciscoFinningInternational
 
Toronto, montreal presentation mar 29 31, 2016-final_print
Toronto, montreal presentation mar 29 31, 2016-final_printToronto, montreal presentation mar 29 31, 2016-final_print
Toronto, montreal presentation mar 29 31, 2016-final_printFinningInternational
 
Finning presentation mar 19, 2015 final
Finning presentation mar 19, 2015 finalFinning presentation mar 19, 2015 final
Finning presentation mar 19, 2015 finalFinningInternational
 
Investor Presentation - Toronto, Boston, Montreal
Investor Presentation - Toronto, Boston, MontrealInvestor Presentation - Toronto, Boston, Montreal
Investor Presentation - Toronto, Boston, MontrealFinningInternational
 
Q4 2014 conference call presentation
Q4 2014 conference call presentationQ4 2014 conference call presentation
Q4 2014 conference call presentationAdam Martin
 
2014 cibc whistler conference presentation final
2014 cibc whistler conference presentation final2014 cibc whistler conference presentation final
2014 cibc whistler conference presentation finalFinningInternational
 
Investor Presentation - Toronto - December 2014
Investor Presentation - Toronto - December 2014Investor Presentation - Toronto - December 2014
Investor Presentation - Toronto - December 2014FinningInternational
 
The brink's company investor day
The brink's company investor dayThe brink's company investor day
The brink's company investor dayinvestorsbrinks
 
Goldman sachs 11 14-17 v1
Goldman sachs 11 14-17 v1Goldman sachs 11 14-17 v1
Goldman sachs 11 14-17 v1TextronCorp
 
2015 Delta Investor Day Presentation
2015 Delta Investor Day Presentation2015 Delta Investor Day Presentation
2015 Delta Investor Day PresentationDelta_Airlines
 
Wrk mar 2017 investor presentation final
Wrk mar 2017 investor presentation finalWrk mar 2017 investor presentation final
Wrk mar 2017 investor presentation finalir_westrock
 
Investor presentation february 2015
Investor presentation   february 2015Investor presentation   february 2015
Investor presentation february 2015genworth_financial
 
Q2'16 investor deck v final
Q2'16 investor deck v finalQ2'16 investor deck v final
Q2'16 investor deck v finalixiademandgen
 
Quarterly Slides October 2021
Quarterly Slides October 2021Quarterly Slides October 2021
Quarterly Slides October 2021gstubel
 
Jefferies Consumer Conference
Jefferies Consumer ConferenceJefferies Consumer Conference
Jefferies Consumer ConferenceSysco_Investors
 
Sqi ir pres 0416 final
Sqi ir pres 0416 finalSqi ir pres 0416 final
Sqi ir pres 0416 finalirsciquest
 

What's hot (20)

BioLife Solutions (NASDAQ: BLFS) Investor Presentation September 2021
BioLife Solutions (NASDAQ: BLFS) Investor Presentation September 2021 BioLife Solutions (NASDAQ: BLFS) Investor Presentation September 2021
BioLife Solutions (NASDAQ: BLFS) Investor Presentation September 2021
 
Cibc whistler conference presentation print final
Cibc whistler conference presentation print finalCibc whistler conference presentation print final
Cibc whistler conference presentation print final
 
Investor Presentation - Los Angeles, San Francisco
Investor Presentation - Los Angeles, San FranciscoInvestor Presentation - Los Angeles, San Francisco
Investor Presentation - Los Angeles, San Francisco
 
Toronto, montreal presentation mar 29 31, 2016-final_print
Toronto, montreal presentation mar 29 31, 2016-final_printToronto, montreal presentation mar 29 31, 2016-final_print
Toronto, montreal presentation mar 29 31, 2016-final_print
 
Finning presentation mar 19, 2015 final
Finning presentation mar 19, 2015 finalFinning presentation mar 19, 2015 final
Finning presentation mar 19, 2015 final
 
Investor Presentation - Toronto, Boston, Montreal
Investor Presentation - Toronto, Boston, MontrealInvestor Presentation - Toronto, Boston, Montreal
Investor Presentation - Toronto, Boston, Montreal
 
Q4 2014 conference call presentation
Q4 2014 conference call presentationQ4 2014 conference call presentation
Q4 2014 conference call presentation
 
2014 cibc whistler conference presentation final
2014 cibc whistler conference presentation final2014 cibc whistler conference presentation final
2014 cibc whistler conference presentation final
 
Investor Presentation - Toronto - December 2014
Investor Presentation - Toronto - December 2014Investor Presentation - Toronto - December 2014
Investor Presentation - Toronto - December 2014
 
The brink's company investor day
The brink's company investor dayThe brink's company investor day
The brink's company investor day
 
Nap investor presentation december 2013
Nap investor presentation december 2013Nap investor presentation december 2013
Nap investor presentation december 2013
 
Goldman sachs 11 14-17 v1
Goldman sachs 11 14-17 v1Goldman sachs 11 14-17 v1
Goldman sachs 11 14-17 v1
 
2015 Delta Investor Day Presentation
2015 Delta Investor Day Presentation2015 Delta Investor Day Presentation
2015 Delta Investor Day Presentation
 
Wrk mar 2017 investor presentation final
Wrk mar 2017 investor presentation finalWrk mar 2017 investor presentation final
Wrk mar 2017 investor presentation final
 
Investor presentation february 2015
Investor presentation   february 2015Investor presentation   february 2015
Investor presentation february 2015
 
Q2'16 investor deck v final
Q2'16 investor deck v finalQ2'16 investor deck v final
Q2'16 investor deck v final
 
Quarterly Slides October 2021
Quarterly Slides October 2021Quarterly Slides October 2021
Quarterly Slides October 2021
 
March Investor Presentation
March Investor PresentationMarch Investor Presentation
March Investor Presentation
 
Jefferies Consumer Conference
Jefferies Consumer ConferenceJefferies Consumer Conference
Jefferies Consumer Conference
 
Sqi ir pres 0416 final
Sqi ir pres 0416 finalSqi ir pres 0416 final
Sqi ir pres 0416 final
 

Similar to Finning presentation sept 8 9, 2015-final

Investor presentation toronto, montreal sep 13-15, 2016_final
Investor presentation toronto, montreal sep 13-15, 2016_finalInvestor presentation toronto, montreal sep 13-15, 2016_final
Investor presentation toronto, montreal sep 13-15, 2016_finalFinningInternational
 
Toronto presentation sep 2013 final_v001_d730n6
Toronto presentation sep 2013 final_v001_d730n6Toronto presentation sep 2013 final_v001_d730n6
Toronto presentation sep 2013 final_v001_d730n6FinningInternational
 
Finning presentation oem oct 21, 2015_final
Finning presentation oem oct 21, 2015_finalFinning presentation oem oct 21, 2015_final
Finning presentation oem oct 21, 2015_finalFinningInternational
 
Investor Presentation March 20, 2014
Investor Presentation March 20, 2014Investor Presentation March 20, 2014
Investor Presentation March 20, 2014FinningInternational
 
Cibc breakfast-presentation may-26-2016-final
Cibc breakfast-presentation may-26-2016-finalCibc breakfast-presentation may-26-2016-final
Cibc breakfast-presentation may-26-2016-finalFinningInternational
 
Finning rj conference june 15, 2010 final
Finning rj conference   june 15, 2010 finalFinning rj conference   june 15, 2010 final
Finning rj conference june 15, 2010 finalFinningInternational
 
Finning investor meeting dec 17, 2013 web
Finning investor meeting dec 17, 2013 webFinning investor meeting dec 17, 2013 web
Finning investor meeting dec 17, 2013 webFinningInternational
 
Q2 2020 Earnings Presentation
Q2 2020 Earnings PresentationQ2 2020 Earnings Presentation
Q2 2020 Earnings PresentationQTSDataCenters
 
20150915 investor day presentation v_f_webcast version
20150915 investor day presentation v_f_webcast version20150915 investor day presentation v_f_webcast version
20150915 investor day presentation v_f_webcast versionSysco_Investors
 
Q1 2020 Earnings Presentation
Q1 2020 Earnings PresentationQ1 2020 Earnings Presentation
Q1 2020 Earnings PresentationQTSDataCenters
 
intel Quarter 2008 BusinessUpdate Q 4TH
intel Quarter 2008 BusinessUpdate Q 4THintel Quarter 2008 BusinessUpdate Q 4TH
intel Quarter 2008 BusinessUpdate Q 4THfinance6
 
Q3 2020 Earnings Presentation
Q3 2020 Earnings PresentationQ3 2020 Earnings Presentation
Q3 2020 Earnings PresentationQTSDataCenters
 
Q3 2015 Canadian Tire Corporation Earnings Conference Call Presentation
Q3 2015 Canadian Tire Corporation Earnings Conference Call PresentationQ3 2015 Canadian Tire Corporation Earnings Conference Call Presentation
Q3 2015 Canadian Tire Corporation Earnings Conference Call PresentationInvestorCanadianTire
 
Mdr day1-ir presentation final 051018 230 pm cst
Mdr day1-ir presentation final 051018 230 pm cstMdr day1-ir presentation final 051018 230 pm cst
Mdr day1-ir presentation final 051018 230 pm cstinvestorcbi
 
Q3 2015 Earnings Report- Intel
Q3 2015 Earnings Report- IntelQ3 2015 Earnings Report- Intel
Q3 2015 Earnings Report- IntelCarson Fears
 
Q4 2020 Earnings Presentation
Q4 2020 Earnings PresentationQ4 2020 Earnings Presentation
Q4 2020 Earnings PresentationQTSDataCenters
 
QTS Q4 2020 Earnings Presentation
QTS Q4 2020 Earnings PresentationQTS Q4 2020 Earnings Presentation
QTS Q4 2020 Earnings PresentationKelly Michael
 
Q4 2019 Earnings Presentation
Q4 2019 Earnings PresentationQ4 2019 Earnings Presentation
Q4 2019 Earnings PresentationQTSDataCenters
 

Similar to Finning presentation sept 8 9, 2015-final (20)

Investor presentation toronto, montreal sep 13-15, 2016_final
Investor presentation toronto, montreal sep 13-15, 2016_finalInvestor presentation toronto, montreal sep 13-15, 2016_final
Investor presentation toronto, montreal sep 13-15, 2016_final
 
Toronto presentation sep 2013 final_v001_d730n6
Toronto presentation sep 2013 final_v001_d730n6Toronto presentation sep 2013 final_v001_d730n6
Toronto presentation sep 2013 final_v001_d730n6
 
Finning presentation oem oct 21, 2015_final
Finning presentation oem oct 21, 2015_finalFinning presentation oem oct 21, 2015_final
Finning presentation oem oct 21, 2015_final
 
Investor Presentation March 20, 2014
Investor Presentation March 20, 2014Investor Presentation March 20, 2014
Investor Presentation March 20, 2014
 
Cibc breakfast-presentation may-26-2016-final
Cibc breakfast-presentation may-26-2016-finalCibc breakfast-presentation may-26-2016-final
Cibc breakfast-presentation may-26-2016-final
 
Finning rj conference june 15, 2010 final
Finning rj conference   june 15, 2010 finalFinning rj conference   june 15, 2010 final
Finning rj conference june 15, 2010 final
 
Finning investor meeting dec 17, 2013 web
Finning investor meeting dec 17, 2013 webFinning investor meeting dec 17, 2013 web
Finning investor meeting dec 17, 2013 web
 
Q2 2020 Earnings Presentation
Q2 2020 Earnings PresentationQ2 2020 Earnings Presentation
Q2 2020 Earnings Presentation
 
20150915 investor day presentation v_f_webcast version
20150915 investor day presentation v_f_webcast version20150915 investor day presentation v_f_webcast version
20150915 investor day presentation v_f_webcast version
 
Q1 2020 Earnings Presentation
Q1 2020 Earnings PresentationQ1 2020 Earnings Presentation
Q1 2020 Earnings Presentation
 
intel Quarter 2008 BusinessUpdate Q 4TH
intel Quarter 2008 BusinessUpdate Q 4THintel Quarter 2008 BusinessUpdate Q 4TH
intel Quarter 2008 BusinessUpdate Q 4TH
 
Q3 2020 Earnings Presentation
Q3 2020 Earnings PresentationQ3 2020 Earnings Presentation
Q3 2020 Earnings Presentation
 
Q3 2015 Canadian Tire Corporation Earnings Conference Call Presentation
Q3 2015 Canadian Tire Corporation Earnings Conference Call PresentationQ3 2015 Canadian Tire Corporation Earnings Conference Call Presentation
Q3 2015 Canadian Tire Corporation Earnings Conference Call Presentation
 
Mdr day1-ir presentation final 051018 230 pm cst
Mdr day1-ir presentation final 051018 230 pm cstMdr day1-ir presentation final 051018 230 pm cst
Mdr day1-ir presentation final 051018 230 pm cst
 
Aimia's Q1 2015 Financial Highlights Presentation
Aimia's Q1 2015 Financial Highlights PresentationAimia's Q1 2015 Financial Highlights Presentation
Aimia's Q1 2015 Financial Highlights Presentation
 
Q3 2015 Earnings Report- Intel
Q3 2015 Earnings Report- IntelQ3 2015 Earnings Report- Intel
Q3 2015 Earnings Report- Intel
 
Q4 2020 Earnings Presentation
Q4 2020 Earnings PresentationQ4 2020 Earnings Presentation
Q4 2020 Earnings Presentation
 
QTS Q4 2020 Earnings Presentation
QTS Q4 2020 Earnings PresentationQTS Q4 2020 Earnings Presentation
QTS Q4 2020 Earnings Presentation
 
Q4 2015 conf call slides
Q4 2015 conf call slides  Q4 2015 conf call slides
Q4 2015 conf call slides
 
Q4 2019 Earnings Presentation
Q4 2019 Earnings PresentationQ4 2019 Earnings Presentation
Q4 2019 Earnings Presentation
 

More from FinningInternational

Finning toronto & montreal presentation sep 12 to 14, 2012_website
Finning toronto & montreal presentation sep 12 to 14, 2012_websiteFinning toronto & montreal presentation sep 12 to 14, 2012_website
Finning toronto & montreal presentation sep 12 to 14, 2012_websiteFinningInternational
 
Finning ny & boston presentation sep 5 & 6, 2012_website v2
Finning ny & boston presentation sep 5 & 6, 2012_website v2Finning ny & boston presentation sep 5 & 6, 2012_website v2
Finning ny & boston presentation sep 5 & 6, 2012_website v2FinningInternational
 
Raymond James - Infrastructure & Construction Conference
Raymond James - Infrastructure & Construction Conference Raymond James - Infrastructure & Construction Conference
Raymond James - Infrastructure & Construction Conference FinningInternational
 
Finning australia investor presentation final
Finning australia investor presentation finalFinning australia investor presentation final
Finning australia investor presentation finalFinningInternational
 
Finning cibc whistler conference final
Finning cibc whistler conference finalFinning cibc whistler conference final
Finning cibc whistler conference finalFinningInternational
 

More from FinningInternational (9)

Cibc whistler conference v5 final
Cibc whistler conference v5 finalCibc whistler conference v5 final
Cibc whistler conference v5 final
 
Investor Day 2012
Investor Day 2012Investor Day 2012
Investor Day 2012
 
Oem tour oct 24, 2012 final_new
Oem tour oct 24, 2012 final_newOem tour oct 24, 2012 final_new
Oem tour oct 24, 2012 final_new
 
Finning toronto & montreal presentation sep 12 to 14, 2012_website
Finning toronto & montreal presentation sep 12 to 14, 2012_websiteFinning toronto & montreal presentation sep 12 to 14, 2012_website
Finning toronto & montreal presentation sep 12 to 14, 2012_website
 
Finning ny & boston presentation sep 5 & 6, 2012_website v2
Finning ny & boston presentation sep 5 & 6, 2012_website v2Finning ny & boston presentation sep 5 & 6, 2012_website v2
Finning ny & boston presentation sep 5 & 6, 2012_website v2
 
Raymond James - Infrastructure & Construction Conference
Raymond James - Infrastructure & Construction Conference Raymond James - Infrastructure & Construction Conference
Raymond James - Infrastructure & Construction Conference
 
Latest Presentation
Latest PresentationLatest Presentation
Latest Presentation
 
Finning australia investor presentation final
Finning australia investor presentation finalFinning australia investor presentation final
Finning australia investor presentation final
 
Finning cibc whistler conference final
Finning cibc whistler conference finalFinning cibc whistler conference final
Finning cibc whistler conference final
 

Recently uploaded

Investor Day 2024 Presentation Sysco 2024
Investor Day 2024 Presentation Sysco 2024Investor Day 2024 Presentation Sysco 2024
Investor Day 2024 Presentation Sysco 2024Sysco_Investors
 
Teck Investor Presentation - May 23, 2024
Teck Investor Presentation - May 23, 2024Teck Investor Presentation - May 23, 2024
Teck Investor Presentation - May 23, 2024TeckResourcesLtd
 
一比一原版CBU毕业证卡普顿大学毕业证成绩单如何办理
一比一原版CBU毕业证卡普顿大学毕业证成绩单如何办理一比一原版CBU毕业证卡普顿大学毕业证成绩单如何办理
一比一原版CBU毕业证卡普顿大学毕业证成绩单如何办理btohy
 
Collective Mining | Corporate Presentation - May 2024
Collective Mining | Corporate Presentation - May 2024Collective Mining | Corporate Presentation - May 2024
Collective Mining | Corporate Presentation - May 2024CollectiveMining1
 
cyberagent_For New Investors_EN_240424.pdf
cyberagent_For New Investors_EN_240424.pdfcyberagent_For New Investors_EN_240424.pdf
cyberagent_For New Investors_EN_240424.pdfCyberAgent, Inc.
 
一比一原版MQU毕业证麦考瑞大学毕业证成绩单如何办理
一比一原版MQU毕业证麦考瑞大学毕业证成绩单如何办理一比一原版MQU毕业证麦考瑞大学毕业证成绩单如何办理
一比一原版MQU毕业证麦考瑞大学毕业证成绩单如何办理aytyn
 
Collective Mining | Corporate Presentation - May 2024
Collective Mining | Corporate Presentation - May 2024Collective Mining | Corporate Presentation - May 2024
Collective Mining | Corporate Presentation - May 2024CollectiveMining1
 

Recently uploaded (7)

Investor Day 2024 Presentation Sysco 2024
Investor Day 2024 Presentation Sysco 2024Investor Day 2024 Presentation Sysco 2024
Investor Day 2024 Presentation Sysco 2024
 
Teck Investor Presentation - May 23, 2024
Teck Investor Presentation - May 23, 2024Teck Investor Presentation - May 23, 2024
Teck Investor Presentation - May 23, 2024
 
一比一原版CBU毕业证卡普顿大学毕业证成绩单如何办理
一比一原版CBU毕业证卡普顿大学毕业证成绩单如何办理一比一原版CBU毕业证卡普顿大学毕业证成绩单如何办理
一比一原版CBU毕业证卡普顿大学毕业证成绩单如何办理
 
Collective Mining | Corporate Presentation - May 2024
Collective Mining | Corporate Presentation - May 2024Collective Mining | Corporate Presentation - May 2024
Collective Mining | Corporate Presentation - May 2024
 
cyberagent_For New Investors_EN_240424.pdf
cyberagent_For New Investors_EN_240424.pdfcyberagent_For New Investors_EN_240424.pdf
cyberagent_For New Investors_EN_240424.pdf
 
一比一原版MQU毕业证麦考瑞大学毕业证成绩单如何办理
一比一原版MQU毕业证麦考瑞大学毕业证成绩单如何办理一比一原版MQU毕业证麦考瑞大学毕业证成绩单如何办理
一比一原版MQU毕业证麦考瑞大学毕业证成绩单如何办理
 
Collective Mining | Corporate Presentation - May 2024
Collective Mining | Corporate Presentation - May 2024Collective Mining | Corporate Presentation - May 2024
Collective Mining | Corporate Presentation - May 2024
 

Finning presentation sept 8 9, 2015-final

  • 1. INVESTOR PRESENTATION Scott Thomson, President & CEO Steve Nielsen, EVP & CFO Mauk Breukels, VP Investor Relations & Corporate Affairs New York, Toronto September 8-9, 2015
  • 2. Forward Looking Information 2 Monetary amounts are in Canadian dollars and from continuing operations unless noted otherwise This report contains statements about the Company’s business outlook, objectives, plans, strategic priorities and other statements that are not historical facts. A statement Finning makes is forward-looking when it uses what the Company knows and expects today to make a statement about the future. Forward-looking statements may include words such as aim, anticipate, assumption, believe, could, expect, goal, guidance, intend, may, objective, outlook, plan, project, seek, should, strategy, strive, target, and will. Forward-looking statements in this report include, but are not limited to, statements with respect to: expectations with respect to the economy and associated impact on the Company’s financial results; expected revenue; expected free cash flow; EBIT margin; ROIC; market share growth; expected results from service excellence action plans; anticipated asset utilization; inventory turns and parts service levels; the expected target range of the Company’s net debt to invested capital ratio; and the expected financial impact from the acquisition of the operating assets of the Caterpillar dealer in Saskatchewan. All such forward-looking statements are made pursuant to the ‘safe harbour’ provisions of applicable Canadian securities laws. Unless otherwise indicated by us, forward-looking statements in this report reflect Finning’s expectations at September 8, 2015. Except as may be required by Canadian securities laws, Finning does not undertake any obligation to update or revise any forward-looking statement, whether as a result of new information, future events, or otherwise. Forward-looking statements, by their very nature, are subject to numerous risks and uncertainties and are based on several assumptions which give rise to the possibility that actual results could differ materially from the expectations expressed in or implied by such forward-looking statements and that Finning’s business outlook, objectives, plans, strategic priorities and other statements that are not historical facts may not be achieved. As a result, Finning cannot guarantee that any forward-looking statement will materialize. Factors that could cause actual results or events to differ materially from those expressed in or implied by these forward- looking statements include: general economic and market conditions; foreign exchange rates; commodity prices; the level of customer confidence and spending, and the demand for, and prices of, Finning’s products and services; Finning’s dependence on the continued market acceptance of Caterpillar’s products and Caterpillar’s timely supply of parts and equipment; Finning’s ability to continue to improve productivity and operational efficiencies while continuing to maintain customer service; Finning’s ability to manage cost pressures as growth in revenue occurs; Finning’s ability to reduce costs in response to slowing activity levels; Finning’s ability to attract sufficient skilled labour resources to meet growing product support demand; Finning’s ability to negotiate and renew collective bargaining agreements with satisfactory terms for Finning’s employees and the Company; the intensity of competitive activity; Finning’s ability to raise the capital needed to implement its business plan; regulatory initiatives or proceedings, litigation and changes in laws or regulations; stock market volatility; changes in political and economic environments for operations; the integrity, reliability, availability and benefits from information technology and the data processed by that technology. Forward-looking statements are provided in this report for the purpose of giving information about management’s current expectations and plans and allowing investors and others to get a better understanding of Finning’s operating environment. However, readers are cautioned that it may not be appropriate to use such forward-looking statements for any other purpose. Forward-looking statements made in this report are based on a number of assumptions that Finning believed were reasonable on the day the Company made the forward-looking statements. Refer in particular to the Outlook section of this MD&A. Some of the assumptions, risks, and other factors which could cause results to differ materially from those expressed in the forward-looking statements contained in this report are discussed in Section 4 of the Company’s current AIF. Finning cautions readers that the risks described in the AIF are not the only ones that could impact the Company. Additional risks and uncertainties not currently known to the Company or that are currently deemed to be immaterial may also have a material adverse effect on Finning’s business, financial condition, or results of operations. Except as otherwise indicated, forward-looking statements do not reflect the potential impact of any non-recurring or other unusual items or of any dispositions, mergers, acquisitions, other business combinations or other transactions that may be announced or that may occur after the date hereof. The financial impact of these transactions and non-recurring and other unusual items can be complex and depends on the facts particular to each of them. Finning therefore cannot describe the expected impact in a meaningful way or in the same way Finning presents known risks affecting its business.
  • 3. Finning International Overview  World’s largest Caterpillar dealer  We sell, rent and provide parts and service for Caterpillar equipment and engines  Serving customers for over 80 years and delivering value to public shareholders for over 45 years  Operating in 7 countries: Western Canada, Chile, Argentina, Bolivia, Uruguay, UK and Ireland  Main industries: mining (oil sands, copper, coal), construction, forestry and power systems (prime power, petroleum, marine)  ~14,000 employees worldwide 3 Santiago Antofagasta Bolivia Argentina Chile Uruguay Cannock United Kingdom Ireland (1) At Sep 4, 2015 (2) Last twelve months ended June 30, 2015 Vancouver Edmonton Fort McMurray British Columbia Yukon Alberta The Northwest Territories Regina Saskatchewan 2014 Financial Statistics Revenue 6.9B EBITDA 720M EBIT 504M Basic EPS 1.85 FCF 483M Invested Capital 3.1B ROIC 15.3% Market Statistics(1) Ticker FTT (TSX) Share Price 21.10 % 52-Week High 62% Market Cap 3.6B Enterprise Value 4.9B S&P/DBRS Rating BBB+/A(low) Dividend Yield 3.5% Dividend 5yr CAGR 9.1% FCF Yield(2) 9.1%
  • 4. Credit Rating (S&P) (2)  AAA  AA–  CCC+  AAA Macro Challenges  Oil & gas  Copper  Political  Coal Opportunities  Site C  LNG / power systems  Highway infrastructure  Forestry  Core construction  Infrastructure agenda  Underground mining  Fall election  Vaca Muerta shale  Construction  Highway / rail infrastructure  Quarry sector  General construction  Power projects & renewables Economic Growth by Region 4 GDP Growth Forecast (1) (1) Source: Bloomberg - Aug 31, 2015 (2) Represents local currency rating for Argentina 3.6% 1.9% 0.4% 3.0% 0.8% 2.3% 0.4% 2.6% 2.3% 3.1% 1.7% 2.4% 3.2% 3.8% 1.1% 2.6% Western Canada Chile Argentina U.K. 2014A 2015E 2016E 2015E (1 Year Ago)
  • 5. Business Environment 5 South AmericaCanada Mining (oil sands, copper, coal)  Customers under pressure to minimize capital and operating expenditures  Postponing non-production activities (e.g. overburden removal), insourcing some service work, postponing maintenance, parking equipment, de-stocking inventories Construction  Lower customer activity in Alberta  Site C Dam in BC expected to generate product support  Strong forestry activity Mining (copper)  New projects are being delayed  Customers are focused on reducing operating costs while maintaining production levels  Postponing component repurchases and major repairs Construction  Encouraged by modest increase in order intake in Q2  Have not seen evidence of government infrastructure spend in 2015 “At oil sands, we reduced our cash cost per barrel by almost 18% in the past year… As we implement business process improvements, both internally and in partnership with our contractors and suppliers, we believe we can continue to realize further savings and our intent would be to embed these reductions and sustain them going forward.” Suncor - Q2/15 Investor Call, Jul 30, 2015 “The challenge that you have when you talk about the future is underlying economics. We do need an internal rate of return of 15% after-tax to continue on with any new projects. And then when you start talking out past 2017/2018, those become a little nebulous, and in today's cost environment, it is very difficult to achieve a 15% rate of return on a long- term project at $60 pricing. If we can continue to reduce costs and those cost savings are sustainable, then we will be able to move forward. But right now we're going to need a lot of help in terms of technological innovation for new projects post-2020.” Canadian Natural Resources, Jun 1, 2015 Chile's Codelco is facing a sharp drop in copper grades at its aging mine operations in 2016 while the price of the red metal will likely remain stuck around $2.50/lb. “It does not look like it will be a year to be smiling. Next year is going to be very tough." Codelco’s CEO Nelson Pizarro, Platts, Aug 28, 2015 “The copper markets are still attractive, though, for long-term growth projects. Until 2018, new copper projects under development will keep supply and demand broadly balanced. But, thereafter, grade decline will trigger new brownfield capacity and, longer term, new greenfield projects.” BHP Billiton – FY15 Investor Call, Aug 25, 2015 “Combining these two neighbouring assets (Goldcorp’s El Morro and Teck’s Relincho copper projects in Chile) is a common sense approach that allows us to consolidate infrastructure to reduce costs, reduce the environmental footprint and provide greater returns over either standalone project.” Teck, Aug 27, 2015
  • 6. Finning Update Challenging macro environment; great territories and strong long-term business model  Weak and volatile commodity prices create challenging current business environment  High-quality territories with great long-term opportunities  Diverse customer base  Product support business provides revenue resilience during downturn Decisive actions to navigate through downturn and improve business in the long-term  Cost reductions to maintain profitability on lower revenue base  Operational priorities aligned with Caterpillar’s Across the Table initiative to provide outstanding customer experience, position for future growth, and improve ROIC  Capital discipline, including prudent capital expenditures and asset utilization focus Actions taken + business model = significant free cash flow  Generated over $1 billion in free cash flow over last 11 quarters  Expect strong free cash flow in 2015  Continued focus on inventory reduction and capital discipline  Healthy balance sheet and cash position Capturing strategic and financial opportunities  Cash acquisition of Saskatchewan dealership; immediately accretive to earnings and free cash flow positive  Raised dividend in May 2015  Active share repurchase program 1 2 3 4 6
  • 7. Product Support 49% New Equipment 42% Used 4% Rental 5% Construction 33% Power Systems 21% Petroleum 5% Forestry 3% Other* 9% Mining 29% 7 * Agriculture, industrial, government High-quality territories with long-term opportunities Diverse customer base Highly Diversified Business Anchored by Product Support UK & Ireland 15% South Ameria 32% Canada 53% 2014 revenue 2014 new equipment sales 2014 revenue Product support provides revenue resilience Large Installed Base Product Support New Equipment Sales Product Support 10-Year CAGR ~11% (2004-2014) 0 500 1,000 1,500 2,000 New Equip YTD14 New Equip YTD15 Product Support YTD14 Product Support YTD15 Down 20% Flat $M YTD Revenue New Equipment vs. Product Support
  • 8. Operational Priorities 8 Strong Alignment with Caterpillar Service Excellence  Drives lowest equipment owning and operating costs  Maximizes equipment uptime and improves customer loyalty  Improves service profitability  Attracts and retains technical talent Supply Chain  Competitive advantage as a world-class distributor  Improves service levels and drives customer loyalty  Reduces transportation and handling costs  Reduces invested capital and improves cash generation Alignment with Caterpillar Operational Priorities Across the Table  Agreement with Caterpillar on mutual goals  Partnering to raise performance with focus on:  Improving customer experience  Driving supply chain efficiencies  Enhancing market leadership  Reinforcing competitive advantage Asset Utilization  Optimizes footprint and distribution of activities  Maximizes return on investments made  Improves service delivery  Reduces costs and invested capital Market Leadership  Builds machine population and drives future product support  Expands focus to entire product line Safety & Talent Management  Safe, engaged, inspired team Joint Initiatives in 2015  Caterpillar Auction Services and IronPlanet  Finning to host 1st Canadian Cat Auction Services live unreserved public auction on October 21 in Edmonton  Yard Club  Peer-to-peer equipment rental pilot Significant running room to drive further operational improvements
  • 9. Taking Action – Safe, Engaged, Inspired Team 9 Category Actions Statistics  Global best practices  Aligned on Life Saving Rules  Pre-task hazard assessment for all jobs  Highest personal protective equipment standards  Mix of role adjustments and new talent  Significant realignment in Canada  Full executive team now in place  Strong executive leadership visibility  Focus on communication and employee recognition  Strategic clarity and focus  Full alignment with Operational Priorities  Emphasis on improving ROIC  Change at executive and management level Employee Engagement Focus on Safety Right People in the Right Roles Aligned Incentives Short Term  Safety  EBIT margin  Free cash flow  Customer loyalty  Invested capital turnover Long Term  Return on invested capital  Total shareholder return (1) Total Recordable Injury Frequency (3) In the last two years(2) Regional presidents included in Finning International headcount # Exec(2) New to Role (3) New to FTT(3) Finning Int’l 8 5 3 Canada 8 6 2 FINSA 6 2 2 UK 4 1 1 TRIF(1) 2013 2014 % Change Finning Int’l 0.99 0.75 25% Canada 1.69 1.16 31% FINSA 0.52 0.46 12% UK 0.76 0.58 24%
  • 10. Taking Action – Cost Reductions 10 Workforce reductions  Headcount 14% in Canada from mid-2014; 8% in FINSA from mid-2013 peak  Workforce optimization in all regions, including spans and layers of control Sustainable SG&A reductions  Reset all non-mission-critical expenses Austerity measures  Union agreements in Canada and FINSA reflect operating environment  Frozen salaries and unpaid vacation in Canada NAVIGATING DOWNTURN Decisive actions to reduce cost structure and maintain profitability during lower market activity  2014 - South America  2015 - Canada Service Excellence  Sustained improvement in service profitability Supply Chain  Reduced transportation and handling costs  Improved service levels Asset Utilization  Optimizing facilities footprint, reducing operating expenses DRIVING COST DISCIPLINE Executing on Operational Priorities to position for future growth and improve ROIC  Sustainable cost model  Effective response to market dynamics  Culture of accountability  Parts turns trending   Customer loyalty scores trending  Sustainable cost reductions to maintain profitability during downturn and drive improved ROIC long-term 7.5% 4.9% 8.0% 5.8% 6.5% 0.0% 2.0% 4.0% 6.0% 8.0% 10.0% FY08 FY09 FY14 Q1/15 Q2/15 Canada EBIT Margin(1) (1) Excluding severance and facility closure costs 08-09 downturn 300 350 400 450 500 550 600 Q2 2014 Q2 2015 Equipment Inventory ($M) 200 250 300 350 400 450 Q2 2014 Q2 2015 Parts Inventory ($M) Down 18% Finning Canada
  • 11. 11 Capital Discipline ($ millions) (1) Taking Action – Asset Utilization & Capital Discipline  Closed 16 facilities  Leveraging capacity built in recent years  Optimizing facilities footprint in the oil sands  Closed 4 facilities  Facilities right-sizing continues  Consolidating parts warehouses  Closed 2 branches  Reviewing branch network  Consolidating parts warehouses (1) Net capital expenditures Canada Facilities Map BC AB NT Castlegar YT Hay River Fort Nelson Tumbler Ridge Squamish Chilliwack Kelowna Revelstoke Sparwood Rocky Mountain House Edmonton(2)Hinton Edson Whitecourt Drayton Valley Branch Depot The Cat Rental Store Facility Closures Finning Locations - 50 100 150 200 2011 2012 2013 2014 YTD15 Annualized
  • 12. Strong Free Cash Flow & Balance Sheet 12 47 53 52 50 51 51 48 41 43 41 39 31 36 35 Q1/12 Q2/12 Q3/12 Q4/12 Q1/13 Q2/13 Q3/13 Q4/13 Q1/14 Q2/14 Q3/14 Q4/14 Q1/15 Q2/15 -300 -200 -100 0 100 200 300 400 500 Q1/12 Q2/12 Q3/12 Q4/12 Q1/13 Q2/13 Q3/13 Q4/13 Q1/14 Q2/14 Q3/14 Q4/14 Q1/15 Q2/15 $441($37) $483 Free Cash Flow ($ millions) Net Debt to Invested Capital (%) Strong annual free cash flow provides great flexibility to return capital to shareholders
  • 13. Capturing Strategic & Financial Opportunities 13 Category Details  Completed acquisition of Saskatchewan dealership, effective July 1, 2015  Contiguous territory that creates growth opportunities and benefits for customers and employees  ~$240 million purchase price funded with cash  Immediately accretive to earnings per share and free cash flow positive  7 to 9 cents accretive to 2016 EPS  Dividend raised in May 2015 by 3% to $0.73/share (annualized)  14 years of consecutive dividend increases  5-year dividend CAGR of 9%  10-year dividend CAGR of 13%  Current dividend yield of 3.5%  Active Normal Course Issuer Bid program initiated in May 2015  Repurchased close to 1 million of shares in Q2  Consider share buybacks an effective use of cash when shares trading at significant discount  Expect to continue repurchasing shares in step with free cash flow delivery Share Repurchase Program Acquisition Dividends Reinvesting and returning capital in a balanced and disciplined fashion
  • 15. Acquisition of Saskatchewan Dealership  Effective July 1, 2015  Purchase price ~$240 million, subject to post-closing working capital adjustments; funded with cash  Immediately accretive to EPS; 2016 EPS accretion: $0.07 to $0.09  Free cash flow positive  Contiguous Caterpillar dealership in a highly attractive growth territory  Diversification into new sectors, including potash and uranium  Significant customer overlap and opportunity to create seamless relationships across Saskatchewan, Alberta and British Columbia  Customers benefit from improved equipment and parts availability, world-class product support and access to Finning’s extensive branch network  Opportunity to leverage distinct economic, cultural and geological ties, and trade flows across Western Canada  Talented employees with well-established customer relationships and understanding of the local market  ~475 employees, including ~160 Caterpillar-trained heavy equipment technicians  7 dealership branches and 2 rental locations integrated into Finning Canada platform  Deriving some operational synergies  Equipment and parts inventory  Customer relationships 15 Transaction Summary Compelling Strategic Rationale Successful Transition
  • 16. Canada Parts Supply Chain Transformation 16 Progress Update Network Optimization Update  16 branches receiving direct shipment from Spokane  Parts turns improved by 0.7 times from Dec 2012 to June 2015  Successfully transitioning the Saskatchewan business; integration and growth activities on plan  Implementing Warehouse Excellence model; pilot at West Edmonton Regional Distribution Centre 65% 70% 75% 80% 85% 90% 2012 2013 2014 2015 YTD Parts Fill Rate - 24 Hours 20% 25% 30% 35% 40% 45% 50% 55% 2012 2013 2014 2015 YTD Emergency Purchases 20% 30% 40% 50% 60% 70% 2012 2013 2014 2015 YTD Parts Customer Loyalty(2) 1.0 1.5 2.0 2.5 3.0 3.5 2012 2013 2014 2015 YTD Parts Turns (times)(1) (1) Six months rolling (2) As measured by Net Promoter Score Sustained improvement in performance for Parts Supply Chain over last 2 ½ years; Continue to optimize network and implement Warehouse Excellence model
  • 17. Construction Opportunities in Western Canada 17 Source: Top 100 Canada’s Biggest Infrastructure Projects; Finning estimates Infrastructure Opportunities Location Completion Estimated Cost ($B) British Columbia LNG - Pacific Northwest/PETRONAS Lelu Island 2019 10.0 Site C Dam - Clean Energy Project Ft. St. John 2020 8.8 George Massey Tunnel Replacement Project Lower Mainland 2022 3.0 Roberts Bank Container Expansion Program Lower Mainland 2020 2.0 Vancouver International Airport Upgrades Lower Mainland 2022 1.8 Evergreen Rapid Transit Lower Mainland 2016 1.4 Alberta Southwest Calgary Ring Road - 16 km Calgary 2022 5.5 Calgary Transit - Green Line Calgary 2024 5.0 Edmonton Valley Line Edmonton 2020 3.2 Fort McMurray West 500 kV Transmission Project Edmonton-Ft. McMurray 2019 3.2 Anthony Henday Drive North East - 26 km Edmonton 2016 1.8 H.R. Milner Coal Plant Expansion Grand Cache 2018 1.5 Great Spirit Power Project Lake Wabamun 2018 1.5 Saskatchewan K&S Potash Mine Moose Jaw 2016 4.4 Regina Bypass Project Regina 2018 2.1 Mosaic Stadium Regina 2016 0.7 Sanctioned Regional Pipeline Opportunities Timeline Estimated Cost ($B) Trans Canada, North Montney Mainline Project (305km) - natural gas Ft. St. John, BC 2015 - 2018 1.5 Enbridge, Norlite (447km) - oil diluent Ft. McMurray, AB 2015 - 2017 1.5 Trans Canada, Liege Lateral Loop (56km) - natural gas Ft. McMurray, AB 2016 n/a Long-haul: Energy East, Trans Mountain, Northern Gateway, Keystone