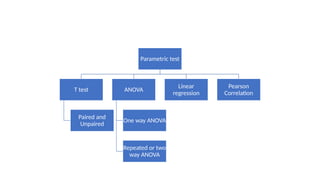
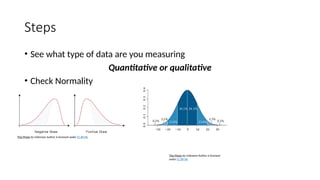
CHOOSING A STATISTICAL
TEST
DR SYED ATA UL MUNAMM
This Photo by Unknown Author is licensed under CC BY-NC-ND
This Photo by Unknown Author is licensed under
CC BY-SA-NC
Statistical tests are tools
They measure significance of your results
• P value <0.05(5%)
• 95% Confidence interval
• 2.5(1.5-5.5)
• An in many more ways
Classification of statistical test
• Paramteric tests
• Non parameteric tests
Parametric test
T test
Paired and
Unpaired
ANOVA
One way ANOVA
Repeated or two
way ANOVA
Linear
regression
Pearson
Correlation
Non
parametric
test
Wilconson
sign rank test
Chi square
Fischer exact
test
Logistic
regression
Non
parameteric
regression
Steps
• See what type of data are you measuring
Quantitative or qualitative
• Check Normality
This Photo by Unknown Author is licensed
under CC BY-SA
This Photo by Unknown Author is licensed under CC BY-NC
Continue..
• Type of analysis
Comparison/Difference
Association/ Relationship
Prediction
• Design
One group one data set
One group two data set or more(Paired)
Two group two data set or more(Unpaired)
More than two groups & data sets
Paired study Design
Type of
data&Distribution
Comparison Association/
Relationship
Prediction
2 data set >2 data set
Paired unpaired Paired unpaired
Continuous with
Normal
Distribution
(Mean)
Paired
t-test
Unpaired t
test
Two way
ANOVA
One way
ANOVA
Pearson
correlation
Linear
Regression
Ordinal
Non- Normal
Distribution
(Median)
Wilcoxon
signed
Rank
Wilcoxon
signed
Rank
Mann
whitening
‘U’ test
Friedman
test
Kruskal Wallis Spearman
correlation
Non Parametric
regression
Nominal
Dichotomous data
McNemar
test
Chi Square Cochran
Q test
Chi square Contingency
Coefficient
Logistic
regression
Choosing a Statistical test

choosing a stat test for data analysis.pptx

  • 1.
  • 2.
    This Photo byUnknown Author is licensed under CC BY-NC-ND
  • 3.
    This Photo byUnknown Author is licensed under CC BY-NC-ND This Photo by Unknown Author is licensed under CC BY-SA-NC
  • 4.
    Statistical tests aretools They measure significance of your results
  • 5.
    • P value<0.05(5%) • 95% Confidence interval • 2.5(1.5-5.5) • An in many more ways
  • 6.
    Classification of statisticaltest • Paramteric tests • Non parameteric tests
  • 7.
    Parametric test T test Pairedand Unpaired ANOVA One way ANOVA Repeated or two way ANOVA Linear regression Pearson Correlation
  • 8.
    Non parametric test Wilconson sign rank test Chisquare Fischer exact test Logistic regression Non parameteric regression
  • 9.
    Steps • See whattype of data are you measuring Quantitative or qualitative • Check Normality This Photo by Unknown Author is licensed under CC BY-SA This Photo by Unknown Author is licensed under CC BY-NC
  • 10.
    Continue.. • Type ofanalysis Comparison/Difference Association/ Relationship Prediction • Design One group one data set One group two data set or more(Paired) Two group two data set or more(Unpaired) More than two groups & data sets
  • 12.
  • 14.
    Type of data&Distribution Comparison Association/ Relationship Prediction 2data set >2 data set Paired unpaired Paired unpaired Continuous with Normal Distribution (Mean) Paired t-test Unpaired t test Two way ANOVA One way ANOVA Pearson correlation Linear Regression Ordinal Non- Normal Distribution (Median) Wilcoxon signed Rank Wilcoxon signed Rank Mann whitening ‘U’ test Friedman test Kruskal Wallis Spearman correlation Non Parametric regression Nominal Dichotomous data McNemar test Chi Square Cochran Q test Chi square Contingency Coefficient Logistic regression
  • 15.