Downloaded 362 times
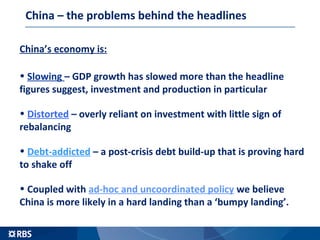
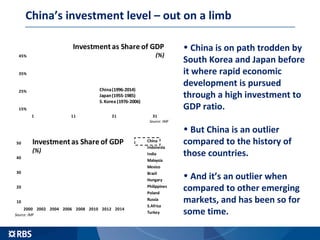


China's economy is experiencing a significant slowdown, with GDP growth less than the reported figures and heavily reliant on investment, coupled with a deepening debt crisis. Structural problems include excess capacity in heavy industries and a lack of meaningful economic rebalancing, leading to new challenges for policy makers. As a result, the likelihood of a hard landing rather than a 'bumpy landing' has increased, raising concerns for both the Chinese and global economies.


![1. [10] Draw a UML class diagram for the following class def.docx](https://cdn.slidesharecdn.com/ss_thumbnails/1-230107110903-141b2a7c-thumbnail.jpg?width=640&height=640&fit=bounds)


