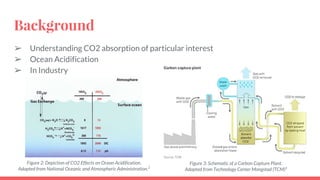
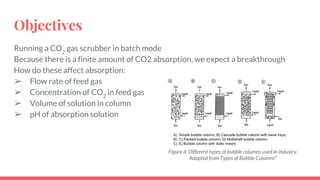
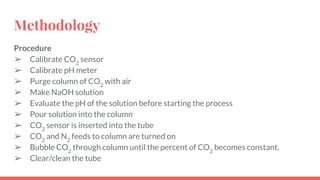
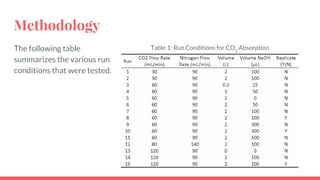
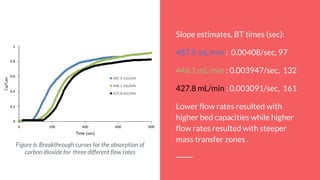
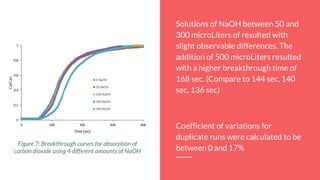
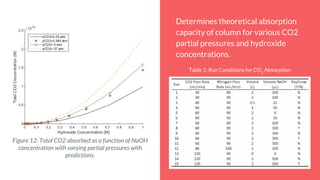
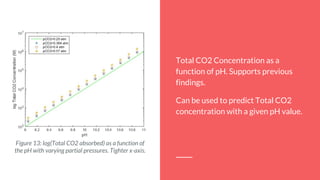
The document summarizes an experiment studying factors that affect CO2 absorption in a NaOH solution. The experiment tested how absorption is affected by flow rate of CO2 gas, CO2 concentration, volume of NaOH solution, and pH. Absorption increased with lower flow rates, higher NaOH volumes, and higher pH. The results supported theories that more CO2 absorbs at higher pressures and NaOH concentrations. Future studies could optimize flow rates to maximize both absorption capacity and breakthrough time.

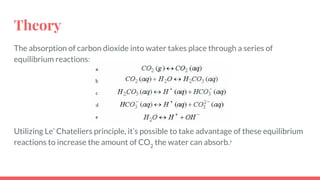
![Theory: Modelling
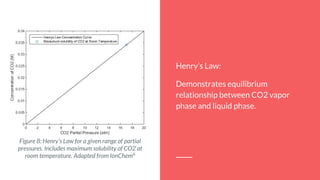
Henry’s Law describes the interaction between the pressure of a gas and its
dissociation into a liquid. In this case:
➢ Henry’s Law Constant for CO2: KCO2
=2x10⁻³
@ 25o
C.
By using the equilibrium equations that define this process, it’s possible to find the
total CO2 concentration as a function of pH.
➢ At 25 °C, 1 atm: [CO2 (aq)]=1.2x10^-5, as given by Ion Chem6
:](https://image.slidesharecdn.com/f40f6800-6702-45cf-9691-49e1e5350244-151202003836-lva1-app6892/85/CHE451-CO2-Absorption-Oral-Report-8-320.jpg)
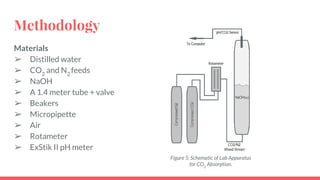

![Conclusions and Recommendations
With an increase in the pH of the aqueous solution, we observe an increase in the
total amount of CO2
absorbance.
With a decrease in flow rate, we increased the breakthrough time, which increases
the absorbance capacity of the column. But increasing the flow rate, decreases the
amount of unused bed space.
Recommended that future studies which focus on a optimizing flow rate, where bed
capacity and breakthrough time are both maximized. (Geankoplis)5
Hunb
=(1-[tb
/ts
])HT
CO2
+2NaOH→ Na2
CO3](https://image.slidesharecdn.com/f40f6800-6702-45cf-9691-49e1e5350244-151202003836-lva1-app6892/85/CHE451-CO2-Absorption-Oral-Report-21-320.jpg)