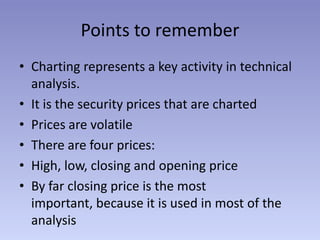
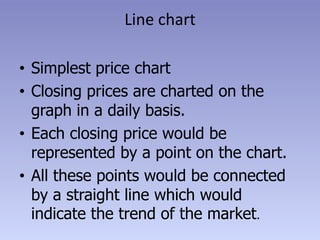
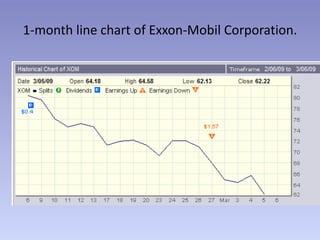
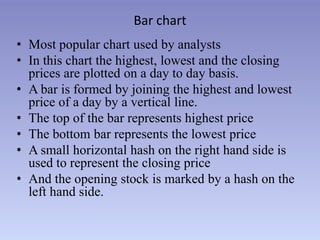
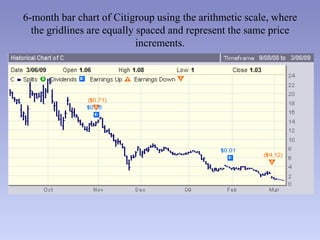
Charts in Technical Analysis

           Aju Joy
Points to remember
• Charting represents a key activity in technical
  analysis.
• It is the security prices that are charted
• Prices are volatile
• There are four prices:
• High, low, closing and opening price
• By far closing price is the most
  important, because it is used in most of the
  analysis
Types of charts
• Line chart
• Bar chart
• Japanese candlestick chart
Line chart

• Simplest price chart
• Closing prices are charted on the
  graph in a daily basis.
• Each closing price would be
  represented by a point on the chart.
• All these points would be connected
  by a straight line which would
  indicate the trend of the market.
1-month line chart of Exxon-Mobil Corporation.
Bar chart
• Most popular chart used by analysts
• In this chart the highest, lowest and the closing
  prices are plotted on a day to day basis.
• A bar is formed by joining the highest and lowest
  price of a day by a vertical line.
• The top of the bar represents highest price
• The bottom bar represents the lowest price
• A small horizontal hash on the right hand side is
  used to represent the closing price
• And the opening stock is marked by a hash on the
  left hand side.
6-month bar chart of Citigroup using the arithmetic scale, where
  the gridlines are equally spaced and represent the same price
                            increments.
Charts in technical analysis

Charts in technical analysis

  • 1.
    Charts in TechnicalAnalysis Aju Joy
  • 2.
    Points to remember •Charting represents a key activity in technical analysis. • It is the security prices that are charted • Prices are volatile • There are four prices: • High, low, closing and opening price • By far closing price is the most important, because it is used in most of the analysis
  • 3.
    Types of charts •Line chart • Bar chart • Japanese candlestick chart
  • 4.
    Line chart • Simplestprice chart • Closing prices are charted on the graph in a daily basis. • Each closing price would be represented by a point on the chart. • All these points would be connected by a straight line which would indicate the trend of the market.
  • 5.
    1-month line chartof Exxon-Mobil Corporation.
  • 6.
    Bar chart • Mostpopular chart used by analysts • In this chart the highest, lowest and the closing prices are plotted on a day to day basis. • A bar is formed by joining the highest and lowest price of a day by a vertical line. • The top of the bar represents highest price • The bottom bar represents the lowest price • A small horizontal hash on the right hand side is used to represent the closing price • And the opening stock is marked by a hash on the left hand side.
  • 7.
    6-month bar chartof Citigroup using the arithmetic scale, where the gridlines are equally spaced and represent the same price increments.