Unit-IV; Professional Sales Representative (PSR).pptx
Chapter 4
1. 1
CHAPTER 4
DATA ANALYSIS AND INTERPRETATION
KARNATAKA STATE ROAD TRANSPORTATION ANALYSIS
Table No 4.01
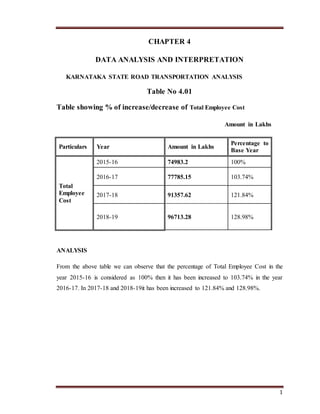
Table showing % of increase/decrease of Total Employee Cost
Amount in Lakhs
Particulars Year Amount in Lakhs
Percentage to
Base Year
Total
Employee
Cost
2015-16 74983.2 100%
2016-17 77785.15 103.74%
2017-18 91357.62 121.84%
2018-19 96713.28 128.98%
ANALYSIS
From the above table we can observe that the percentage of Total Employee Cost in the
year 2015-16 is considered as 100% then it has been increased to 103.74% in the year
2016-17. In 2017-18 and 2018-19it has been increased to 121.84% and 128.98%.
2. 2
Chart No. 4.01
Chart showing amount of increase/decrease of Total Employee Cost
Interpretation:
we can observe that there is a increased in Total Employee Cost when compared
to the base year as well as transportation service is increasing as it is the total cost of the
KSRTC will gets increase in year by year.
0
20000
40000
60000
80000
100000
120000
2015-16 2016-17 2017-18 2018-19
Total Employee Cost
Amount in Lakhs
3. 3
Table No 4.02
Table showing % of increase/decrease of Repairs And Maintenance
Amount in Lakhs
Particulars Year Amount in Lakhs
Percentage to
Base Year
REPAIRS AND
MAINTENANCE:
2015-16 41687.77 100%
2016-17 40736.25 97.72%
2017-18 40185.48 96.40%
2018-19 39761.77 95.38%
ANALYSIS
From the above table we can observe that the percentage of Repairs And Maintenance in
the year 2015-16 is considered as 100% then it has been decreased to 97.72% in the year
2016-17. In 2017-18 and 2018-19it has been decreased to 96.40% and 95.38%.
4. 4
Chart No. 4.02
Chart showing amount of increase/decrease of Repairs And Maintenance
Interpretation:
We can observe that there is a decreased in Repairs And Maintenance when
compared to the base year. Repairs And Maintenance decreased gradually its good sign to
the company. KRSTC has taken good measures to control the Repairs And Maintenance
cost.
38500
39000
39500
40000
40500
41000
41500
42000
2015-16 2016-17 2017-18 2018-19
REPAIRS AND MAINTENANCE:
Amount in Lakhs
5. 5
Table No 4.03
Table showing % of increase/decrease of Total Other Cost
Amount in Lakhs
Particulars Year Amount in Lakhs
Percentage to
Base Year
Total Other
Cost
2015-16 929 100%
2016-17 845 90.93%
2017-18 842 90.59%
2018-19 948 102.04%
ANALYSIS
From the above table we can observe that the percentage of Total Other Cost in the year
2015-16 is considered as 100% then it has been decreased to 90.93% in the year 2016-17.
In 2017-18 it has been decreased to 90.59% and in 2018-19 it has been increased to
102.04%.
6. 6
Chart No. 4.03
Chart showing amount of increase/decrease of Total Other Cost
Interpretation:
we can observe that there is a fluctuation in Total Other Cost when compared to
the base year 2015-16 in the 2016-17 otter that Total Other Cost decreased gradually its
good sign to the company but in the year 2018-19 it has slightly increased compared to
base year and also previous year. Sometimes these other costs will gets varies.
780
800
820
840
860
880
900
920
940
960
2015-16 2016-17 2017-18 2018-19
Total Other Cost
Amount in Lakhs
7. 7
Table No 4.04
Table showing % of increase/decrease of Fuel Oil And Lubricants Cost
Amount in Lakhs
Particulars Year Amount in Lakhs
Percentage to
Base Year
FUEL OIL
AND
LUBRICANTS
COST
2015-16 127099.95 100%
2016-17 102021.55 80.27%
2017-18 117994.86 92.84%
2018-19 127041.61 99.95%
ANALYSIS
From the above table we can observe that the percentage of Fuel Oil And Lubricants Cost
in the year 2015-16 is considered as 100% then it has been decreased to 80.27% in the
year 2016-17. In 2017-18 and 2018-19it has been decreased to 92.84% and 99.95%.
8. 8
Chart No. 4.04
Chart showing amount of increase/decrease of Fuel Oil And Lubricants Cost
Interpretation:
we can observe that there is a decrease in Fuel Oil And Lubricants Cost when
compared to the base year 2015-16 in the 2016-17 that Fuel Oil And Lubricants Cost
decreased gradually its good sign to the company. In 201-17 and in 2018-19 slightly
increased compare to previous year but not to base year .
0
20000
40000
60000
80000
100000
120000
140000
2015-16 2016-17 2017-18 2018-19
FUEL OIL AND LUBRICANTS COST
Amount in Lakhs
9. 9
Table No4.05
Table showing % of increase/decrease of Taxes On Passenger Vehicles
Amount in Lakhs
Particulars Year Amount in Lakhs
Percentage to
Base Year
TAXES ON
PASSENGER
VEHICLES
2015-16 15791.6 100%
2016-17 15416.88 97.63%
2017-18 15290.19 96.82%
2018-19 16682.68 105.64%
ANALYSIS
From the above table we can observe that the percentage Taxes On Passenger
Vehicles in the base year 2015-16 is 100%. Then it has been decreased to 97.63% in the
year 2016-17 and again in the year 2017-18 it was 96.82% bit in 2018-19 it has been
increased to 105.64% respectively.
10. 10
Chart No. 4.05
Chart showing amount of increase/decrease of Taxes On Passenger Vehicles
Interpretation:
we can say that there is a gradual decrease and greater increase in Taxes On
Passenger Vehicles when compare to the base year 2015-16 because in the government
tax policies there is an fluctuation in Taxes On Passenger Vehicles and the 2018-19 due
to hike in fuel prices and by government changes the tax has increased in a graeater
extent.
14500
15000
15500
16000
16500
17000
2015-16 2016-17 2017-18 2018-19
TAXES ON PASSENGER VEHICLES
Amount in Lakhs
11. 11
Table No. 4.06
Table showing % of increase/decrease of Welfare Cost
Amount in Lakhs
Particulars Year Amount in Lakhs
Percentage to
Base Year
WELFARE
cost
2015-16 21132.66 100%
2016-17 31216.44 147.72%
2017-18 29240.18 138.36%
2018-19 25559.09 120.95%
ANALYSIS;
from the above table shows that Welfare Cost for 4 years from 2015-16 to 2018-19.
There is a continuous increase in the Welfare Cost as the company is having good control
over its but in the year 2018-19 slightly increased. it is not a good sign to the company.
12. 12
Chart No. 4.06
Chart showing amount of increase/decrease of Welfare Cost
Interpretation:
From the above Graph shows that manufacturing overhead for 4 years from 2015-
16 to 2018-19. There is a continuous increase in the Welfare Cost as the company.
Company need to use more machine power than the man power as the result the process
will be faster and there is a decrease in the training cost to the workers.
0
5000
10000
15000
20000
25000
30000
35000
2015-16 2016-17 2017-18 2018-19
WELFARE cost
Amount in Lakhs
13. 13
Table No. 4.07
Table showing % of increase/decrease of Administration Cost
Amount in Lakhs
Particulars Year Amount in Lakhs
Percentage
to Base Year
ADMINISTRATIVE
cost
2015-16 281624.66 100%
2016-17 268021.41 95.17%
2017-18 294910.32 104.72%
2018-19 306706.89 108.91%
ANALYSIS; From the above table we can observe that the percentage of Administration
cost n the year 2015-16is considered as 100% then it has been decreased to 95.17% and
104.72% in the year 2016-17 and 2017-18 respectively and 2018-19 it has been increased
to 108.91%.
14. 14
Chart No. 4.07
Chart showing amount of increase/decrease of Administration Cost
Interpretation:
From the above chart we can say that there are more fluctuations in Administration Cost
when compared to the base year 2015-16 but in the year 2018-19 it increased its cost it is
not good sign so the KSRTC should try control the administrative cost in future
240000
250000
260000
270000
280000
290000
300000
310000
2015-16 2016-17 2017-18 2018-19
ADMINISTRATIVE cost
Amount in Lakhs
15. 15
Table No. 4.08
Table showing % of increase/decrease of Depreciation On Vehicles
Amount in Lakhs
Particulars Year Amount in Lakhs
Percentage
to Base Year
DEPRECIATION
ON VEHICLES
2015-16 22933.5 100%
2016-17 20198.98 88.08%
2017-18 15565.33 67.87%
2018-19 16045.81 69.97%
ANALYSIS
From the above table we can observe that the percentage of Depreciation On Vehicles in
the year 2015-16is 100%, than it has been decrease to 20198.98i.e., 88.08% in the year
2016-17 and in the year 2017-18 the Depreciation On Vehicles amount decreased to
67.87% then in the year 2018-19 the Depreciation On Vehicles decreased to 16045.81
i.e., 69.97% respectively.
16. 16
Chart No. 4.08
Chart showing amount of increase/decrease of DepreciationOnVehicles
Interpretation:
From the above chart we can observe that the percentage of Depreciation On Vehicles
amount in the year 2015-16 is 100%, So, we can say that there continuous decrease when
compared to the base year 2015-16 but last year well slightly increased compare to base
year. From last few years KSRTC is engaging in hiring vehicles so the depreciation on
vehicles gets decrease.
0
5000
10000
15000
20000
25000
2015-16 2016-17 2017-18 2018-19
DEPRECIATION ON VEHICLES
Amount in Lakhs
17. 17
Table No. 4.09
Table showing % of increase/decrease of Financial Costs
Amount in Lakhs
Particulars Year Amount in Lakhs
Percentage to
Base Year
Financial
Costs
2015-16 3768.38 100%
2016-17 3232.68 85.78%
2017-18 1668.69 44.28%
2018-19 1752.29 46.50%
ANALYSIS
Form the above table we can observe that the % of Financial Costs in the year
2015-16 is 100% then it has been decreased to 85.78 % in the year 2016-17. In the year
2017-18it has been decreased to 44.28% but again it decreased to 46.50% in the year
2018-19.
18. 18
Chart No.4.09
Showing amount of increase/decrease of Financial Costs
Interpretation:
There is a gradual decrease in Financial Costs when compare to the base year 2015-16.
Total Cost decreasing is good sign to the company it helps to increase the company
profit.
0
500
1000
1500
2000
2500
3000
3500
4000
2015-16 2016-17 2017-18 2018-19
Financial Costs
Amount in Lakhs
19. 19
Table No. 4.10
Table showing % of increase/decrease of Total Non-operating cost
Amount in Lakhs
Particulars Year Amount in Lakhs
Percentage to
Base Year
Total
Non-
operating
cost
2015-16 10021.77 100%
2016-17 10019.96 99.98%
2017-18 9534.19 95.13%
2018-19 8846.56 88.27%
ANALYSIS
From the above Table, we can see that the percentage to Non-operating cost in the
year 2015-16 is 100%. In the year 2016-17 it has been decreased to 99.98% and in the
year 2017-18 and 2018-19 it has been decreased to 95.13% and 88.27% respectively
compare to base year 2015-16.
20. 20
Chart No. 4.10
Chart showing amount of increase/decrease of TotalNon-operating cost
Interpretation:
From the above chart we can say that decreasing Non-operating cost is good but
company should not reduce this cost by reducing output. Company must increase the
good transport service and reduce the other cost through optimum utilization of
recourses.
8200
8400
8600
8800
9000
9200
9400
9600
9800
10000
10200
2015-16 2016-17 2017-18 2018-19
Total Non-operating cost
Amount in Lakhs
21. 21
Table No. 4.11
Table showing % of increase/decrease of Rent, Rate and Taxes
Amount in Lakhs
Particulars Year Amount in Lakhs
Percentage to
Base Year
Rent,
Rate and
Taxes
2015-16 587.06 100%
2016-17 572.9 97.59%
2017-18 680.26 115.88%
2018-19 662.76 112.89%
ANALYSIS
The above table revels that information about the Rent, Rate and Taxes calculated on the
KSRTC from the last preceding 4 years. During the year 2015-16 the Rent, Rate and
Taxes was 100%. The table shows decline in the Rent, Rate and Taxes in the year 2016-
17 that is 97.59%, respectively. But from 2017-18 and in 2018-19 it has increased to
115.88% and 112.89% . So, we see that there is fluctuation trend of Rent, Rate and
Taxes it is not good sign for company, maintain good trend for better prosperity.
22. 22
Chart No. 4.11
Chart showing amount of increase/decrease of Rent, Rate and Taxes
Interpretation:
The above chart revels that information about the Rent, Rate and Taxes calculated on the
KSRTC. It was fluctuation from the last preceding 4 years. It is not good sign but due to
govt. variance in tax policies hiring vehicle rents may varies from year to year. This
policy will affect on the profit.
500
520
540
560
580
600
620
640
660
680
700
2014-15 2015-16 2016-17 2017-18
Rent, Rate and Taxes
Amount in Lakhs
23. 23
Table No. 4.12
Table showing % of increase/decrease of and allowances of Drivers &
Conductors
Amount in Lakhs
Particulars Year Amount in Lakhs
Percentage to
Base Year
Salaries
and
allowances
of Drivers
&
Conductors
2015-16 59900.11 100%
2016-17 62147.17 103.75%
2017-18 72070.07 120.32%
2018-19 77458.48 129.31%
ANALYSIS
The above table helps us to determine the impact of allowances of Drivers &
Conductors of the company. In 2015-16 the company incurred 62147, allowances of
Drivers & Conductors but in the year 2016-17 it has been increased to 72070 i.e.
120.32% and in the year 2018-19 it has increased to 129.31% respectively.
24. 24
Chart No. 4.12
Chart showing amount of increase/decrease of and allowances of
Drivers & Conductors
Interpretation:
From the above chart we can observe allowances of Drivers & Conductors that from the
year 2015-16 to 2018-19 these allowances are getting increase because every year
KSRTC should increase the allowance for Drivers & Conductors gradually and KSRCT
cant reduce these allowances.
0
10000
20000
30000
40000
50000
60000
70000
80000
90000
2015-16 2016-17 2017-18 2018-19
Salaries and allowances of Drivers & Conductors
Amount in Lakhs
25. 25
Table No. 4.13
Table showing % of increase/decrease of Printing & Stationery
Amount in Lakhs
Particulars Year Amount in Lakhs
Percentage to
Base Year
Printing
&
Stationery
2015-16 139.38 100%
2016-17 186.29 133.66%
2017-18 147.28 105.67%
2018-19 175.96 126.24%
ANALYSIS
From the above chart we can observe that the percentage of Printing & Stationery in the
year 2015-16 is considered as 100% then it has been increased to 133.66% in the year
2016-17. In 2017-18 and 2018-19it has been increased to 105.67% and 126.24%.
26. 26
Chart No. 4.13
Chart showing amount of increase/decrease of Printing & Stationery
Interpretation:
From the above chart we can observe that there is an increase in Printing & Stationery
when compared to the base year 2015-16 in the 2017-18 decreased slightly because state
election purpose there was an code of conduct. KSRTC should try to reduce these costs if
it possible and it helps to increase the profits also
0
20
40
60
80
100
120
140
160
180
200
2015-16 2016-17 2017-18 2018-19
Printing & Stationery
Amount in Lakhs
27. 27
Table No. 4.14
Table showing % of increase/decrease of Total cost
Amount in Lakhs
Particulars Year Amount in Lakhs
Percentage to
Base Year
Total cost
2015-16 324817.95 100%
2016-17 317878.99 97.86%
2017-18 335058.78 103.15%
2018-19 348828.85 107.39%
ANALYSIS
From the above table We can see that the Total cost 97.86% in the year 2016-17
compared to the base year 2015-16 i.e. 100% and2017-18suddenly Total cost increased to
97.86% because the input cost is very high and revenue is less and in the year 2018-19 it
has been increasing again i.e.107.39% respectively.
28. 28
Chart No. 4.14
Chart showing amount of increase/decrease of Total cost
Interpretation:
We can see that there is a quantum jump in Total cost in the year 2016-17
compared to the base year 2015-16 i.e. 100% and 2017-18 and in 2018-19 suddenly Total
cost increased due to the total employee cost of the KSRTC is increasing gradually but
rest of employee cost other costs are decreasing gradually.
300000
305000
310000
315000
320000
325000
330000
335000
340000
345000
350000
355000
2015-16 2016-17 2017-18 2018-19
Total cost
Amount in Lakhs
30. 30
TABLE – 4.2
Table showing on variable cost of KSRTC chikkaballapur division during the year
2014-15 to 2018-19
YEAR AMOUNT PERCENTAGE
INCREASE/
DECREASE OF %
2014-15 11336.75 100 -
2015-16 11579.75
102.14
2.14
2016-17 11797.01 104.05 4.05
2017-18 9878.05 87.13 -12.87
2018-19 11040.20 97.38 -2.62
ANALYSIS:
From the above table it can be analysed the KSRTC’s Variable cost is in increasing trend.
The absolute figure was 11336.75 in the Year 2014-15, and it was increased to 11579.75
and 11797.01 in the years 2016-17, 2017-18 and 2018-19 respectively. In the last year it
was slightly decreased and settled down at 9878.05 and 11040.20.
31. 31
GRAPH: 4.2
The graph showing Variable Cost on KSRTC chikkaballapur during the year
2014-15 to 2018-19
INTERPRETATION:
The above chart shows that the variable cost of KSRTC was increasing from the
year 2014-15 to 2016-17, and in the last previous year it is decreased comparatively to
the preceding the previous years. From the above chart we can interpret that the variable
cost in the previous year is very less when compared to the other remaining years.
Because of fuel, depreciation on vehicles, motor van tax, consumables and spares, cost
are incurred more expensive year by year in that reason variable cost increased has been.
11336.75
11579.75
11797.01
9878.05
11040.2
100%
102.14%
104.05
104.05%
87.13%
0 2000 4000 6000 8000 10000 12000 14000
2014-15
2015-16
2016-17
2017-18
2018-19
VARIABAL COST OF KSRTC
32. 32
TABLE – 4.3
Table showing on fixed cost of KSRTC during the year 2014-15 to 2018-19
Year Amount PERCENTAGE INCREASE/
DECREASE OF
%
2014-15 7130.24 100 -
2015-16 7210.37 101.12 1.12
2016-17 8831.24 123.85 23.85
2017-18 9661.85 135.50 35.50
2018-19 9798.24 137.41 37.41
ANALYSIS:
From the above table it can be analyzed the KSRTC’s Fixed cost is in increasing trend.
The absolute figure was 7130.24 in the Year 2014-15, and it was increased to 7210.24,
7210.37 and 8831.24 in the years 2015-16, 2016-17 and 2017-18 respectively. In the last
year it was settled down at 9798.24
33. 33
GRAPH: 4.3
The graph showing fixed Cost on KSRTC chikkaballapur during the year 2014-
15 to 2018-19
INTERPRETATION
The above chart showing the fixed cost reveals that, there is an enormous increase in the
fixed cost from the 2014-15 to 2018-19 in the KSRTC department. With the
consideration, 2014-15 as a base year, the rate of increase in the fixed cost is determined
in the above chart. From the above graph, we can interpret that, the value of fixed cost is
more when compared to the variable cost, in the KSRTC, chikkaballapur, because of
employee cost, miscellaneous, central expenses are incurred more cost ,
0
1000
2000
3000
4000
5000
6000
7000
8000
9000
10000
2014-15 2015-16 2016-17 2017-18 2018-19
7130.24 7210.37
8831.24
9661.85 9798.24
100% 101.12% 123.85% 135.5% 137.41%
FIXED COST
34. 34
TABLE – 4.4
Table showing on total cost of KSRTC during the year 2014-15 to 2018-19
Year Amount PERCENTAGE INCREASE/
DECREASE OF %
2014-15 18466.99 100 -
2015-16 18790.18 101.75 1.75
2016-17 20628.25 111.70 11.70
2017-18 19539.90 105.80 5.80
2018-19 20838.44 112.84 12.84
ANALYSIS:
From the above table it can be analysed the KSRTC’s total Cost is in increasing trend.
The absolute figure was 18466.99 in the Year 2014-15, and it was increased to
18790.18,20628.25 and19539.90 in the years 2015-16, 2016-17 and 2017-18
respectively. In the last year it was slightly decreased and settled down at 20838.44.
35. 35
GRAPH: 4.4
The graph showing total Cost on KSRTC chikkaballapur during the year 2014-
15 to 2018-19
INTERPRETAION
In the above chart we can see the total cost incurred in the KSRTC chikkaballapur. In the
year 2014-15 to 2018-19 total cost has been increased year to year frequently. Of the
1.75%, 11.7%, 5.8%, 12.84% in the last five years. Because of the frequently the year by
year increasing the variable cost and fixed cost has incurred high volume of cost.
18466.99 18790.18 20628.25 19539.9 20838.44
100%
101.75%
111.7%
105.8%
112.84%
17000
17500
18000
18500
19000
19500
20000
20500
21000
21500
2014-15 2015-16 2016-17 2017-18 2018-19
TOTAL COST
36. 36
TABLE- 4.5
The table showing of Total Revenues & Cost of KSRTC of during the year 2014-15
to 2018-19
year Total revenue Total cost
2014-15 16254.56 18466.99
2015-16 18638.27 18790.13
2016-17 20626.68 20628.25
2017-18 20614.60 19539.90
2018-19 21626.68 20838.44
ANALYSIS:
From the above table it can be analyzed the KSRTC’s Revenues & Cost is in increasing
trend. The absolute figure was 16254.56 in the Year 2014-15, and it was increased to
18638.27 and 20326.68, 20614.60 in the years 2015-16, 2016-17 and 2017-18
respectively. In the last year it was slightly decreased and settled down at 21626.68.
37. 37
GRAPH: 4.5
The graph showing revenue and total Cost on KSRTC chikkaballapur during
the year 2014-15 to 2018-19
INTERPRETATION
In the above chart we can see the difference between the total cost and total revenue, , in
the year 2014-15 there is a difference of Rs.2212 where the cost is more and revenue is
less. In the financial year 2014-15 & 2015-16 there is a little difference between the cost
and revenue. But in the last previous year, there is a difference of Rs.1075, where the
cost is less and revenue is more. Over all in the year 2014-15 there is higher cost than
revenue, and in the year 2017-18, 2018-19 there is more revenue than costs. It was found
that the total incurred by KSRTC in relation to total revenues was comparatively more
hence the corporation should focus on increasing its revenue and also in decreasing the
cost.
16254.56
18638.27 20626.68 20614.6
21626.68
18466.99 18790.13 20628.25
19539.9
20838.440
5000
10000
15000
20000
25000
2014-15 2015-16 2016-17 2017-18 2018-19
revenue and total cost
38. 38
TABLE – 4.6
Table showing on Total revenue earned of KSRTC during the year 2014-15 to 2018-
19
year 2014-15 2015-16 2016-17 2017-18 2018-19
amount -2212.43 -151.66 -1.57 1074.70 788.24
ANALYSIS:
This table shows the details of total revenue earned of KSRTC during the
year 2014-15 to 2018-19, the absolute revenue was in 2014-15,2015-16,2016-17 earned
negative values likely -2212.43,-151.66,-1.57. and it was 2017-18 and 2018-19 earned
revenue of 1074.74,788.24.
39. 39
GRAPH: 4.6
The graph showing revenue of KSRTC chikkaballapur during the year 2014-15
to 2018-19
INTREPRETATION
In the above chart we can see the revenue earnings of KSRTC chikkaballapur, in the year
2014-15 to 2018-19. In the year 2014-15 has incurred huge loos incurred in the division
of 2212.43.inthe year 2014-15 has incurred 151.66 of loss comparatively less than 2014-
15.inthe year 2016-17 incurred loss of 1.57 it is the Mainer loss of division.in the year
2017-18,2018-19 has been earned 1074.7, 788.24 , in this last two years are profitable
years. It was found that the total incurred by KSRTC in relation to total revenues was
comparatively more hence the corporation should focus on increasing its revenue and
also in decreasing the cost.
-2212.43
-151.66
-1.57
1074.7
788.24
-2500
-2000
-1500
-1000
-500
0
500
1000
1500
2014-15 2015-16 2016-17 2017-18 2018-19
REVENUE
40. 40
Table: 4.7
The Table shows comparative analysis of revenue of KSRTC
Chikkaballapur 2014-15 to 2018-19
Year Amount Absolute amount Increase/decrease
of %
2014-15 16254.56 - -
2015-16 18638.27 2383.71 14.66
2016-17 20626.68 1988.41 10.66%
2017-18 20614.60 -12.08 -0.05%
2018-19 21626.68 1012.08 4.90%
ANALYSIS:
The above table shows the details of revenue of KSRTC chikkaballapur division
during the year 2014-15 to2018-19; the absolute revenue was 16254.56 at base
year then increased to the 23883.71, 1988.41, and 1012.08 in 2014-15, 2015-16,
2018-19. In the year 2017-18 of competitively decreased revenue of rupees-12.08
41. 41
GRAPH: 4.7
The graph showing revenue of KSRTC chikkaballapur during the
year 2014-15 to 2018-19
INTERPRETAION:
Here I have tried to interpret the percentage of the revenue. In the above graph we can see
that the revenue has increased 2014-15 to 2015-16 of 14.66%. In the year 2016-17
increase the revenue of 10.66% comparatively 2015-16.in the year 2017-18 has decreased
revenue -0.05%. During year of 2018-19 has been increased and settled down 21626.68,
Because of the transparency of operations and collections of day to day and proper
maintenance of accounts.
-5000
0
5000
10000
15000
20000
25000
2015-16 2016-17 2017-18 2018-19
18638.27
20626.68 20614.6
21626.68
14.66% 10.66% -0.05% 4.90%
revenue
Amount 16254.56 Increase/decrease of % -
42. 42
Table: 4.8
The Table shows comparative analysis of variable cost of KSRTC
Chikkaballapur 2014-15 to 2018-19
year amount Absolute amount Increase /decrease of %
2014-15 11336.75 - -
2015-16 11579.75 243 2.14%
2016-17 11797.01 217.26 1.87%
2017-18 9878.05 -1918.96 -16.26%
2018-19 11040.20 1162.15 11.76%
ANALYSIS:
The above table shows the details of variable cost of KSRTC chikkaballapur division
during the year 2014-15to 2018-19, the absolute variable cost was 11336.75 in the Year
2014-15, and it was increased to 11579.75 and 11797.01 in the years 2016-17, 2017-18
and 2018-19 respectively. In the last year it was slightly decreased and settled down at
9878.05 and 11040.20.
43. 43
GRAPH: 4.8
The graph showing variable cost of KSRTC chikkaballapur during
the year 2014-15 to 2018-19
INTERPRETAION:
Here I have tried to interpret the percentage of the variable cost. In the above graph we
can see that the variable cost has increased year by year likely 2031-14, 2016-17, 2018-
19 increased 2.14%, 1.87% and 11.76% respectively. But the year 2017-18 has been
decreased -16.26% comparatively base years. Reason of increasing of depreciation on
vehicles, motor van tax, Tyres and tubes expenditure.
11579.75 11797.01
9878.05
11040.2
2.14% 1.87%
-16.26%
11.76%
-2000
0
2000
4000
6000
8000
10000
12000
14000
2014-15 2015-16 2016-17 2017-18
variable cost
amount 11336.75 Increase /decrease of % -
44. 44
Table: 4.9
The Table shows comparative analysis of fixed cost of KSRTC
Chikkaballapur 2014-15 to 2018-19
year amount Absolute amount Increase /decrease
of %
2014-15 7130.24 - -
2015-16 7210.37 80.13 1.12%
2016-17 8831.24 1620.87 22.47%
2017-18 9661.85 830.61 9.40%
2018-19 9798.24 136.39 1.41%
ANALYSIS:
From the above table it can be analyzed the KSRTC’s Fixed cost is in increasing trend.
The absolute figure was 7130.24 in the Year 2014-15, and it was increased to 7210.24,
7210.37 and 8831.24 in the years 2015-16, 2016-17 and 2017-18 respectively. In the last
year it was settled down at 97982.24
45. 45
GRAPH: 4.9
The graph showing fixed cost of KSRTC chikkaballapur during the
year 2014-15 to 2018-19
INTERPRETAION:
Here I have tried to interpret the percentage of the fixed cost. In the above graph we can
see that the fixed cost has been increased comparatively year by year likely percentage of
1.12%, 22.47% and 9.40%, 1.41% because of the employee cost, miscellaneous, central
expenses are incurred more expenditure.
7210.37
8831.24
9661.85 9798.24
1.12% 22.47% 9.40% 1.41%
0
2000
4000
6000
8000
10000
12000
2015-16 2016-17 2017-18 2018-19
fixed cost
amount 7130.24 Increase /decrease of % -
46. 46
Table: 4.10
The Table shows comparative analysis of net profit or loss of KSRTC
Chikkaballapur 2014-15 to 2018-19
year amount Absolute amount Increase /decrease of %
2014-15 -2212.43 - -
2015-16 -151.66 2060.77 -93.14%
2016-17 -1.57 150.09 -98.96%
2017-18 1074.70 1076.27 68552.22%
2018-19 788.24 -286.46 -26.61%
ANALYSIS:
This table shows the details of total revenue earned of KSRTC during the year 2014-15 to
2018-19, the absolute revenue was in 2014-15,2015-16,2016-17 earned negative values
likely -2212.43,-151.66,-1.57. And it was 2017-18 and 2018-19 earned revenue of
1074.74, 788.24.
47. 47
GRAPH: 4.10
The graph showing net profit or loss of KSRTC chikkaballapur
during the year 2014-15 to 2018-19
INTREPRETATION:
In the above chart we can see the net profit or loss of KSRTC chikkaballapur, in the year
2014-15 to 2018-19. In the year 2014-15 has incurred huge loss incurred in the division
of 2212.43.inthe year 2014-15 has incurred 151.66 of loss comparatively less than 2014-
15.inthe year 2016-17 incurred loss of 1.57 it is the Mainer loss of division.in the year
2017-18,2018-19 has been earned 1074.7, 788.24 , in this last two years are profitable
years. It was found that the total incurred by KSRTC in relation to total revenues was
comparatively more hence the corporation should focus on increasing its revenue and
also in decreasing the cost.
-151.66
-1.57
1074.7
788.24
2060.77
150.09
1076.27
-286.46
-500
0
500
1000
1500
2000
2500
2015-16 2016-17 2017-18 2018-19
net profit or loss
amount -2212.43 Absolute amount -
48. 48
Table: 4.11
The Table shows comparative analysis of cost sheet of KSRTC
Chikkaballapur 2014-15 and 2015-16
particular Absolute change amount Increase /decrease
percentage
Revenue 2383.71 14.67
Variable cost 243 2.14
Fixed cost 80.13 1.12
Net profit loss -2060.77 -93.15
ANALYSIS:
This table shows the details of comparative analysis of cost sheet of KSRTC
chikkaballapur during the year 2014-15 and 2015-16. The absolute revenue has
comparatively increased 2014-15 to 2015-16 of 2383.71. In this year variable cost, fixed
cost also increased likely 243, 80.13.but the net profit are decreased -2060.77 has been.
49. 49
GRAPH: 4.11
The graph showing comparative analysis of cost sheet of KSRTC
chikkaballapur during the year 2014-15 to 2015-16
INTERPRETATION:
In the above chart we can interpret that the earned revenue sufficiently but in the variable
cost has been increased 2.14% of fuel, lubricants, batteries, depreciation of vehicles,
comparatively base year 2014-15. And variable costs of employee cost, miscellaneous,
central expenses are incurred more cost and increased 2.14%.but during the year KSRTC
chikkaballapur has faced huge loss of 2060.77 comparatively base year and current year.
2383.71
243
80.13
-2060.77
14.67%
2.14%
2.14%
2.14%
-2500 -2000 -1500 -1000 -500 0 500 1000 1500 2000 2500 3000
Revenue
Variable cost
Fixed cost
Net profit loss
50. 50
Table: 4.12
The Table shows comparative analysis of cost sheet of KSRTC
Chikkaballapur 2015-16 and 2016-17
ANALYSIS:
These tables show the details of comparative analysis of cost sheet of KSRTC
Chikkaballapur 2015-16 and 2016-17. The revenue has increased comparatively 2015-16
of 1988.41. And also increased variable cost and fixed cost of rupees 217.26, 1620.87
respectively. In this competitive years incurred the net loss of -150.09 respectively.
Particular Absolutes change
amount
Increasing / decreasing percentage
Revenue 1988.41 10.67
Variable cost 217.26 1.87
Fixed cost 1620.87 22.47
Net profitloss -150.09 98.96
51. 51
GRAPH: 4.12
The graph showing comparative analysis of cost sheet of KSRTC
chikkaballapur during the year 2015-16 and 2016-17
INTERPRETAION:
The above chart we can interpret the comparative analysis of cost sheet of KSRTC
chikkaballapur 2015-16 and 2016-17. The earned revenue sufficiently but in the variable
cost has been increased 10.67% of fuel, lubricants, batteries, depreciation of vehicles,
comparatively base year 2015-16. And variable costs of employee cost, miscellaneous,
central expenses are incurred more cost and increased 10.67%.but the during the year
KSRTC chikkaballapur has faced huge loss of 15.09 comparatively base year and current
year.
1988.41
217.26
1620.87
-150.0910.67% 10.67% 10.67% 10.67%
-500
0
500
1000
1500
2000
2500
Revenue Variable cost Fixed cost Net profitloss
Absolutes change amount Increasing / decreasing percentage
52. 52
Table: 4.13
The Table shows comparative analysis of cost sheet of KSRTC
Chikkaballapur 2016-17 and 2017-18
Particular Absolutes change
amount
Increasing / decreasing
percentage
Revenue -12.08 -0.06
Variable cost -1918.96 -16.27
Fixed cost 830.61 9.41
Net profit 1076.27 68552.2
ANALYSIS:
The above table shows the details of competitive analysis of cost sheet of KSRTC
chikkaballapur 20114-15 and 2017-18. In this year revenue and variable cost has been
decreased -12.08, -1918.96. In the current year has earned net profit of 1076.27
respectively.
53. 53
GRAPH: 4.13
The graph showing comparative analysis of cost sheet of KSRTC chikkaballapur
during the year 2016-17 and 2017-18
INTERPRETAION:
The above chart we can interpret the comparative analysis of cost sheet of KSRTC
chikkaballapur 2016-17 and 2017-18. The earned revenue sufficiently but in the variable
cost has been decreased 16.27% of fuel, lubricants, batteries, depreciation of vehicles,
comparatively base year 2015-16. And variable costs of employee cost, miscellaneous,
central expenses are incurred more cost and increased 9.41%.but in during the year
KSRTC chikkaballapur has faced huge profit of 1076.27 comparatively base years and
current year.
-12.08
-1918.96
830.61
1076.27
-0.06%
-16.27%
9.41%
68552.2%
-10000 0 10000 20000 30000 40000 50000 60000 70000 80000
Revenue
Variable cost
Fixed cost
Net profit
Increasing / decreasing percentage Absolutes change amount
54. 54
Table: 4.14
The Table shows comparative analysis of cost sheet of KSRTC
Chikkaballapur 2017-18 and 2018-19
Particular Absolutes change amount Increasing / decreasing
amount
Revenue 1012.08 4.91
Variable cost 1162.15 11.76
Fixed cost
136.39
1.41
Net profit -286.46 -26.65
ANALYSIS:
The above table shows competitive analysis of cost of KSRTC chikkaballapur 2017-18
and 2018-19. In this year’s absolute revenue, variable cost and fixed cost has been
increased of 1012.08, 1162.15, and 136.39 respectively. And also the net profit is
decreased -286.46 of comparatively the base year
55. 55
GRAPH: 4.14
The graph showing comparative analysis of cost sheet of KSRTC
chikkaballapur during the year 2017-18 and 2018-19
INTERPRETAION:
The above chart we can interpret the comparative analysis of cost sheet of KSRTC
chikkaballapur 2017-18 and 2018-19. The earned revenue sufficiently but in the variable
cost has been decreased 11.76% of fuel, lubricants, batteries, depreciation of vehicles,
comparatively base year 2017-18. And variable costs of employee cost, miscellaneous,
central expenses are incurred more cost and increased 1.42%.but the during the year
KSRTC chikkaballapur has faced huge profit of 1076.27 but comparatively decreased
26.65% of net profit base year and current year
.
1012.08
1162.15
136.39
-286.46
4.91%
11.76%
1.42%
-26.65%
-400 -200 0 200 400 600 800 1000 1200 1400
Revenue
Variable cost
Fixed cost
Net profit
Increasing / decreasing amount Absolutes change amount
58. 58
Table: 4.17
The table shows a comparative analysis of cost sheet of KSRTC
chikkaballapur 2016-17 and 2017-18
Particulars 2016-17
base year
2017-18
current year
Absolute
change
Percentage
increase/
decrease
Revenue 20626.68 20614.60 -12.08 -0.06
Operating Cost:
A)Variable Cost
1)Fuel
2) Consumables & Spares
3) Tyres, Tubes & Flaps
4)Lubricants
5)Expenses
6)Batteries
7)Depreciation on Vehicles
8)Motor Van Tax
9)Reconditioning
8288.63
327.09
513.58
119.86
110.05
29.65
1308.59
1011.19
88.38
6609.84
341.27
423.86
103.81
85.69
29.20
1189.06
994.86
101.03
14.18
-1678.79
410.28
-16.05
24.36
-0.45
-119.53
-16.33
12.65
4.36
-20.65
79.89
-13.39
-22.14
-1.52
-9.13
-1.61
14.31
Total variable cost (A) 11797.01 9878.05 -1919.96 -16.27
B) Fixed Cost
1) Employee Cost
2)Fixed Assets Deprecation
3)Details of Interest
4)Central Expenses
5)Accidents
6) Miscellaneous
6888.10
141.13
264.01
564.01
246.24
727.76
7404.20
152.49
263.45
645.21
416.84
779.66
516.1
11.36
-0.56
81.2
89.42
180.44
7.49
8.05
-0.21
14.40
57.03
32.96
Total fixed cost (B) 8831.24 9661.85 830.61 9.41
Total cost (A&B) 20628.25 19539.90 -1088.35 -5.27
Net profit -1.57 1074.70 1073.13 68352.22
59. 59
Table: 4.18
The table shows a comparative analysis of cost sheet of KSRTC
chikkaballapur 2017-18 and 2018-19
Particulars 2017-18
base year
2018-19
current year
Absolute
change
Percentage
increase/
decrease
Revenue 20614.60 21626.68 1012.08 4.91
Operating Cost:
A)Variable Cost
1)Fuel
2) Consumables & Spares
3) Tyres, Tubes & Flaps
4)Lubricants
5)Expenses
6)Batteries
7)Depreciation on Vehicles
8)Motor Van Tax
9)Reconditioning
6609.84
341.27
423.86
103.81
85.69
29.20
1189.06
994.86
101.03
7609.79
355.45
450.72
101.81
90.69
30.40
1298.06
1001.20
102.08
14.18
999.95
26.86
-02
5
1.2
109
6.34
0.45
4.15
15.12
6.33
-1.92
5.83
4.10
9.16
0.63
0.44
Total variable cost (A) 9878.05 11040.20 1162.15 11.76
B) Fixed Cost
1) Employee Cost
2)Fixed Assets Deprecation
3)Details of Interest
4)Central Expenses
5)Accidents
6) Miscellaneous
7404.20
152.49
263.45
645.21
416.84
779.66
7505.70
160.80
272.48
650.24
426.40
782.62
101.5
8.31
9.03
5.03
9.56
2.96
1.37
5.44
3.42
0.77
2.29
0.37
Total fixed cost (B) 9661.85 9798.24 1306.39 1.41
Total cost (A&B) 19539.90 20838.44 1298.54 6.64
Net profit 1074.70 788.24 286.46 26.65
60. 60
CHAPTER – 5
FINDINGS, SUGGESTIONS & CONCLUSION
FINDINGS FOR STATE DIVISION
Total Employee Cost when compared to the base year as well as transportation
service is increasing as it is the total cost of the KSRTC will gets increase in year
by year.
Repairs And Maintenance decreased gradually its good sign to the company.
KRSTC has taken good measures to control the Repairs And Maintenance cost.
Total Other Cost decreased gradually its good sign to the company but in the year
2018-19 it has slightly increased compared to base year and also previous year.
Sometimes these other costs will gets varies.
Fuel Oil And Lubricants Cost decreased gradually its good sign to the company.
In 201-17 and in 2018-19 slightly increased compare to previous year but not to
base year.
In the government tax policies there is an fluctuation in Taxes On Passenger
Vehicles and the 2018-19 due to hike in fuel prices and by government changes
the tax has increased in a graeater extent.
There is a continuous increase in the Welfare Cost as the company.
that there are more fluctuations in Administration Cost when compared to the
base year 2015-16 but in the year 2018-19 it increased its cost.
we can say that there continuous decrease when compared to the base year 2015-
16 but last year well slightly increased compare to base year. From last few years
KSRTC is engaging in hiring vehicles so the depreciation on vehicles gets
decrease.
There is a gradual decrease in Financial Costs when compare to the base year
2015-16.
61. 61
decreasing Non-operating cost is good but company should not reduce this cost by
reducing output.
It was fluctuation from the last preceding 4 years. It is not good sign but due to
govt. variance in tax policies hiring vehicle rents may varies from year to year.
This policy will affect on the profit.
Allowances of Drivers & Conductors that from the year 2015-16 to 2018-19 these
allowances are getting increase because every year.
There is an increase in Printing & Stationery when compared to the base year
2015-16 in the 2017-18 decreased slightly because state election purpose there
was an code of conduct.
We can see that there is a quantum jump in Total cost in the year 2016-17
compared to the base year 2015-16 i.e. 100% and 2017-18 and in 2018-19
suddenly Total cost increased due to the total employee cost of the KSRTC is
increasing gradually but rest of employee cost other costs are decreasing
gradually.
62. 62
SUGGESTIONS FOR STATE DIVISION
It is require to introducing efficient and transparent system of purchase of tires,
tubes, chassis, diesel and other maintenance materials.
A large number of buses will be idling due to lack of operating staff. If sufficient
number of drivers and conductors appointed major amount of idle cost can be
minimized.
Regular inspection of all the buses on road must be introduced to minimize losses
due to corrupt practices of the operating staff of the buses.
Bus location tracking device should be used in all the buses. These facilities to
take control measures to safeguard buses in case strike and such crises.
The cost of Tyres &ensembles has been increased it shows that the company can
try to reduce the cost of Tyres & ensembles in future.
Cost of operation should be reduced by avoiding wastage of variable cost like
lubricants.
Other consumables are controls at depots via random checks of other
consumables.
Most of the accident is caused due to concentration on the part of the driver
training in yoga will help a lot to achieve higher levels of concentration while
driving and also provide the counseling centers in every division.
Attractive fare structure should be made in casual to increase the miscellaneous
of KSRTC.
The mechanical conditions of the bases were improved by carrying out
preventive maintenance works step have been taken to improve the diesel KMPL
& engine oil KMPL performance.
General up keep of the bus including body cleaning.
The KSRTC should take certain steps to in casual the operational coverage to
increase the revenue of the company.
Most of the accidents are caused due to lack of concentration on the part of the
drivers training in yoga will help to achieve higher level of concentration while
driving.
These should be maintain the proper co-ordination to reduce the stress reduction.
63. 63
Fuel supply quality controls at all depart via random check of fuel critical
parameters.
Changes relating to improving working conditions.
In order to inculcate safety consciousness among drivers. The safety driving
award schemes implemented.
A number of preventive and curative measures have been taken for prevention of
accidents.
FINDINGS FOR CHICKBALLAPUR DIVION
1. The variable cost of the KSRTC Chikkaballapur Division increased during the
period of study with the increase in variable expenses.
2. It was found that the fixed costs are also in the increasing trend and which
represents the operational cost of the business concern is increasing.
3. As the corporation is increased its operational efficiency every year and thereby it
is proving quality services to its commuters.
4. It was found that the total incurred by KSRTC in relation to total revenues was
comparatively more hence the corporation should focus on increasing its revenue
and also in decreasing the cost.
5. Some of the variable costs such as fuel expenses, lubricants and spare parts costs
are increased year by year hence there is need to assess and control these cost in
order maintain a effective cost management system.
6. The motor van tax as well as the reconditioning expenses is relatively low when
compared to previous years.
7. The cost of depreciation on the fixed assets is increasing in trend.
8. The interest paid by KSRTC towards the borrowings and the overall central cost is
reduced at end of the period of study.
9. The employee cost of KSRTC from the year 2014-15 to 2018-19 has been
increased by due to recruit the new employees.
64. 64
10. The operating cost of KSRTC from the year 2014-15 to 2018-19 has been
increased due to increase in the payment of provision for employees, motor vehicle
tax & spare part.
11. The level of cost of fuel consumed is at fluctuating rate in which is the company
shall maintain a minimum cost of fuel.
12. The spares & ensembles of KSRTC are increasing from year to year. It is in good
position in company point of view
SUGGESTION FOR CHICKBALLAPUR DIVION
It is require to introducing efficient and transparent system of purchase of tires,
tubes, chassis, diesel and other maintenance materials.
A large number of buses will be idling due to lack of operating staff. If sufficient
number of drivers and conductors appointed major amount of idle cost can be
minimized.
Regular inspection of all the buses on road must be introduced to minimize losses
due to corrupt practices of the operating staff of the buses.
Bus location tracking device should be used in all the buses. These facilities to
take control measures to safeguard buses in case strike and such crises.
The cost of Tyres &ensembles has been increased it shows that the company can
try to reduce the cost of Tyres & ensembles in future.
Cost of operation should be reduced by avoiding wastage of variable cost like
lubricants.
Other consumables are controls at depots via random checks of other
consumables.
Most of the accident is caused due to concentration on the part of the driver
training in yoga will help a lot to achieve higher levels of concentration while
driving and also provide the counseling centers in every division.
Attractive fare structure should be made in casual to increase the miscellaneous
of KSRTC.
65. 65
Conclusion
Finally from the above analysis findings and recommendation. I consulted that, every
organization should perform better in order to gain the interest of the people, as from
analysis I come to know that KSRTC is a state Government service sector performing
better but they should minimize cost of operation and they have to perform better in
terms of its financial and physical performance.
So every service sector should provide a better service in order to preserve the
same level of interest among the people.
From the above findings in KSRTC. Ltd can be concluded that the company should
keep under check by exercising certain cost reduction measures. The company needs to
review from time to time for the purpose of control in the cost. The company should not
neglect the cost because cost analysis forms part of sales
From the overall study it is understood that every organization should be effective
in managing the cost at various stages and in various aspects in order to ensure better
flow of revenue to the corporation. The KSRTC has adopted a well-structured cost
management policy; it focuses on high revenue by introducing day to day bus facilities to
the prospective routes. KSRTC is charging fair ticket prices to its customers, which is
solely based on the cost incurred on providing the service.
For maximizing profit cost should be reduced to the minimum. For minimizing the cost
there, should be effective utilization of resources. So, the top management takes steps to
increase the utilization capacity at least to recover all cash expenses otherwise the
company should result in increases in cost of production.
The company should prepare annual budgets which should be necessary for control of
cost. Sufficient fund have to be allocated every year for repairs and maintenance. There
should be fuller utilization of installed capacity and improved inventory polices which
reduces the inventory carrying cost.