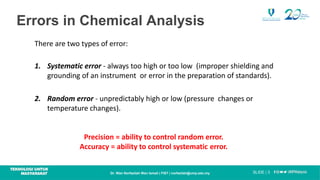
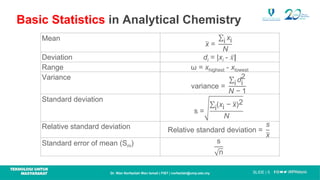
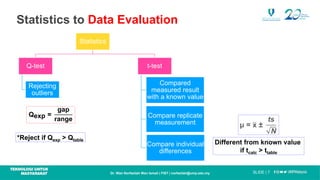
SlideShare a Scribd company logo
1 of 11
Download to read offline
SLIDE | 1
Dr. Wan Norfazilah Wan Ismail | FIST | norfazilah@ump.edu.my
BSK1153
ANALYTICAL CHEMISTRY
CHAPTER 3
EXPERIMENTAL ERRORS AND STATISTICS
DR WAN NORFAZILAH WAN ISMAIL
FACULTY OF INDUSTRIAL SCIENCES AND TECHNOLOGY
norfazilah@ump.edu.my
SLIDE | 2
Dr. Wan Norfazilah Wan Ismail | FIST | norfazilah@ump.edu.my
Measurement and Readings
Depends on what apparatus or instruments you used or read.
Example:
50 mL burette with 0.1 graduation, readings must be to the nearest 0.01 mL
Calibrated mm ruler, readings must be to the nearest 0.1 mm
Others:
Analytical balance??
Top loading balance??
pH meter??
SLIDE | 3
Dr. Wan Norfazilah Wan Ismail | FIST | norfazilah@ump.edu.my
Errors in Chemical Analysis
There are two types of error:
1. Systematic error - always too high or too low (improper shielding and
grounding of an instrument or error in the preparation of standards).
2. Random error - unpredictably high or low (pressure changes or
temperature changes).
Precision = ability to control random error.
Accuracy = ability to control systematic error.
SLIDE | 4
Dr. Wan Norfazilah Wan Ismail | FIST | norfazilah@ump.edu.my
SLIDE | 5
Dr. Wan Norfazilah Wan Ismail | FIST | norfazilah@ump.edu.my
Basic Statistics in Analytical Chemistry
Mean
ത
x =
σi xi
N
Deviation di = |xi - ҧ
𝑥|
Range ω = xhighest - xlowest
Variance
variance =
σi di
2
N − 1
Standard deviation
s =
σi(xi − ത
x)2
N
Relative standard deviation Relative standard deviation =
s
ത
x
Standard error of mean (Sm) s
n
SLIDE | 6
Dr. Wan Norfazilah Wan Ismail | FIST | norfazilah@ump.edu.my
Exercise
For data 0.725, 0.756, 0.752, 0.751 and 0.760. Calculate:
i. Mean
ii. Median
iii. Standard deviation
iv. Variance
v. Relative standard deviation
vi. Range
0.749
0.752
0.0125
1.898 × 10⁻⁴
0.0167
0.035
SLIDE | 7
Dr. Wan Norfazilah Wan Ismail | FIST | norfazilah@ump.edu.my
Statistics to Data Evaluation
Statistics
Statistics
Q-test
Q-test
Rejecting
outliers
Rejecting
outliers
t-test
t-test
Compared
measured result
with a known value
Compared
measured result
with a known value
Compare replicate
measurement
Compare replicate
measurement
Compare individual
differences
Compare individual
differences
Qexp =
gap
range
*Reject if Qexp > Qtable
Different from known value
if tcalc > ttable
μ = ത
x ±
ts
N
SLIDE | 8
Dr. Wan Norfazilah Wan Ismail | FIST | norfazilah@ump.edu.my
Q-test (Rejection of data)
Values of Q for Rejection of Data.
Number of
observations
Q (90% confidence) Q (95% confidence) Q (99% confidence)
3 0.941 0.970 0.994
4 0.765 0.829 0.926
5 0.642 0.710 0.821
6 0.560 0.625 0.740
7 0.507 0.568 0.680
8 0.468 0.526 0.634
9 0.437 0.493 0.598
10 0.412 0.466 0.568
SLIDE | 9
Dr. Wan Norfazilah Wan Ismail | FIST | norfazilah@ump.edu.my
Exercise
The concentrations of metal, M in a water sample were determined in a
set of five measurements: 4.85, 6.18, 6.28, 6.49, and 6.69 ppm. Can we
reject observation 4.85 as an outlier at:
i. 95% confidence level?
ii. 99% confidence level?
Reject
Accept
SLIDE | 10
Dr. Wan Norfazilah Wan Ismail | FIST | norfazilah@ump.edu.my
t-test (Student’s t)
Values of Student’s t.
Degree of
freedom
Confidence interval (%)
50 90 95 98 99 99.5 99.9
1 1.000 6.314 12.706 31.821 63.657 127.32 636.62
2 0.816 2.920 4.303 6.965 9.925 14.089 31.598
3 0.765 2.353 3.182 4.541 5.841 7.543 12.924
4 0.741 2.132 2.776 3.747 4.604 5.598 8.610
5 0.727 2.015 2.571 3.365 4.032 4.773 6.869
6 0.718 1.943 2.447 3.143 3.707 4.317 5.959
7 0.711 1.895 2.365 2.998 3.500 4.029 5.408
8 0.706 1.860 2.306 2.896 3.355 3.832 5.041
9 0.703 1.833 2.262 2.821 3.250 3.690 4.781
10 0.700 1.812 2.228 2.764 3.169 3.581 4.587
…
15 0.691 1.753 2.131 2.602 2.947 3.252 4.073
20 0.687 1.725 2.086 2.528 2.845 3.153 3.850
30 0.683 1.697 2.042 2.457 2.750 3.030 3.646
40 0.681 1.684 2.021 2.423 2.704 2.971 3.551
∞ 0.674 1.645 1.960 2.326 2.576 2.807 3.291
SLIDE | 11
Dr. Wan Norfazilah Wan Ismail | FIST | norfazilah@ump.edu.my
Exercise
A soda ash sample is analyzed in the UMP laboratory by titration with
standard hydrochloric acid. The analysis is performed in triplicate with
the following results: 93.58%, 93.43% and 93.50% Na2CO3. Calculate
the range where the true value lies at 95% confidence level.
The mean = 93.50%
standard deviation, s = 0.075% Na2CO3
At 95% confident level and two degree of
freedom, t = 4.303
Confident limit = x ± ts / N
= 93.50 ± (4.303 x 0.075) / 3
= 93.50 ± 0.19 %
true value = 93.31 – 93.69%

More Related Content

Similar to Chapter 3 Experimental Errors Statistics

Basic Analytics Module for Sponsors
Basic Analytics Module for SponsorsBasic Analytics Module for Sponsors
Basic Analytics Module for Sponsors
Dee Daley
 
Biostatistics CH Lecture Pack
Biostatistics CH Lecture PackBiostatistics CH Lecture Pack
Biostatistics CH Lecture Pack
Shaun Cochrane
 
capwappresentgsdfgsdfgsdfgsdfgsdfgsdfgsdfg.ppt
capwappresentgsdfgsdfgsdfgsdfgsdfgsdfgsdfg.pptcapwappresentgsdfgsdfgsdfgsdfgsdfgsdfgsdfg.ppt
capwappresentgsdfgsdfgsdfgsdfgsdfgsdfgsdfg.ppt
akhoanguyeneng
 
Wan Muhamad Amir et al., 2015
Wan Muhamad Amir et al., 2015Wan Muhamad Amir et al., 2015
Wan Muhamad Amir et al., 2015
Min Pau Tan
 
Risk management Report
Risk management ReportRisk management Report
Risk management Report
NewGate India
 

Similar to Chapter 3 Experimental Errors Statistics (20)

Basic Analytics Module for Sponsors
Basic Analytics Module for SponsorsBasic Analytics Module for Sponsors
Basic Analytics Module for Sponsors
 
Biostatistics CH Lecture Pack
Biostatistics CH Lecture PackBiostatistics CH Lecture Pack
Biostatistics CH Lecture Pack
 
9 10 kendali variabel xr
9 10 kendali variabel xr9 10 kendali variabel xr
9 10 kendali variabel xr
 
AP Statistics - Confidence Intervals with Means - One Sample
AP Statistics - Confidence Intervals with Means - One SampleAP Statistics - Confidence Intervals with Means - One Sample
AP Statistics - Confidence Intervals with Means - One Sample
 
Unconsolidated Undrained (UU) Triaxial Test
Unconsolidated Undrained (UU) Triaxial TestUnconsolidated Undrained (UU) Triaxial Test
Unconsolidated Undrained (UU) Triaxial Test
 
Statistical control to monitor
Statistical control to monitorStatistical control to monitor
Statistical control to monitor
 
Sampling techniques
Sampling techniquesSampling techniques
Sampling techniques
 
New Clustering-based Forecasting Method for Disaggregated End-consumer Electr...
New Clustering-based Forecasting Method for Disaggregated End-consumer Electr...New Clustering-based Forecasting Method for Disaggregated End-consumer Electr...
New Clustering-based Forecasting Method for Disaggregated End-consumer Electr...
 
Presentation of Project and Critique.pptx
Presentation of Project and Critique.pptxPresentation of Project and Critique.pptx
Presentation of Project and Critique.pptx
 
financial econometric
financial econometricfinancial econometric
financial econometric
 
capwappresentgsdfgsdfgsdfgsdfgsdfgsdfgsdfg.ppt
capwappresentgsdfgsdfgsdfgsdfgsdfgsdfgsdfg.pptcapwappresentgsdfgsdfgsdfgsdfgsdfgsdfgsdfg.ppt
capwappresentgsdfgsdfgsdfgsdfgsdfgsdfgsdfg.ppt
 
BDW Chicago 2016 - Don Deloach, CEO and President, Infobright - Rethinking Ar...
BDW Chicago 2016 - Don Deloach, CEO and President, Infobright - Rethinking Ar...BDW Chicago 2016 - Don Deloach, CEO and President, Infobright - Rethinking Ar...
BDW Chicago 2016 - Don Deloach, CEO and President, Infobright - Rethinking Ar...
 
Six sigma technique
Six sigma techniqueSix sigma technique
Six sigma technique
 
Autoregressive integrated moving average
Autoregressive integrated moving averageAutoregressive integrated moving average
Autoregressive integrated moving average
 
Wan Muhamad Amir et al., 2015
Wan Muhamad Amir et al., 2015Wan Muhamad Amir et al., 2015
Wan Muhamad Amir et al., 2015
 
Exploratory Factor Analysis
Exploratory Factor AnalysisExploratory Factor Analysis
Exploratory Factor Analysis
 
Application of Multivariate Regression Analysis and Analysis of Variance
Application of Multivariate Regression Analysis and Analysis of VarianceApplication of Multivariate Regression Analysis and Analysis of Variance
Application of Multivariate Regression Analysis and Analysis of Variance
 
"Can organisational restructuring of hospitals improve quality and safety"
 "Can organisational restructuring of hospitals improve quality and safety" "Can organisational restructuring of hospitals improve quality and safety"
"Can organisational restructuring of hospitals improve quality and safety"
 
Evaluation of Variability and Combinability of Fecal Calprotectin (FCP) Resul...
Evaluation of Variability and Combinability of Fecal Calprotectin (FCP) Resul...Evaluation of Variability and Combinability of Fecal Calprotectin (FCP) Resul...
Evaluation of Variability and Combinability of Fecal Calprotectin (FCP) Resul...
 
Risk management Report
Risk management ReportRisk management Report
Risk management Report
 

Recently uploaded

CYTOGENETIC MAP................ ppt.pptx
CYTOGENETIC MAP................ ppt.pptxCYTOGENETIC MAP................ ppt.pptx
CYTOGENETIC MAP................ ppt.pptx
Cherry
 
ONLINE VOTING SYSTEM SE Project for vote
ONLINE VOTING SYSTEM SE Project for voteONLINE VOTING SYSTEM SE Project for vote
ONLINE VOTING SYSTEM SE Project for vote
RaunakRastogi4
 
COMPOSTING : types of compost, merits and demerits
COMPOSTING : types of compost, merits and demeritsCOMPOSTING : types of compost, merits and demerits
COMPOSTING : types of compost, merits and demerits
Cherry
 
The Mariana Trench remarkable geological features on Earth.pptx
The Mariana Trench remarkable geological features on Earth.pptxThe Mariana Trench remarkable geological features on Earth.pptx
The Mariana Trench remarkable geological features on Earth.pptx
seri bangash
 
LUNULARIA -features, morphology, anatomy ,reproduction etc.
LUNULARIA -features, morphology, anatomy ,reproduction etc.LUNULARIA -features, morphology, anatomy ,reproduction etc.
LUNULARIA -features, morphology, anatomy ,reproduction etc.
Cherry
 
Digital Dentistry.Digital Dentistryvv.pptx
Digital Dentistry.Digital Dentistryvv.pptxDigital Dentistry.Digital Dentistryvv.pptx
Digital Dentistry.Digital Dentistryvv.pptx
MohamedFarag457087
 
(May 9, 2024) Enhanced Ultrafast Vector Flow Imaging (VFI) Using Multi-Angle ...
(May 9, 2024) Enhanced Ultrafast Vector Flow Imaging (VFI) Using Multi-Angle ...(May 9, 2024) Enhanced Ultrafast Vector Flow Imaging (VFI) Using Multi-Angle ...
(May 9, 2024) Enhanced Ultrafast Vector Flow Imaging (VFI) Using Multi-Angle ...
Scintica Instrumentation
 

Recently uploaded (20)

CYTOGENETIC MAP................ ppt.pptx
CYTOGENETIC MAP................ ppt.pptxCYTOGENETIC MAP................ ppt.pptx
CYTOGENETIC MAP................ ppt.pptx
 
BHUBANESHWAR ODIA CALL GIRL SEIRVEC ❣️ 72051//37929❣️ CALL GIRL IN ODIA HAND ...
BHUBANESHWAR ODIA CALL GIRL SEIRVEC ❣️ 72051//37929❣️ CALL GIRL IN ODIA HAND ...BHUBANESHWAR ODIA CALL GIRL SEIRVEC ❣️ 72051//37929❣️ CALL GIRL IN ODIA HAND ...
BHUBANESHWAR ODIA CALL GIRL SEIRVEC ❣️ 72051//37929❣️ CALL GIRL IN ODIA HAND ...
 
ONLINE VOTING SYSTEM SE Project for vote
ONLINE VOTING SYSTEM SE Project for voteONLINE VOTING SYSTEM SE Project for vote
ONLINE VOTING SYSTEM SE Project for vote
 
Understanding Partial Differential Equations: Types and Solution Methods
Understanding Partial Differential Equations: Types and Solution MethodsUnderstanding Partial Differential Equations: Types and Solution Methods
Understanding Partial Differential Equations: Types and Solution Methods
 
COMPOSTING : types of compost, merits and demerits
COMPOSTING : types of compost, merits and demeritsCOMPOSTING : types of compost, merits and demerits
COMPOSTING : types of compost, merits and demerits
 
Kanchipuram Escorts 🥰 8617370543 Call Girls Offer VIP Hot Girls
Kanchipuram Escorts 🥰 8617370543 Call Girls Offer VIP Hot GirlsKanchipuram Escorts 🥰 8617370543 Call Girls Offer VIP Hot Girls
Kanchipuram Escorts 🥰 8617370543 Call Girls Offer VIP Hot Girls
 
The Mariana Trench remarkable geological features on Earth.pptx
The Mariana Trench remarkable geological features on Earth.pptxThe Mariana Trench remarkable geological features on Earth.pptx
The Mariana Trench remarkable geological features on Earth.pptx
 
Thyroid Physiology_Dr.E. Muralinath_ Associate Professor
Thyroid Physiology_Dr.E. Muralinath_ Associate ProfessorThyroid Physiology_Dr.E. Muralinath_ Associate Professor
Thyroid Physiology_Dr.E. Muralinath_ Associate Professor
 
X-rays from a Central “Exhaust Vent” of the Galactic Center Chimney
X-rays from a Central “Exhaust Vent” of the Galactic Center ChimneyX-rays from a Central “Exhaust Vent” of the Galactic Center Chimney
X-rays from a Central “Exhaust Vent” of the Galactic Center Chimney
 
Efficient spin-up of Earth System Models usingsequence acceleration
Efficient spin-up of Earth System Models usingsequence accelerationEfficient spin-up of Earth System Models usingsequence acceleration
Efficient spin-up of Earth System Models usingsequence acceleration
 
CURRENT SCENARIO OF POULTRY PRODUCTION IN INDIA
CURRENT SCENARIO OF POULTRY PRODUCTION IN INDIACURRENT SCENARIO OF POULTRY PRODUCTION IN INDIA
CURRENT SCENARIO OF POULTRY PRODUCTION IN INDIA
 
Site Acceptance Test .
Site Acceptance Test                    .Site Acceptance Test                    .
Site Acceptance Test .
 
FAIRSpectra - Enabling the FAIRification of Analytical Science
FAIRSpectra - Enabling the FAIRification of Analytical ScienceFAIRSpectra - Enabling the FAIRification of Analytical Science
FAIRSpectra - Enabling the FAIRification of Analytical Science
 
LUNULARIA -features, morphology, anatomy ,reproduction etc.
LUNULARIA -features, morphology, anatomy ,reproduction etc.LUNULARIA -features, morphology, anatomy ,reproduction etc.
LUNULARIA -features, morphology, anatomy ,reproduction etc.
 
Selaginella: features, morphology ,anatomy and reproduction.
Selaginella: features, morphology ,anatomy and reproduction.Selaginella: features, morphology ,anatomy and reproduction.
Selaginella: features, morphology ,anatomy and reproduction.
 
Terpineol and it's characterization pptx
Terpineol and it's characterization pptxTerpineol and it's characterization pptx
Terpineol and it's characterization pptx
 
Use of mutants in understanding seedling development.pptx
Use of mutants in understanding seedling development.pptxUse of mutants in understanding seedling development.pptx
Use of mutants in understanding seedling development.pptx
 
Digital Dentistry.Digital Dentistryvv.pptx
Digital Dentistry.Digital Dentistryvv.pptxDigital Dentistry.Digital Dentistryvv.pptx
Digital Dentistry.Digital Dentistryvv.pptx
 
(May 9, 2024) Enhanced Ultrafast Vector Flow Imaging (VFI) Using Multi-Angle ...
(May 9, 2024) Enhanced Ultrafast Vector Flow Imaging (VFI) Using Multi-Angle ...(May 9, 2024) Enhanced Ultrafast Vector Flow Imaging (VFI) Using Multi-Angle ...
(May 9, 2024) Enhanced Ultrafast Vector Flow Imaging (VFI) Using Multi-Angle ...
 
ABHISHEK ANTIBIOTICS PPT MICROBIOLOGY // USES OF ANTIOBIOTICS TYPES OF ANTIB...
ABHISHEK ANTIBIOTICS PPT MICROBIOLOGY  // USES OF ANTIOBIOTICS TYPES OF ANTIB...ABHISHEK ANTIBIOTICS PPT MICROBIOLOGY  // USES OF ANTIOBIOTICS TYPES OF ANTIB...
ABHISHEK ANTIBIOTICS PPT MICROBIOLOGY // USES OF ANTIOBIOTICS TYPES OF ANTIB...
 

Chapter 3 Experimental Errors Statistics

  • 1. SLIDE | 1 Dr. Wan Norfazilah Wan Ismail | FIST | norfazilah@ump.edu.my BSK1153 ANALYTICAL CHEMISTRY CHAPTER 3 EXPERIMENTAL ERRORS AND STATISTICS DR WAN NORFAZILAH WAN ISMAIL FACULTY OF INDUSTRIAL SCIENCES AND TECHNOLOGY norfazilah@ump.edu.my
  • 2. SLIDE | 2 Dr. Wan Norfazilah Wan Ismail | FIST | norfazilah@ump.edu.my Measurement and Readings Depends on what apparatus or instruments you used or read. Example: 50 mL burette with 0.1 graduation, readings must be to the nearest 0.01 mL Calibrated mm ruler, readings must be to the nearest 0.1 mm Others: Analytical balance?? Top loading balance?? pH meter??
  • 3. SLIDE | 3 Dr. Wan Norfazilah Wan Ismail | FIST | norfazilah@ump.edu.my Errors in Chemical Analysis There are two types of error: 1. Systematic error - always too high or too low (improper shielding and grounding of an instrument or error in the preparation of standards). 2. Random error - unpredictably high or low (pressure changes or temperature changes). Precision = ability to control random error. Accuracy = ability to control systematic error.
  • 4. SLIDE | 4 Dr. Wan Norfazilah Wan Ismail | FIST | norfazilah@ump.edu.my
  • 5. SLIDE | 5 Dr. Wan Norfazilah Wan Ismail | FIST | norfazilah@ump.edu.my Basic Statistics in Analytical Chemistry Mean ത x = σi xi N Deviation di = |xi - ҧ 𝑥| Range ω = xhighest - xlowest Variance variance = σi di 2 N − 1 Standard deviation s = σi(xi − ത x)2 N Relative standard deviation Relative standard deviation = s ത x Standard error of mean (Sm) s n
  • 6. SLIDE | 6 Dr. Wan Norfazilah Wan Ismail | FIST | norfazilah@ump.edu.my Exercise For data 0.725, 0.756, 0.752, 0.751 and 0.760. Calculate: i. Mean ii. Median iii. Standard deviation iv. Variance v. Relative standard deviation vi. Range 0.749 0.752 0.0125 1.898 × 10⁻⁴ 0.0167 0.035
  • 7. SLIDE | 7 Dr. Wan Norfazilah Wan Ismail | FIST | norfazilah@ump.edu.my Statistics to Data Evaluation Statistics Statistics Q-test Q-test Rejecting outliers Rejecting outliers t-test t-test Compared measured result with a known value Compared measured result with a known value Compare replicate measurement Compare replicate measurement Compare individual differences Compare individual differences Qexp = gap range *Reject if Qexp > Qtable Different from known value if tcalc > ttable μ = ത x ± ts N
  • 8. SLIDE | 8 Dr. Wan Norfazilah Wan Ismail | FIST | norfazilah@ump.edu.my Q-test (Rejection of data) Values of Q for Rejection of Data. Number of observations Q (90% confidence) Q (95% confidence) Q (99% confidence) 3 0.941 0.970 0.994 4 0.765 0.829 0.926 5 0.642 0.710 0.821 6 0.560 0.625 0.740 7 0.507 0.568 0.680 8 0.468 0.526 0.634 9 0.437 0.493 0.598 10 0.412 0.466 0.568
  • 9. SLIDE | 9 Dr. Wan Norfazilah Wan Ismail | FIST | norfazilah@ump.edu.my Exercise The concentrations of metal, M in a water sample were determined in a set of five measurements: 4.85, 6.18, 6.28, 6.49, and 6.69 ppm. Can we reject observation 4.85 as an outlier at: i. 95% confidence level? ii. 99% confidence level? Reject Accept
  • 10. SLIDE | 10 Dr. Wan Norfazilah Wan Ismail | FIST | norfazilah@ump.edu.my t-test (Student’s t) Values of Student’s t. Degree of freedom Confidence interval (%) 50 90 95 98 99 99.5 99.9 1 1.000 6.314 12.706 31.821 63.657 127.32 636.62 2 0.816 2.920 4.303 6.965 9.925 14.089 31.598 3 0.765 2.353 3.182 4.541 5.841 7.543 12.924 4 0.741 2.132 2.776 3.747 4.604 5.598 8.610 5 0.727 2.015 2.571 3.365 4.032 4.773 6.869 6 0.718 1.943 2.447 3.143 3.707 4.317 5.959 7 0.711 1.895 2.365 2.998 3.500 4.029 5.408 8 0.706 1.860 2.306 2.896 3.355 3.832 5.041 9 0.703 1.833 2.262 2.821 3.250 3.690 4.781 10 0.700 1.812 2.228 2.764 3.169 3.581 4.587 … 15 0.691 1.753 2.131 2.602 2.947 3.252 4.073 20 0.687 1.725 2.086 2.528 2.845 3.153 3.850 30 0.683 1.697 2.042 2.457 2.750 3.030 3.646 40 0.681 1.684 2.021 2.423 2.704 2.971 3.551 ∞ 0.674 1.645 1.960 2.326 2.576 2.807 3.291
  • 11. SLIDE | 11 Dr. Wan Norfazilah Wan Ismail | FIST | norfazilah@ump.edu.my Exercise A soda ash sample is analyzed in the UMP laboratory by titration with standard hydrochloric acid. The analysis is performed in triplicate with the following results: 93.58%, 93.43% and 93.50% Na2CO3. Calculate the range where the true value lies at 95% confidence level. The mean = 93.50% standard deviation, s = 0.075% Na2CO3 At 95% confident level and two degree of freedom, t = 4.303 Confident limit = x ± ts / N = 93.50 ± (4.303 x 0.075) / 3 = 93.50 ± 0.19 % true value = 93.31 – 93.69%