Chi square 1 arul
•Download as DOCX, PDF•
2 likes•337 views

the way to inter prate data frm chi square

Recommended
More Related Content
Viewers also liked
Similar to Chi square 1 arul
More from Maaruthiswari Nadeson
More from Maaruthiswari Nadeson (12)
Recently uploaded
Recently uploaded (20)
Chi square 1 arul
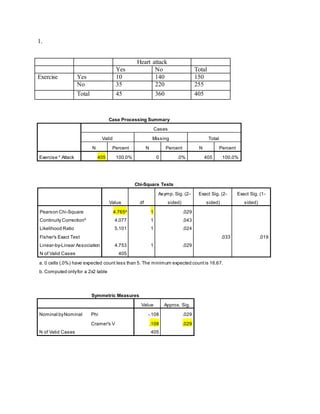
- 1. 1. Heart attack Yes No Total Exercise Yes 10 140 150 No 35 220 255 Total 45 360 405 Case Processing Summary Cases Valid Missing Total N Percent N Percent N Percent Exercise * Attack 405 100.0% 0 .0% 405 100.0% Chi-Square Tests Value df Asymp. Sig. (2- sided) Exact Sig. (2- sided) Exact Sig. (1- sided) Pearson Chi-Square 4.765a 1 .029 Continuity Correctionb 4.077 1 .043 Likelihood Ratio 5.101 1 .024 Fisher's Exact Test .033 .019 Linear-by-Linear Association 4.753 1 .029 N of Valid Cases 405 a. 0 cells (.0%) have expected count less than 5. The minimum expected countis 16.67. b. Computed onlyfor a 2x2 table Symmetric Measures Value Approx. Sig. Nominal byNominal Phi -.108 .029 Cramer's V .108 .029 N of Valid Cases 405
- 2. HYPOTHESIS Ho = There is no relationship between exercise and heart attack. H1 = There is a relationship between exercise and heart attack. MAKE DECISION p<0.05, Ho rejected APA: There is a significant relationship between exercise and heart attack, χ 2 (1, N =405) = 4.765, p< .05, Cramer’s V = .108
- 3. 2 Overweight Yes No Total Breastfed Yes 16 84 100 No 56 144 200 Total 72 228 300 Case Processing Summary Cases Valid Missing Total N Percent N Percent N Percent Breastfed * overweight 300 100.0% 0 .0% 300 100.0% Chi-Square Tests Value df Asymp. Sig. (2- sided) Exact Sig. (2- sided) Exact Sig. (1- sided) Pearson Chi-Square 5.263a 1 .022 Continuity Correctionb 4.626 1 .031 Likelihood Ratio 5.533 1 .019 Fisher's Exact Test .022 .014 Linear-by-Linear Association 5.246 1 .022 N of Valid Cases 300 a. 0 cells (.0%) have expected count less than 5. The minimum expected countis 24.00. b. Computed onlyfor a 2x2 table Symmetric Measures Value Approx. Sig. Nominal byNominal Phi -.132 .022 Cramer's V .132 .022 N of Valid Cases 300
- 4. HYPOTHESIS Ho = There is no relationship between breastfed and overweight. H1 = There is a relationship between breastfed and overweight. MAKE DECISION p<0.05, Ho rejected APA: There is a significant relationship between breastfed and overweight, χ 2 (1, N =300) = 5.263, p< .05, Cramer’s V = .132