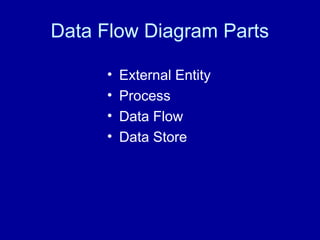
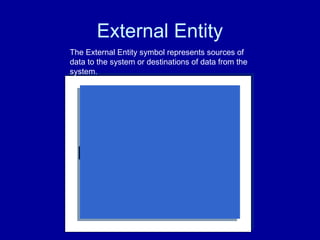
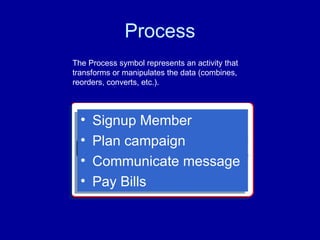
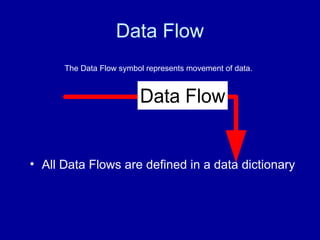
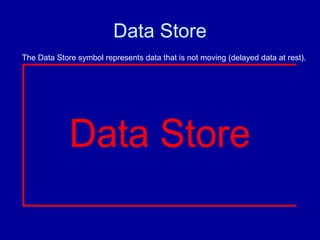
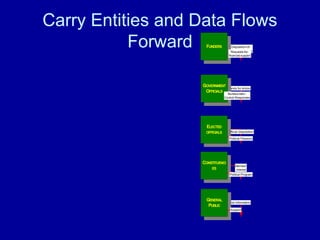
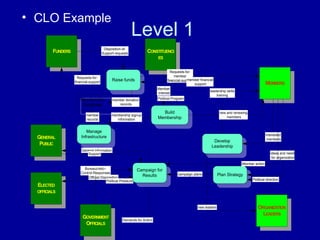
Data Flow Diagrams
Introduction for organizers
The Problem
• How to model a system before building or
changing it
Build an Abstraction
• Molecular Model
Life Cycle
What Life Cycle?
• What does it do?
– All or Part?
• Build or Buy?
– Early decision for all
software systems are
whether to build or buy
• WHO works on it?
• WHO will run it?
• HOW Long will it
last?
The Software Development Cycle
1. Identify problems,
opportunities and
objectives.
2. Define Information
Requirements
3. Analyze
Detailed Needs
4. Specify or Design the
Recommended
System
5. Buy or Develop
the Software
6. Install and
Test
7. Train
8. Deploy
9. Maintain the
system
10. Evaluate and Plan
for New Versions
Symbol of never-ending life
Different Points of View
Put the Parts Together
Organization’s
Requirements
Technical
Experts
User Experts
Technology
Who Does What?
Technical Assistance Provider
User Expert
Joint Effort
Who Does What?
1. Identify problems,
opportunities and
objectives.
2. Define Information
Requirements
3. Analyze
Detailed Needs
4. Specify or Design the
Recommended
System
5. Buy or Develop
the Software
6. Install and
Test
7. Train
8. Deploy
9. Maintain the
system
10. Evaluate and Plan
for New Versions
Technical Assistance Provider
User Expert
Joint
Data Flow Diagram Parts
• External Entity
• Process
• Data Flow
• Data Store
External Entity
EXTERNAL ENTITY
The External Entity symbol represents sources of
data to the system or destinations of data from the
system.
• Funder
• Politician
• Allies
• General Population
• Constituency
• Government
Process
PROCESS BLOCK
The Process symbol represents an activity that
transforms or manipulates the data (combines,
reorders, converts, etc.).
• Signup Member
• Plan campaign
• Communicate message
• Pay Bills
Data Flow
Data Flow
The Data Flow symbol represents movement of data.
• All Data Flows are defined in a data dictionary
Data Store
Data Store
The Data Store symbol represents data that is not moving (delayed data at rest).
Procedure
1. Start at the top level with external entities
to organization
2. Create a context diagram with system at
center and external entities sending and
receiving data flows;
Community-led Organizing
GOVERNMENT
OFFICIALS
ELECTED
OFFICIALS
CONSTITUENCI
ES
FUNDERS
Official Dispoisition
Political Pressure
Bureaucratic–
Control-Responses
Demands for Action
Member
interest
Political Program
Disposition-of-
Support-requests
Requests-for-
financial-support
GENERAL
PUBLIC
General Information
Support
Context Diagram
Carry Entities and Data Flows
Forward
General Information
GENERAL
PUBLIC
Member
interest
CONSTITUENCI
ES
Support
Official Dispoisition
ELECTED
OFFICIALS
Demands for Action
GOVERNMENT
OFFICIALS
Bureaucratic–
Control-Responses
Political Program
Disposition-of-
Support-requests
FUNDERS
Political Pressure
Requests-for-
financial-support
Level 1
• CLO Example
FUNDERS
GENERAL
PUBLIC
General Information
Member
interest
CONSTITUENCI
ES
Support
Official Dispoisition
ELECTED
OFFICIALS
Demands for Action
GOVERNMENT
OFFICIALS
Bureaucratic–
Control-Responses
Political Program
Political Pressure
Build
Membership
Develop
Leadership
Raise funds
Disposition-of-
Support-requests
Requests-for-
financial-support
Manage
Infrastructure
Plan Strategy
Campaign for
Results
Membership
Database
ORGANIZATION
LEADERS
MEMBERS
Political direction
leadership skills
training
Interested
members
new leaders
new and renewing
members
membership signup
information
member
records
Requests-for-
member
financial-support
member financial
support
member donation
records
ideas and needs
for organization
campaign plans
Member action
Level 1
• CLO Example
Exercise

Chapter 03 - Introduction to Data Flow Diagram.ppt

  • 1.
  • 2.
    The Problem • Howto model a system before building or changing it
  • 3.
    Build an Abstraction •Molecular Model
  • 4.
  • 5.
    What Life Cycle? •What does it do? – All or Part? • Build or Buy? – Early decision for all software systems are whether to build or buy • WHO works on it? • WHO will run it? • HOW Long will it last?
  • 6.
    The Software DevelopmentCycle 1. Identify problems, opportunities and objectives. 2. Define Information Requirements 3. Analyze Detailed Needs 4. Specify or Design the Recommended System 5. Buy or Develop the Software 6. Install and Test 7. Train 8. Deploy 9. Maintain the system 10. Evaluate and Plan for New Versions Symbol of never-ending life
  • 7.
  • 8.
    Put the PartsTogether Organization’s Requirements Technical Experts User Experts Technology
  • 9.
    Who Does What? TechnicalAssistance Provider User Expert Joint Effort
  • 10.
    Who Does What? 1.Identify problems, opportunities and objectives. 2. Define Information Requirements 3. Analyze Detailed Needs 4. Specify or Design the Recommended System 5. Buy or Develop the Software 6. Install and Test 7. Train 8. Deploy 9. Maintain the system 10. Evaluate and Plan for New Versions Technical Assistance Provider User Expert Joint
  • 11.
    Data Flow DiagramParts • External Entity • Process • Data Flow • Data Store
  • 12.
    External Entity EXTERNAL ENTITY TheExternal Entity symbol represents sources of data to the system or destinations of data from the system. • Funder • Politician • Allies • General Population • Constituency • Government
  • 13.
    Process PROCESS BLOCK The Processsymbol represents an activity that transforms or manipulates the data (combines, reorders, converts, etc.). • Signup Member • Plan campaign • Communicate message • Pay Bills
  • 14.
    Data Flow Data Flow TheData Flow symbol represents movement of data. • All Data Flows are defined in a data dictionary
  • 15.
    Data Store Data Store TheData Store symbol represents data that is not moving (delayed data at rest).
  • 16.
    Procedure 1. Start atthe top level with external entities to organization 2. Create a context diagram with system at center and external entities sending and receiving data flows;
  • 17.
    Community-led Organizing GOVERNMENT OFFICIALS ELECTED OFFICIALS CONSTITUENCI ES FUNDERS Official Dispoisition PoliticalPressure Bureaucratic– Control-Responses Demands for Action Member interest Political Program Disposition-of- Support-requests Requests-for- financial-support GENERAL PUBLIC General Information Support Context Diagram
  • 18.
    Carry Entities andData Flows Forward General Information GENERAL PUBLIC Member interest CONSTITUENCI ES Support Official Dispoisition ELECTED OFFICIALS Demands for Action GOVERNMENT OFFICIALS Bureaucratic– Control-Responses Political Program Disposition-of- Support-requests FUNDERS Political Pressure Requests-for- financial-support
  • 19.
  • 20.
    FUNDERS GENERAL PUBLIC General Information Member interest CONSTITUENCI ES Support Official Dispoisition ELECTED OFFICIALS Demandsfor Action GOVERNMENT OFFICIALS Bureaucratic– Control-Responses Political Program Political Pressure Build Membership Develop Leadership Raise funds Disposition-of- Support-requests Requests-for- financial-support Manage Infrastructure Plan Strategy Campaign for Results Membership Database ORGANIZATION LEADERS MEMBERS Political direction leadership skills training Interested members new leaders new and renewing members membership signup information member records Requests-for- member financial-support member financial support member donation records ideas and needs for organization campaign plans Member action Level 1 • CLO Example
  • 21.

Editor's Notes

  • #6 Identify problems, opportunities and objectives. Where you are Where you want to go Strategic Planning Infrastructure Tactical Planning Campaigns Define Information Requirements What you have Functional requirements What you want What you need Analyze Detailed Needs Talk to end users Gather specifications Document and review Specify or Design the Recommended System Develop mock-up Buy or Develop the Software Programming and documentation Evaluation of alternatives Install and Test Quality Assurance Test Install Training User Manuals Train Staff Deployment Go Live Hotline support Maintaining the system Evaluating and Planning for New Versions
  • #7 Organizers and technicians are thinking about different things
  • #9 User Expert - campaign staff of community led organization with knowledge of appropriate use of technology in the context of organizing Technical Assistance Provider – External or internal technical person Joint Effort – work done by both skill sets.
  • #10 User Expert: Identify problems, opportunities and objectives. 10. Evaluate and Plan for New Versions Technical Assistance Provider: 4. Specify or Design the Recommended System 5. Buy or Develop the Software Joint Efforts: 2. Define Information Requirements 3. Analyze Detailed Needs 6. Install and Test 7. Train 8. Deploy 9. Maintain the system
  • #12 The External Entity symbol represents sources of data to the system or destinations of data from the system. External Entities: are named with appropriate name. can be duplicated, one or more times, on the diagram to avoid line crossing. determine the system boundary. They are external to the system being studied. They are often beyond the area of influence of the developer. can represent another system or subsystem. go on margins/edges of data flow diagram
  • #13 The Process symbol represents an activity that transforms or manipulates the data (combines, reorders, converts, etc.). Processes: show data transformation or change. Data coming into a process must be "worked on" or transformed in some way. Thus, all processes must have inputs and outputs. In some (rare) cases, data inputs or outputs will only be shown at more detailed levels of the diagrams. Each process in always "running" and ready to accept data. are represented by a rounded corner rectangle are named with one carefully chosen verb and an object of the verb. There is no subject. Name is not to include the word "process". Each process should represent one function or action. If there is an "and" in the name, you likely have more than o ne function (and process). have physical location shown only for existing physical systems or a physical design is being represented. are numbered within the diagram as convenient. Levels of detail are shown by decimal notation. For example, top level process would be Process 14, next level of detail Processes 14.1-14.4, and next level with Processes 14.3.1-14.3.6. should generally move from top to bottom and left to right.
  • #14 The Data Flow symbol represents movement of data. Data Flows: are represented with a line with an arrowhead on one end. A fork in a data flow means that the same data goes to two separate destinations. The same data coming from several locations can also be joined. should only represent data, not control. are ALWAYS named. Name is not to include the word "data". are referenced by a combination of the identifiers of the constructs that the data flow connects. (14-A references a data flow from process 14 to external entity A)
  • #15 The Data Store symbol represents data that is not moving (delayed data at rest). Data Stores: are generic for physical files (index cards, desk drawers, magnetic disk, magnetic tape, shirt pocket, human memory, etc.) are named with an appropriate name, not to include the word "file", and numbered with a number preceded with a capital letter D can be duplicated, one or more times, to avoid line crossing. can show two or more systems that share a data store. This is done by adding a solid stripe on the left boundary. (Figure 5.34) This can occur in the case of one system updating the data store, while the other system only accesses the data. For ex ample, the data store could be a freight rate book that one system builds and maintains, but is used by the represented system. are detailed in the data dictionary or with data description diagrams.
  • #16 Procedure: The procedure for producing a data flow diagram is to: identify and list external entities providing inputs/receiving outputs from system; identify and list inputs from/outputs to external entities; create a context diagram with system at center and external entities sending and receiving data flows; identify the business functions included within the system boundary; identify the data connections between business functions; confirm through personal contact sent data is received and vice-versa; trace and record what happens to each of the data flows entering the system (data movement, data storage, data transformation/processing) attempt to connect any diagram segments into a rough draft; verify all data flows have a source and destination; verify data coming out of a data store goes in; redraw to simplify--ponder and question result; review with "informed"; explode and repeat above steps as needed.
  • #18 identify the business functions included within the system boundary; identify the data connections between business functions; confirm through personal contact sent data is received and vice-versa; trace and record what happens to each of the data flows entering the system (data movement, data storage, data transformation/processing) attempt to connect any diagram segments into a rough draft;
  • #19 You take the context diagram block and find 5-7 main functions that take place within it. Draw them as process blocks
  • #20 verify data coming out of a data store goes in; redraw to simplify--ponder and question result; review with "informed"; explode and repeat above steps as needed.