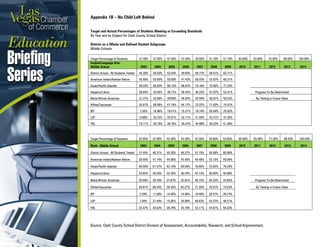
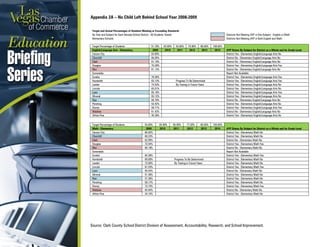
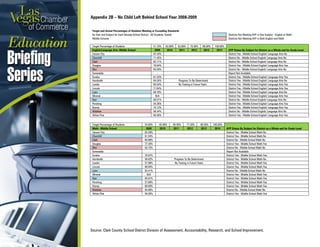
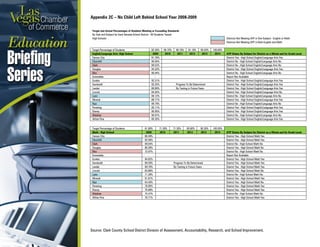
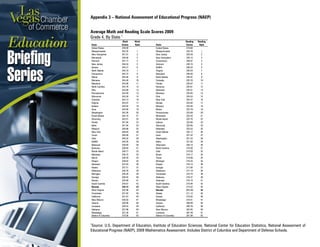
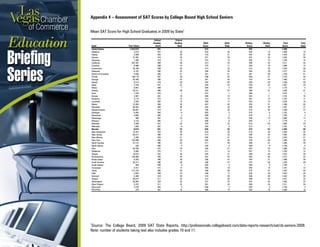
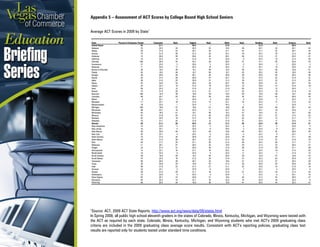
Education Briefing Series K-12 Student Achievement Testing
Applied Analysis has been asked by the Las Vegas Chamber of Commerce to examine various aspects of Nevada’s system of elementary and secondary education in public schools (“K-12”). Among the relevant issues is student achievement, as measured by various forms of testing required under federal and state laws. Although the vigorous debate over student achievement has been widely publicized in general terms, the labyrinth of reporting requirements and testing instruments is not well understood outside the K-12 education community. The ongoing controversy among educators as to the usefulness and accuracy of various tests in measuring desired skills and abilities is not treated here. Rather, this paper simply provides some recent historical background for today’s continuing interest in student proficiency at both state and federal levels, a brief description of several of the tests prominently discussed in Nevada today, and, where available, comparisons among states and among Nevada school districts.
Highlights from findings of the SREB reportsBenchmarking State Implementation of College- and Career-Readiness Standards, Aligned Assessments and Related Reforms
Standards and Assessments: Benchmarking State Implementation of College- and ...SREB
SREB report: What actions have states taken to foster implementation of their new college- and career-readiness standards and the assessments aligned to them?
Dr. Kritsonis Recognized as Distinguished Alumnus
In 2004, Dr. Kritsonis was recognized as the Central Washington University Alumni Association Distinguished Alumnus for the College of Education and Professional Studies. Final selection was made by the Alumni Association Board of Directors. Recipients are CWU graduates of 20 years or more and are recognized for achievement in their professional field and have a positive contribution to society. For the second consecutive year, U.S. News and World Report placed Central Washington University among the top elite public institutions in the west. CWU was 12th on the list in the 2006 On-Line Education of “America’s Best Colleges.”
Analyzed in this investigation were the current Texas state-mandated assessments in reading and the extent to which test scores differed among English Language Learners who were Not Poor (i.e., did not qualify for the reduced or free lunch program), English Language Learners who were Moderately Poor (i.e., qualified for the reduced lunch program), and English Language Learners who were Extremely Poor (i.e., qualified for the free lunch program). In all cases, reading achievement was lowest for English Language Learners who were Very Poor, followed by English Language Learners who were Moderately Poor. English Language Learners who were Not Poor had the highest reading performance in all four school years. Implications for policy and practice, as well as recommendations for future research, are provided.
Aligned Teaching Resources: Benchmarking Implementation of College- and Caree...SREB
SREB report: How have state departments of education fostered local educators’ use of high-quality instructional resources that are aligned to their state’s new college- and career-readiness standards?
Closing Achievement Gaps in U.S. Public Schools: Exploring Global Models of L...Meghan Lee
Research essay on U.S. public school reformation solutions to close achievement gaps for language minority students taking into account best global models for language instruction and overall education of students.
Dr. Kritsonis has traveled and lectured extensively throughout the United States and world-wide. Some international travels include Australia, New Zealand, Tasmania, Turkey, Italy, Greece, Monte Carlo, England, Holland, Denmark, Sweden, Finland, Russia, Estonia, Poland, Germany, Mexico, the Caribbean Islands, Mexico, Switzerland, Grand Cayman, Haiti, St. Maarten, St. John, St. Thomas, St. Croix, St. Lucia, Puerto Rico, Nassau, Freeport, Jamaica, Barbados, Martinique, Canada, Curacao, Costa Rico, Aruba, Venezuela, Panama, Bora Bora, Tahiti, Latvia, Spain, Honduras, and many more. He has been invited to lecture and serve as a guest professor at many universities across the nation and abroad.
Almost all Moroccan institutions of education, as others elsewhere, of all levels from primary, secondary to higher, of all sectors, from private to public, of all shapes and sizes, from metropolitan universities to small institutions, are starting to teach English as a second language to students. These students’ learning is influenced by their parents’ involvement in and attitudes toward English language. Such influence is what the current study tires to investigate and evaluate in the Moroccan context. To this end, a quantitative approach was adopted, and 31 questionnaires were distributed on students at Sidi Mohamed Ben Abdellah University. The results showed that parents were strongly involved in their children’s learning of English though with varying degree. Parents with educational background and considerable income accompanied their children through all twists and turns of their learning journey. The less fortunate ones, however, were less engaged when it comes to orienting their children’s specialty choice. It was also found out that most parents recognized the crucial role of English language. The findings revealed also that parents’ support in and positive attitudes toward English language have significantly facilitated and contributed to the academic achievement of the students.
The Connecticut Coalition for Achievement Now (ConnCAN) has provided an in-depth analysis of state and district level results that includes a breakdown of results by student group, provides a look into the performance of the state’s five largest districts, and highlights standout districts that are exceeding the state average performance for Connecticut’s students of color and low-income students.
Leadership Las Vegas is an intensive, 10-month program devoted to strengthening and educating our community leaders. Leadership Las Vegas provides in-depth insights into a variety of issues impacting residents of Southern Nevada.
Chamber Membership Brings Credibility to Your Business
Positive perception increases among consumers and business owners when a business is identified as a member
of the local chamber of commerce.
A national study by the Schapiro Group, an Atlanta-based market research firm, reveals a number of important
findings about how consumers and business
Download a copy of the Las Vegas Chamber of Commerce Business Voice. This monthly news magazine is distributed to nearly 10,000 local business professionals every month.
The zeitgeist of all tech, all the time is changing the dynamics of business. With so many options in constant upgrading motion, it is hard to keep up, let alone understand how to incorporate these new tools into trade. For most of us, the reaction is: “that’s cool – now what?” We may be able to adopt these new and increasingly user-friendly tools but we lack the innate ability to naturally incorporate new devices into our daily grind. We have to think about it, much like a second language that one can master, but which will never be inherent.
Check out the August issue of the Las Vegas Chamber of Commerce Voice to learn more.
Like this month’s cover? You can watch the behind the scenes video on our YouTube channel: http://t.co/FoLJ8FW
The Las Vegas Chamber of Commerce Magazine, July 2011
"Celebrating the American Dream"
The Las Vegas Chamber of Commerce played an active and important role in supporting and protecting the business community during the 2011 Legislature. It was legislative session with many unexpected twists and turns; in the end Governor Brian Sandoval and legislative leaders came together to pass tax relief for small businesses and enact significant and meaningful reform that will build a firmer foundation for the future.
Download this copy of our monthly business magazine, the Business Voice to learn more.
I selected a problem (issue, concern, or need) in my professional practice, discussed the problem and purpose and developed 3 research questions to guide the literature review for my action research proposal. In this paper, I drafted a literature review by selecting, evaluating, and synthesizing 5-6 peer-reviewed articles. My goal in conducting this literature review is to identify best-practice solution(s) or intervention(s) that I may implement related to the identified problem (issue, concern, or need) and then decide on the solution or intervention I will (propose to) implement in my action research proposal.
W W W. A M E R I C A N P R O G R E S S . O R GAP PMoseStaton39
W W W. A M E R I C A N P R O G R E S S . O R G
A
P
P
H
O
TO
/ JO
SE F. M
O
R
EN
O
A Look at the Education Crisis:
Tests, Standards, and the Future
of American Education
By Ulrich Boser, Perpetual Baffour, and Steph Vela January 2016
A Look at the Education Crisis:
Tests, Standards, and the
Future of American Education
By Ulrich Boser, Perpetual Baffour, and Steph Vela January 2016
1 Introduction and summary
6 An education crisis spanning centuries
8 The success of standards-based reform
9 How serious is the nation’s education problem?
13 Recommendations
16 Conclusion
17 About the authors and acknowledgments
18 Endnotes
Contents
1 Center for American Progress | A Look at the Education Crisis: Tests, Standards, and the Future of American Education
Introduction and summary
In many ways standards-based school reform is at a crossroads. On one side, the
movement has made tremendous strides. The Common Core State Standards
Initiative, known simply as Common Core, is now strongly established in more
than 40 states.1 Many teachers believe that the new, higher academic standards
have helped them improve instruction.2 And, most importantly, a solid body of
data demonstrates that the standards-based reform movement has shown success
in raising student outcomes.3
In some areas, outcome indicators are on the rise. Over the past two decades, for
instance, the number of students of color performing at grade level in reading and
math has more than doubled in elementary and middle school.4 Meanwhile, high
school graduation rates are the highest they have ever been: 81 percent of the class
of 2013 received their diploma within four years.5
But clearly much work remains. Achievement gaps in many subject areas remain
large. For example, only 21 percent of low-income fourth-grade students achieved
proficiency on the 2015 NAEP reading test compared to 52 percent of nonpoor
students.6 And if students of color graduated at the same rate as their white peers,
they would receive nearly two hundred thousand more diplomas each year.7
In a way, the question for education advocates boils down to: What’s next? For
a few vocal observers, the answer to this question is—surprisingly—anything
but standards-based reform. In other words, these observers believe that the
standards-based reform effort—and its associated assessments and accountabil-
ity efforts—have been a total failure. In a policy memo released last year, Kevin
Welner and William Mathis of the National Education Policy Center argued
that “we as a nation have devoted enormous amounts of time and money to the
focused goal of increasing test scores, and we have almost nothing to show for it.”8
2 Center for American Progress | A Look at the Education Crisis: Tests, Standards, and the Future of American Education
Some, such as blogger Anthony Cody, argue that policymakers should not really
even focus on raising standards or improving tests or reform ...
Action Research Proposal: Problem, Purpose, and Research Questions J'Nai Whitehead, MSHRM
This is a draft of an action research proposal that includes an identified problem (issue, concern, or need) in my professional practice/workplace setting. I composed a problem, purpose, and research question(s) to guide my literature review and the action research study.
The Las Vegas Chamber of Commerce Magazine, June 2011
"The Art of Doing Business"
The art of doing business is actually the art of connection - building meaningful relationships with customers and consumers to elevate the relevancy of your brand. As society and our economy evolve, so must the way we approach our everyday business interactions - continually finding new and innovative ways to communicate, to connect and to collaborate.
Download the June 2011 Las Vegas Chamber of Commerce Business Voice to learn more about the "art of doing business."
This monthly news magazine is distributed to nearly 10,000 local business professionals every month.
The Las Vegas Chamber of Commerce Magazine, May 2011
"Facing The Future"
Download a copy of the Las Vegas Chamber of Commerce Business Voice. This monthly news magazine is distributed to nearly 10,000 local business professionals every month.
The Las Vegas Chamber of Commerce Magazine, February 2011
"A Look at Oscar's Good Run"
Download a copy of the Las Vegas Chamber of Commerce Business Voice. This monthly news magazine is distributed to nearly 10,000 local business professionals every month.
The Las Vegas Chamber of Commerce Magazine, April 2011
"Spring Clean Your Business"
Download a copy of the Las Vegas Chamber of Commerce Business Voice. This monthly news magazine is distributed to nearly 10,000 local business professionals every month.
In our January issue we celebrate our 100th anniversary as a Chamber of Commerce!
State-to-State Comparison of Public Employee Compensation Levels - 2008
The Las Vegas Chamber of Commerce is the largest business organization in the state of Nevada. With more than 7,000 members, the Chamber is committed to building a strong local economy, strengthening, enhancing and protecting business.
Leadership Las Vegas is an
intensive, ten-month program
devoted to strengthening and
educating our community leaders.
Leadership Las Vegas provides
in-depth insights into a variety
of issues impacting residents of
Southern Nevada.
Factors Correlated with Educational Attainment
Applied Analysis has been asked by the Las Vegas Chamber of Commerce to examine various aspects of Nevada’s system of elementary and secondary education in public schools (“K-12”). One such aspect is the extent to which student achievement is related or unrelated to socio-economic factors and/or measures of school operations, including, without limitation, financial resources. This briefing examines the most commonly cited factors, analyzing each against student performance on standardized exams and graduation rates in all 50 states and the District of Columbia.
Want to be "greener," but unsure of how to go about making your business more environmentally-savvy without a lot of time and expense?
The Las Vegas Chamber of Commerce is introducing Green Roots, a new tiered program that gives members the tools and resources to launch, cultivate and expand the green efforts of their businesses. You can start slow or shoot for the stars with this self-audited program
Download a copy of the Las Vegas Chamber of Commerce Business Voice. This monthly news magazine is distributed to nearly 10,000 local business professionals every month.
Thinking of getting a dog? Be aware that breeds like Pit Bulls, Rottweilers, and German Shepherds can be loyal and dangerous. Proper training and socialization are crucial to preventing aggressive behaviors. Ensure safety by understanding their needs and always supervising interactions. Stay safe, and enjoy your furry friends!
This presentation includes basic of PCOS their pathology and treatment and also Ayurveda correlation of PCOS and Ayurvedic line of treatment mentioned in classics.
The simplified electron and muon model, Oscillating Spacetime: The Foundation...RitikBhardwaj56
Discover the Simplified Electron and Muon Model: A New Wave-Based Approach to Understanding Particles delves into a groundbreaking theory that presents electrons and muons as rotating soliton waves within oscillating spacetime. Geared towards students, researchers, and science buffs, this book breaks down complex ideas into simple explanations. It covers topics such as electron waves, temporal dynamics, and the implications of this model on particle physics. With clear illustrations and easy-to-follow explanations, readers will gain a new outlook on the universe's fundamental nature.
Normal Labour/ Stages of Labour/ Mechanism of LabourWasim Ak
Normal labor is also termed spontaneous labor, defined as the natural physiological process through which the fetus, placenta, and membranes are expelled from the uterus through the birth canal at term (37 to 42 weeks
Delivering Micro-Credentials in Technical and Vocational Education and TrainingAG2 Design
Explore how micro-credentials are transforming Technical and Vocational Education and Training (TVET) with this comprehensive slide deck. Discover what micro-credentials are, their importance in TVET, the advantages they offer, and the insights from industry experts. Additionally, learn about the top software applications available for creating and managing micro-credentials. This presentation also includes valuable resources and a discussion on the future of these specialised certifications.
For more detailed information on delivering micro-credentials in TVET, visit this https://tvettrainer.com/delivering-micro-credentials-in-tvet/
A workshop hosted by the South African Journal of Science aimed at postgraduate students and early career researchers with little or no experience in writing and publishing journal articles.
Exploiting Artificial Intelligence for Empowering Researchers and Faculty, In...Dr. Vinod Kumar Kanvaria
Exploiting Artificial Intelligence for Empowering Researchers and Faculty,
International FDP on Fundamentals of Research in Social Sciences
at Integral University, Lucknow, 06.06.2024
By Dr. Vinod Kumar Kanvaria
Safalta Digital marketing institute in Noida, provide complete applications that encompass a huge range of virtual advertising and marketing additives, which includes search engine optimization, virtual communication advertising, pay-per-click on marketing, content material advertising, internet analytics, and greater. These university courses are designed for students who possess a comprehensive understanding of virtual marketing strategies and attributes.Safalta Digital Marketing Institute in Noida is a first choice for young individuals or students who are looking to start their careers in the field of digital advertising. The institute gives specialized courses designed and certification.
for beginners, providing thorough training in areas such as SEO, digital communication marketing, and PPC training in Noida. After finishing the program, students receive the certifications recognised by top different universitie, setting a strong foundation for a successful career in digital marketing.
Executive Directors Chat Leveraging AI for Diversity, Equity, and InclusionTechSoup
Let’s explore the intersection of technology and equity in the final session of our DEI series. Discover how AI tools, like ChatGPT, can be used to support and enhance your nonprofit's DEI initiatives. Participants will gain insights into practical AI applications and get tips for leveraging technology to advance their DEI goals.
Introduction to AI for Nonprofits with Tapp NetworkTechSoup
Dive into the world of AI! Experts Jon Hill and Tareq Monaur will guide you through AI's role in enhancing nonprofit websites and basic marketing strategies, making it easy to understand and apply.
Biological screening of herbal drugs: Introduction and Need for
Phyto-Pharmacological Screening, New Strategies for evaluating
Natural Products, In vitro evaluation techniques for Antioxidants, Antimicrobial and Anticancer drugs. In vivo evaluation techniques
for Anti-inflammatory, Antiulcer, Anticancer, Wound healing, Antidiabetic, Hepatoprotective, Cardio protective, Diuretics and
Antifertility, Toxicity studies as per OECD guidelines
Las Vegas Chamber of Commerce Student Testing Narrative
1. Appendix 1A – No Child Left Behind
Source: Clark County School District Division of Assessment, Accountability, Research, and
School Improvement.
2. Page 2
March 2010
pplied Analysis has been asked by the Las Vegas Chamber of Commerce to
examine various aspects of Nevada’s system of elementary and secondary
education in public schools (“K-12”). Among the relevant issues is student
achievement, as measured by various forms of testing required under federal and
state laws. Although the vigorous debate over student achievement has been widely
publicized in general terms, the labyrinth of reporting requirements and testing
instruments is not well understood outside the K-12 education community. The
ongoing controversy among educators as to the usefulness and accuracy of various
tests in measuring desired skills and abilities is not treated here. Rather, this paper
simply provides some recent historical background for today’s continuing interest in
student proficiency at both state and federal levels, a brief description of several of
the tests prominently discussed in Nevada today, and, where available,
comparisons among states and among Nevada school districts.
FINDINGS IN SUMMARY
In Nevada, measurable strides have been made to recognize and remediate areas of
weakness in student proficiency, although the pace of improvement remains at
issue. Nevada continues to rank well below national averages on standardized
student proficiency exams administered to elementary school, middle school, and
college-bound high-school students. While these facts are compelling and
concerning, relative scores on national exams alone may fall short of providing a
complete picture of student achievement and the progress made in Nevada’s
schools during the past several years.
Nationwide standardized tests include the National Assessment of Educational
Progress (NAEP) exams given to fourth and eighth-grade students as well as the
College Board (SAT) and American College Testing (ACT) exams taken by many
college-bound high school students. While these tests allow for state-to-state
comparisons, they are not taken by all students in all years and are subject to some
sampling bias. Nevada’s fourth and eighth graders placed no higher than 43rd
in
math or reading on any of the most recent NAEP exams. Only 26 percent of high
school seniors and 11 percent of high school juniors sat for the SAT; placing 35th
nationally in critical reading, 39th
in math, and 40th
in writing. A slightly higher
percent of high school students fared better on the ACT, ranking 28th
nationally in
composite score, 27th
in English, 28th
in math, 28th
in reading, and 31st
in science.
A
3. Page 3
March 2010
A second set of criterion reference exams are taken by nearly all Nevada students
each year. This testing is in direct response to “No Child Left Behind”1
(NCLB) and
its requirement that schools and school districts make “Adequate Yearly Progress”
(AYP) toward student proficiency. Public Law 107-110 (HR1), signed by the
President in 2002, re-authorized a number of preexisting sections of the federal
education code and established the goal that all students will demonstrate
proficiency in English/language arts and in mathematics by the school year 2013-
2014. NCLB gives each state flexibility in selecting its own tests and its own plan
for demonstrating AYP toward meeting the 2013-2014 goal. Until 2013-2014, the
percentage of students demonstrating proficiency, including designated subgroups
of students, must increase according to a schedule culminating at 100 percent in
2013-2014. Hypothetically, when 2013-2014 arrives, and 100 percent of the
students in a school are not proficient as measured by the tests, that school would
be reported as “failing.”
Under NCLB, both individual school performance and district-level performance is
reported annually by the Nevada Department of Education as either making or not
making AYP for English/language arts and for mathematics in elementary, middle
school, and high school. For 2008-2009, six Nevada school districts, including the
Clark County School District (CCSD), were reported as not making AYP. Although
substantial progress has been made in terms of overall student proficiency,
consistent progress has not been the norm for all student population subgroups that
require individualized assessment under the NCLB regime (e.g., certain minority
groups, English language learners, economically disadvantaged students, and
students with disabilities). Notably, while the CCSD did not make AYP in 2009,
elementary school students meeting or exceeding standards have increased from
45.5 percent to 57.2 percent in English/language arts and 49.5 percent to 63.0
percent in math between 2003 and 2009. Middle school students reported increases
from 44.2 percent to 62.7 percent in English/language arts and from 37.4 percent to
61.0 percent in math during the same period, at the same time high school students
reported proficiency increases from 79.1 percent in to 89.5 percent in
English/language arts and 52.1 percent to 69.6 percent in math.2
1
Actual PL 107-110 requirements for proficiency of all students are a condition of eligibility
for Title 1 funding in designated schools. However, Nevada elected to extend the concept of
NCLB to all students in all schools. Also, NCLB requires testing in science beginning in 2005-
2006. While Nevada is now testing in science, standards for these tests are still pending
approval.
These district-wide
gains notwithstanding, if one of 37 possible subgroups fails to make AYP, then the
entire school is designated as failing. These requirements disparately impact large,
diversified school districts; they also tend to mask some meaningful improvements
2
Notably, students meeting or exceeding standards decreased in some categories for all
students between the 2008 and 2009 school years. A complete analysis if student
performance is provided in Appendix 1 at that end of this report.
4. Page 4
March 2010
in the overall rate of core academic proficiency among Nevada’s school children
during the past several years.
STUDENT TESTING NATIONALLY AND IN NEVADA
Concern regarding the effectiveness of our nation’s schools has existed for decades.
As the first baby-boomers reached school age in the 1950’s, Why Johnny Can’t
Read, a widely-publicized book written by Rudolph Flesch; strongly criticized the
teaching of reading through word recognition rather than through phonics, and
pronounced American schools inferior to European schools in this regard.3
Since
public education was at that time organizationally subordinate to other functions at
the federal level, and as no substantial body of case law regarding state
responsibility for equity in school funding had yet accumulated, policy regarding
instruction of students then rested predominantly in the hands of local school
officials.
In 1979, Congress established the United States Department of Education as a
cabinet-level agency; and, in 1983, the National Commission on Excellence in
Education released “A Nation at Risk: The Imperative for Education Reform”, which
characterized our schools as offering a “smorgasbord” curriculum with too little time
invested in mathematics and science, short school days, “written-down” textbooks,
and undercompensated teachers drawn from the lower echelons of graduating
classes, among other maladies.4
Political appetite for proficiency testing increased
nationwide, with Nevada being no exception.
Four years prior to release of that study, Nevada had enacted a significant
centralization of its school funding plan, substantially reducing local control of fiscal
matters.5
While the Nevada State Legislature had long been constitutionally
responsible to “provide” for a public school system, state involvement in
instructional matters had generally been limited to that of the Nevada Department of
Education in concert with local school boards.6
3
“Education: Why Johnny Can’t Read”, Time Magazine, March 14, 1955, http://
Taken together, these events in the
late 1970’s and early 1980’s resulted in more direct involvement by the Nevada
State Legislature in K-12 instructional and financial matters, notwithstanding the
fact that local school boards are ostensibly elected to govern their respective
districts. Every legislative session since 1983, has included substantial deliberation
regarding the content, timing, security, and financing of student proficiency testing;
www.time.com.
4
“A Nation at Risk”, transmittal letter by David Pierpont Gardner, Chairman, April 26, 1983,
http://www.ed.gov.
5
Senate Bill 204, 1979 Nevada Legislature.
6
Nevada Constitution, Article 11.
5. Page 5
March 2010
punctuated in 1997 by the establishment of the Legislative Committee on Education
to investigate specified K-12 issues and prescribe standards for review and
evaluation of reports by the Nevada Department of Education, thereby extending the
reach of the Legislature beyond regular sessions in K-12 matters.7
In general, testing practices are now converging around federal requirements, a
trend likely to continue. The passage by Congress and signature by the President of
HR1 in 2002 began the era of “No Child Left Behind” (NCLB), accelerating the
migration toward “criterion-referenced” tests (CRTs), which measure student
proficiency against predetermined benchmarks and away from “norm-referenced”
tests, which emphasize how students perform against averages. Since each state
selects or creates its own NCLB tests, comparability among school districts within
each state is possible, but comparability among states is not, although support is
gathering within the National Governors Association and the Council of Chief State
School Officers for eventual implementation of national standards.8
NCLB requires
states to establish a timeline for increasing the percentage of proficient students;
ensuring that, not later that the 2013-2014 school year, all students, including those
in each identified subgroup, will meet or exceed state proficiency standards.9
“Adequate Yearly Progress” (AYP) is expected against a set of percentage
thresholds, increasing to 100 percent of all students achieving proficiency by 2013-
2014. To prevent the skewing of scores by pre-selection of the tested population, 95
percent of students in each identified student subgroup must be tested. Sanctions
are imposed on schools for prolonged failure to achieve AYP. Testing is mandated by
federal law in grades 3 through 8, and high school. Nevada also uses its NCLB high
school test to determine eligibility for graduation. Individual grade results are
aggregated and reported for elementary, middle, and high school English/language
arts and mathematics.
Student subgroups are identified by ethnicity, limited English proficiency (“LEP”),
free and reduced price lunch eligibility (“FRL”), and special education status
(individual education plan or “IEP”). Separate measurement of both proficiency and
participation is provided for all students tested; five ethnic groups; and LEP, IEP, and
FRL student populations in the two subject matter areas of English/language arts
and mathematics resulting in as many as 36 different subgroup permutations, any of
which may cause a school to “fail” to meet AYP. Further, if a school has low
average daily attendance or graduation rates, it is deemed failing, regardless of
whether it meets its proficiency and participation targets – creating a 37th
7
NRS 218.5352
8
See: Signed Memorandum of Agreement for Nevada To Participate in Common Core
Standards Initiative, Dr. Keith Rheault, Nevada Superintendent of Public Instruction, May 20,
2009.
9
PL 107-110 Section 1111.
6. Page 6
March 2010
opportunity for failure. Again, regardless of whether all students tested in a school
together achieve the percentage proficiency and participation targets, failure in a
single category, (e.g. insufficient participation among Asian-Pacific Islanders or
insufficient proficiency in mathematics among LEP students) marks that entire
school as not achieving AYP.10
An alternative to meeting the proficiency target outright is the “safe harbor” of a
year-to-year 10 percent or more reduction in the number of non-proficient students
in a subgroup.11
Since any subgroup with 25 or more students must be separately
reported, small schools are more likely to escape separate reporting, regardless of
what percentage any subgroup comprises of their enrollment. Accommodations
may be made for IEP students with severe disabilities through use of alternative
testing procedures and adjustments to the testing environment. In Nevada, all tests
instruments are written in English.
The fact that NCLB imposes consequences on school operations has likely
contributed to the convergence of testing efforts around NCLB. The consequences
imposed through NCLB on schools not making AYP represent an unprecedented
extension of federal involvement in local education outcomes. Corrective action at
the school level is required based on the number of consecutive years of non-
achievement of the AYP percentage threshold.
A school not meeting AYP is identified as “in need of improvement.” For the first
year of such status, the school faces no consequences. For the second through the
fifth consecutive year in which a school does not meet AYP, incremental efforts
including, without limitation, revision of the curriculum, outside expert consultation,
structured parent involvement, school transfer options for parents, school schedule
changes, and planning for restructuring are required. A school failing to meet AYP
for five or more consecutive years must implement a restructuring plan, with the
expectation that the administration of the school may be completely changed, and
that all teachers may have to reapply for their positions if they wish to remain at
that school. Such a school may also be converted to a charter school or have its
operations contracted out to a private company.
In contrast to NCLB, under which different tests are given in every state, the
National Assessment of Educational Progress (NAEP), the College Board (SAT), and
American College Testing (ACT) give the same tests in all states, which allows
10
“No Child Left Behind 2008-2009”, presentation by Clark County School District Division of
Assessment, Accountability, Research, and School Improvement.
11
Id. Also see: “The Nevada Adequate Yearly Progress Technical Manual”, Nevada
Department of Education, May 2009.
7. Page 7
March 2010
comparisons among states. However, such comparisons may not be entirely
conclusive as most students do not take the NAEP, SAT, or SAT tests.
NEVADA’S PERFORMANCE TRENDS
Progress Relative to Nevada’s AYP Objectives
While media attention has typically focused on identifying schools as “achieving” or
“failing” in a particular year, the longer-term notion that all students must achieve
proficiency by school year 2013-2014 raises the question of where is Nevada on the
continuum toward this ideal vision. Since the Clark County School District comprises
nearly three-fourths of state-wide enrollment, its annual targets and progress are
highly relevant in answering this question. Appendix 1 compares, for each school
year from 2002-2003 forward, the proficiency target and the percentage of Clark
County students demonstrating proficiency for all students tested, for each ethnic
group, and for IEP, LEP, and FRL students. It is noteworthy that, if all students tested
were combined as a single subgroup, the district as a whole would be meeting its
annual percentage targets. However, since a number of student subgroups are not,
many Clark County schools and the district as a whole are reported as failing to
achieve AYP.
It has been anecdotally asserted that publicly declaring an entire school as “failing”
based on lack of progress by any one subgroup of 25 or more students, including
those with learning challenges, unfairly penalizes large or diverse school systems;
and, statistically, such assertions are well founded. However, under No Child Left
Behind, such declaration of school “failure” is the unavoidable manifestation,
reasonable or not, of the expectation that every student in the United States will be
proficient within the next five years. Accordingly, organizations and individuals
basing decisions in part on school performance should be cautioned against hasty
categorization of schools and districts without careful analysis of data for each
school and the subgroups of students for which separate reporting is required.
As the school year 2013-2014 approaches, the gaps between the proficiency
actually achieved and 100 percent are certain to be closely observed, and a scenario
of 100 percent proficiency is difficult to imagine. Again, if all Clark County students
tested were combined in a single subgroup, the District would be reported as
achieving proficiency targets. However, several subgroups are not meeting these
targets. This fact considered, it is noteworthy that closing the gaps between current
proficiency and 100 percent proficiency by 2013-2014 will require considerable
acceleration in the pace of improvement as indicated in Appendix 1.
8. Page 8
March 2010
As noted above, nationally-administered tests such as NAEP, SAT, and ACT do not
measure the proficiency of the entire student population as they are based on
samplings of students, either through self-selection in college entrance examinations
or through sampling techniques imposed by the testing organization. That said,
some comparisons among Nevada school districts are possible because of the
uniform testing regime prescribed to meet NCLB requirements. In making such in-
state comparisons observers should be cautioned to also look beyond the broad-
brush designations of “making” or “not making” AYP, as the system clearly creates
more avenues for failure for large or diverse schools and districts. With this factor in
mind, Appendix 2 shows the results for elementary, middle, and high school
English/language arts and mathematics tests for each Nevada school district,
whether that district as a whole is making AYP in that subject, and whether that
district is making AYP at that grade level (e.g. elementary, middle, or high school).
Under the classification system, a district as a whole is deemed to be making AYP
in a subject if AYP is being met in at least one of the three aggregated grade levels.
Therefore, Appendix 2 shows some districts as a whole are making AYP in a tested
subject, but not at a particular grade level: and such districts are shown, for
example, as “District Yes – Elementary Math No”. Appendix 2 shows that, if all
students were combined in a single subgroup, virtually all school districts as a
whole would be meeting the percentage proficiency targets for 2009. However, as
in the case of Clark County, other districts are not making AYP in some subjects and
grade levels due to the requirement that all subgroups and schools have to meet the
same thresholds, statistically a much more difficult task. While, for purposes of
brevity, student subgroups are not reflected in Appendix 2, the importance of this
requirement is made clear by the many indications of failure to meet AYP in a
particular subject at a particular grade level in most districts.
Nevada defines a district as meeting AYP in a tested subject if proficiency is
achieved at any one aggregated grade level – elementary, middle, or high school. If
a district does not achieve proficiency in a subject at any of these three grade
levels, that district is deemed as not making AYP for that subject and for that district
as a whole. Appendix 2 shows that, among districts not making AYP, Churchill and
Nye did not make AYP in English/language arts at any grade level; Lyon did not
make AYP in mathematics at any grade level; and Clark, Elko, and Washoe did not
make AYP in either English/language arts or mathematics at any of the three
aggregated grade levels. All remaining districts met the definition of AYP in both
subjects in at least one grade level.
While some might argue the threshold for a district to meet AYP in a subject is too
low - merely meeting AYP at the elementary, or middle school, or high school level -
at least two points should be raised. First, as shown in Appendix 1, the dramatic
9. Page 9
March 2010
increase in the percentage of students demonstrating proficiency since inception of
the program, coupled with the requirement for 100 percent proficiency by 2013-
2014 can significantly reduce the number of non-proficient students at all levels.
Second, for example, even if a district is struggling to meet proficiency targets in the
lower grades; but is meeting the high school targets, the proof of that district’s
success might lay in a higher likelihood of high school graduation irrespective of
possible issues in the lower grades. Also, hypothetically, even if a district faces
challenges within the current cohort of high school students, that district could be in
process of measurable improvement for the future if their elementary and middle
school students score well and maintain that pattern through high school. While not
justifying any particular definition of Adequate Yearly Progress, such points are
simply intended to recognize that assessing improvement in educational outcomes
over time is a highly complex issue.
Performance on Standardized National Examinations
Comparisons of student achievement among states based on the National
Assessment of Educational Progress (NAEP) and college entrance examinations
(i.e., ACT and SAT) have been published for many years. Although NAEP results are
commonly cited as a benchmark for elementary and middle school performance; as
are SAT and ACT results for high school, comparisons based on these tests may be
somewhat flawed as all students do not take them. Ideally, administering these
tests to all students nationally every year would provide the most comprehensive
comparisons. That said, there is no test currently administered to all students
nationally at any grade level.
NAEP does not administer tests every year and those tests are given only to a
sampling of students drawn by NAEP, only in selected schools (140 of 608 Nevada
public schools), only in grades 4 and 8, and not based on the Nevada curriculum.12
12
Sources: Clark County School District Division of Assessment, Accountability, Research,
and School Improvement and Office of the Superintendent, Nevada Department of Education.
NCLB requires NAEP participation by states in grades 4 and 8 to maintain eligibility for Title 1
funding. Nevada has participated in some long term high school studies only on a limited
basis. Also see: Research Bulletin, Nevada Department of Education, February, 2007.
The fit of the sampling to the makeup of the total student population is critical to the
accuracy of any conclusion, and sampling techniques may be subject to debate.
Also, anecdotally, because NAEP does not test all students in any grade; and as
there is no consequence attached to the test scores in Nevada; preparation of
students for NAEP testing may have received less emphasis in the classroom than
for other tests (e.g., the criterion-referenced tests tied to NCLB and its associated
Adequate Yearly Progress requirements). Respecting that any conclusions based on
NAEP data should be strongly qualified; Appendix 3 shows that Nevada fourth and
eighth graders in the sample tested in 2009 scored visibly lower than the national
10. Page 10
March 2010
average, with rankings from 43rd
to 48th
in math and reading. Flaws in the testing
process aside, such rankings are noteworthy and compelling.
The SAT Reasoning Test (formerly Scholastic Aptitude Test) administered by the
College Board, a non-profit organization, is widely used by higher education
institutions in screening students applying for enrollment. Since the same tests are
given in all states, it is also perceived as one means by which the proficiency of
high school students can be compared among states. In 2009, 6,145 12th
grade
students and 2,763 11th
grade students took the SAT in Nevada, representing 26
percent and 11 percent of the fall enrollment in those grades, respectively.13
It is
likely that many 11th
grade students taking the test will also do so in the 12th
grade,
attempting to better their earlier scores.
Most students need not take the SAT because they are either not college-bound, or
they intend to apply to one or more of over 800 accredited, bachelor-degree granting
institutions in the United States which do not require it for admission, although
many use these scores for student placement and other purposes.14
Restriction of
the tested population to those students who consider themselves college-bound and
who intend to apply to institutions requiring the SAT limits the usefulness of the test
results as an indicator of proficiency for the high school student population. Despite
this lack of direct applicability to the performance of students in general,
comparisons among college-bound high school students are considered by many as
a reasonable measure of instructional rigor and effectiveness in meeting the needs
of students capable of success as adults; and, thereby the needs of society at large.
Hence, the importance placed on college entrance examinations. Appendix 4 shows
Nevada students taking the SAT scored 35th
nationally in critical reading, 39th
nationally in math, and 40th
nationally in writing.
The college entrance examination conducted by ACT, Inc. (formerly American
College Testing Program), is the major competitor to the SAT. The same student
self-selection issues bearing upon the SAT test results also apply to ACT testing.
Accordingly, the ACT is limited in its applicability to the performance of students in
general. However, the ACT results for Nevada students appear more favorable than
for the SAT. Appendix 5 shows that in 2009, Nevada students’ ACT scores ranked
higher against students in other states than for the NAEP and SAT tests - 28th
13
“Research Bulletin, Nevada Department of Education, Fall Enrollment, February 2009. Also
see: “State Profile Report: Nevada”, College Board, 2009. Note: percentage participation
rates shown here are estimated by Applied Analysis based on students reported as tested
compared to total fall enrollment in the affected grades. Other reported percentages may
vary.
14
“Schools That Do Not Use SAT or ACT Scores for Admitting Substantial Numbers of
Students into Bachelor Degree Programs”, Fair Test National Center for Fair and Open
Testing, Boston, Massachusetts, Summer 2009.
11. Page 11
March 2010
nationally in composite score, 27th
nationally in English, 28th
nationally in math, 28th
nationally in reading, and 31st
nationally in science.
CONCLUSION
While both supporters and opponents of increased public school funding have made
their respective arguments based on test scores, the truth is that no comprehensive,
national comparison of the proficiency of all students has ever been undertaken, let
alone published. That said, national comparisons of subsets of students indicate that
Nevada students fare no better than mid-range, and are most often well below
students in other states when evaluating achievement based on standardized test
performance.
Within Nevada results vary; but, predictably, the more diverse school systems with
more reportable subgroups tend to have greater difficulty achieving Adequate Yearly
Progress in NCLB reports. The gaps between current percentages of students found
proficient and any target approaching 100 percent vary dramatically among the
subgroups, highlighting the challenges for teachers, schools, school districts, and
the State Legislature.15
As Nevada seeks to survive the current recession and strengthen its competitive
position nationally, the status of the public school system may be especially
precarious given the state’s present fiscal circumstances. Advocates for K-12 will
likely continue to cite Nevada’s historically large class sizes and low operating
allocations per student as causal factors for lack of progress, while others may
assert that the arrival of economic recovery combined with academic rigor will
resolve any legitimate concerns for the level of resources for improving student
performance. This debate is certainly not new; but, under the requirements of No
Child Left Behind, the obvious challenges confronting the 2011 Legislature and the
rapid approach of the 2013-2014 school year loudly beg the question, “Now what?”
APPLICABILITY OF FINDINGS AND LIMITATIONS OF DATA
As the information herein includes both gains already made and gains yet to be
made in student proficiency; this report is intended to be read and interpreted as a
whole, and in its complete context.
Any comparison of student achievement should be made with the clear
understanding that measuring student proficiency is not only subject to the
15
Nevada Constitution, Article 11.
12. Page 12
March 2010
accuracy and statistical soundness of the testing processes conducted by school
jurisdictions and national testing organizations, but is also highly subject to the
alignment between the knowledge and skills as taught and the knowledge and skills
tested. The ongoing controversy among educators as to the usefulness and
accuracy of various tests in measuring desired skills and abilities is a significant
consideration not treated here.
NCLB requirements cited in this briefing represent a composite of mandates directly
imposed by PL 107-110, and Nevada’s own NCLB-related laws and regulations
intended to enable the state’s compliance with NCLB. It is noted that, in addition to
testing in English/ language Arts and in mathematics, Public Law 107-110 also
requires testing in science beginning in 2005-2006. However, while Nevada is now
testing in science, the standards for these tests are pending approval. Since the
Nevada Department of Education Report Card does not yet include science testing in
determining AYP, science test results are not treated in this report.
As with any analysis, there are limitations that must be considered when drawing
conclusions from the data utilized, including without limitation the fact that
information contained in this report is subject to change due to timing of reporting
and future events.
14. Appendix 1A – No Child Left Behind
Source: Clark County School District Division of Assessment, Accountability, Research, and School Improvement.
Target and Actual Percentages of Students Meeting or Exceeding Standards
By Year and by Subject for Clark County School District
District as a Whole and Defined Student Subgroups
Elementary Schools
Targets 36.00% 34.50% 45.40% 45.40% 43.30% 54.60% 54.60% 65.90% 65.90% 77.20% 88.50% 100.00%
Math - Elementary 2003 2004 2005 2006 2007 2008 2009 2010 2011 2012 2013 2014
District Actual - All Students Tested 49.48% 48.02% 50.27% 52.38% 61.45% 63.60% 62.99%
American Indian/Alaskan Native 48.04% 44.65% 43.60% 46.29% 56.79% 60.04% 55.81%
Asian/Pacific Islander 67.88% 62.11% 67.24% 68.85% 76.08% 77.66% 76.95%
Hispanic/Latino 36.34% 35.59% 38.52% 42.15% 52.50% 56.29% 56.10%
Black/African American 32.30% 30.05% 32.72% 34.88% 45.40% 47.63% 46.57% Progress To Be Determined
White/Caucasian 62.69% 61.22% 63.98% 65.54% 73.14% 74.62% 74.12% By Testing in Future Years
IEP 12.67% 23.33% 26.56% 27.43% 36.09% 41.13% 38.42%
LEP 28.72% 33.04% 29.03% 38.51% 47.98% 43.05% 53.72%
FRL 35.47% 34.35% 36.48% 39.24% 50.05% 54.01% 53.66%
Target Percentage of Students 30.00% 27.50% 39.60% 39.60% 39.60% 51.70% 51.70% 63.80% 63.80% 75.90% 88.00% 100.00%
English/Language Arts -
Elementary 2003 2004 2005 2006 2007 2008 2009 2010 2011 2012 2013 2014
District Actual - All Students Tested 45.54% 42.01% 41.41% 45.46% 56.48% 54.36% 57.19%
American Indian/Alaskan Native 43.20% 37.35% 36.49% 40.49% 55.31% 49.59% 51.47%
Asian/Pacific Islander 59.79% 54.56% 56.43% 60.02% 70.22% 68.62% 69.97%
Hispanic/Latino 29.33% 27.22% 27.77% 33.61% 44.94% 43.84% 47.39% Progress To Be Determined
Black/African American 31.20% 30.14% 29.79% 33.05% 45.12% 42.89% 44.56% By Testing in Future Years
White/Caucasian 60.87% 55.92% 55.11% 58.76% 69.68% 67.54% 70.72%
IEP 10.11% 18.01% 20.06% 20.94% 29.11% 29.83% 29.79%
LEP 18.28% 22.16% 19.25% 27.27% 37.13% 36.45% 41.82%
FRL 29.69% 27.33% 27.60% 31.92% 43.17% 42.49% 45.82%
15. Appendix 1B – No Child Left Behind
Source: Clark County School District Division of Assessment, Accountability, Research, and School Improvement.
Target and Actual Percentages of Students Meeting or Exceeding Standards
By Year and by Subject for Clark County School District
District as a Whole and Defined Student Subgroups
Middle Schools
Target Percentage of Students 32.00% 32.00% 43.30% 43.30% 43.30% 54.60% 54.60% 65.90% 65.90% 77.20% 88.50% 100.00%
Math - Middle School 2003 2004 2005 2006 2007 2008 2009 2010 2011 2012 2013 2014
District Actual - All Students Tested 37.44% 46.31% 45.30% 49.27% 57.19% 56.96% 60.98%
American Indian/Alaskan Native 29.59% 41.14% 44.00% 45.40% 49.46% 52.16% 59.08%
Asian/Pacific Islander 56.58% 61.57% 63.18% 69.58% 76.60% 75.93% 78.39%
Hispanic/Latino 22.85% 30.52% 32.30% 36.44% 44.13% 46.05% 50.98%
Black/African American 20.59% 28.78% 27.67% 32.81% 40.73% 40.22% 43.83% Progress To Be Determined
White/Caucasian 49.91% 60.44% 58.45% 63.27% 71.20% 70.61% 74.03% By Testing in Future Years
IEP 3.59% 11.08% 14.58% 14.90% 19.48% 28.47% 26.74%
LEP 7.00% 27.48% 15.85% 34.09% 40.63% 43.27% 48.21%
FRL 22.47% 30.63% 30.79% 35.19% 43.11% 44.81% 50.33%
Target Percentage of Students 37.00% 37.00% 47.50% 47.50% 39.60% 51.70% 51.70% 63.80% 63.80% 75.90% 88.00% 100.00%
English/Language Arts-
Middle School 2003 2004 2005 2006 2007 2008 2009 2010 2011 2012 2013 2014
District Actual - All Students Tested 44.20% 55.03% 53.44% 49.94% 58.77% 58.51% 62.71%
American Indian/Alaskan Native 42.68% 50.00% 50.00% 47.43% 59.03% 53.87% 60.21%
Asian/Pacific Islander 59.23% 66.83% 68.13% 66.67% 74.16% 74.92% 77.33%
Hispanic/Latino 28.84% 39.56% 38.71% 36.44% 46.22% 47.07% 52.41% Progress To Be Determined
Black/African American 31.21% 42.58% 39.89% 36.54% 45.94% 46.01% 50.53% By Testing in Future Years
White/Caucasian 55.67% 68.06% 67.16% 64.17% 72.07% 71.82% 74.97%
IEP 7.55% 18.96% 19.41% 15.21% 19.74% 28.04% 25.63%
LEP 8.68% 33.75% 29.91% 32.11% 41.04% 42.41% 47.35%
FRL 19.11% 39.79% 38.19% 35.47% 44.98% 46.23% 51.48%
16. Appendix 1C – No Child Left Behind
Source: Clark County School District Division of Assessment, Accountability, Research, and School Improvement.
Target and Actual Percentages of Students Meeting or Exceeding Standards
By Year and by Subject for Clark County School District
District as a Whole and Defined Student Subgroups
High Schools
Target Percentage of Students 42.80% 42.80% 52.30% 52.30% 52.30% 61.80% 61.80% 71.30% 71.30% 80.80% 90.30% 100.00%
Math - High School 2003 2004 2005 2006 2007 2008 2009 2010 2011 2012 2013 2014
District Actual - All Students Tested 52.06% 55.57% 58.42% 68.43% 63.68% 74.26% 69.64%
American Indian/Alaskan Native 41.75% 50.86% 42.66% 64.58% 65.52% 68.47% 62.81%
Asian/Pacific Islander 62.30% 69.06% 71.32% 79.52% 76.40% 83.68% 81.96%
Hispanic/Latino 32.82% 39.24% 43.01% 55.68% 49.72% 63.43% 59.80%
Black/African American 31.98% 35.67% 37.80% 46.41% 43.29% 55.84% 51.40% Progress To Be Determined
White/Caucasian 65.95% 68.18% 71.25% 79.66% 75.62% 85.52% 80.25% By Testing in Future Years
IEP 12.35% 13.73% 18.05% 20.49% 21.34% 33.66% 25.19%
LEP 16.91% 29.94% 41.86% 53.16% 45.63% 59.27% 59.73%
FRL 28.81% 32.97% 38.07% 51.05% 47.37% 59.90% 57.49%
Target Percentage of Students 73.50% 73.50% 77.90% 77.90% 77.90% 82.30% 82.30% 86.70% 86.70% 91.10% 95.50% 100.00%
English/Language Arts-
High School 2003 2004 2005 2006 2007 2008 2009 2010 2011 2012 2013 2014
District Actual - All Students Tested 79.09% 79.66% 81.59% 87.60% 90.15% 90.83% 89.52%
American Indian/Alaskan Native 77.65% 75.57% 78.60% 90.10% 83.33% 87.39% 88.43%
Asian/Pacific Islander 84.23% 84.96% 88.07% 91.75% 93.91% 93.69% 95.52%
Hispanic/Latino 65.10% 67.47% 72.11% 80.72% 84.37% 85.44% 84.40% Progress To Be Determined
Black/African American 70.20% 71.55% 71.71% 80.22% 84.26% 85.65% 85.01% By Testing in Future Years
White/Caucasian 87.52.% 87.71% 88.48% 92.70% 94.80% 95.63% 93.93%
IEP 32.55% 40.59% 43.10% 45.68% 51.97% 60.87% 50.42%
LEP 33.50% 59.99% 67.53% 75.97% 78.95% 70.37% 81.25%
FRL NA 62.32% 74.25% 76.97% 81.10% 83.37% 83.22%
17. Appendix 2A – No Child Left Behind School Year 2008-2009
Source: Clark County School District Division of Assessment, Accountability, Research, and School Improvement.
Target and Actual Percentages of Students Meeting or Exceeding Standards
By Year and Subject for Each Nevada School District - All Students Tested Districts Not Meeting AYP in One Subject - English or Math
Elementary Schools Districts Not Meeting AYP in Both English and Math
Target Percentage of Students 51.70% 63.80% 63.80% 75.90% 88.00% 100.00%
English/Language Arts - Elementary 2009 2010 2011 2012 2013 2014 AYP Status By Subject for District as a Whole and for Grade Level
Carson City 63.85% District Yes - Elementary English/Language Arts No
Churchill 66.05% District No - Elementary English/Language Arts No
Clark 57.19% District No - Elementary English/Language Arts No
Douglas 75.28% District Yes - Elementary English/Language Arts Yes
Elko 61.13% District No - Elementary English/Language Arts No
Esmeralda - Report Not Available
Eureka 76.56% District Yes - Elementary English/Language Arts Yes
Humboldt 63.13% Progress To Be Determined District Yes - Elementary English/Language Arts Yes
Lander 74.53% By Testing in Future Years District Yes - Elementary English/Language Arts No
Lincoln 65.01% District Yes - Elementary English/Language Arts No
Lyon 65.18% District Yes - Elementary English/Language Arts Yes
Mineral 55.13% District Yes - Elementary English/Language Arts No
Nye 56.79% District No - Elementary English/Language Arts No
Pershing 53.42% District Yes - Elementary English/Language Arts No
Storey 58.71% District Yes - Elementary English/Language Arts Yes
Washoe 61.42% District No - Elementary English/Language Arts No
White Pine 45.39% District Yes - Elementary English/Language Arts No
Target Percentage of Students 54.60% 65.90% 65.90% 77.20% 88.50% 100.00%
Math - Elementary 2009 2010 2011 2012 2013 2014 AYP Status By Subject for District as a Whole and for Grade Level
Carson City 66.92% District Yes - Elementary Math No
Churchill 68.23% District Yes - Elementary Math No
Clark 62.99% District No - Elementary Math No
Douglas 72.54% District Yes - Elementary Math Yes
Elko 60.19% District No - Elementary Math No
Esmeralda - Report Not Available
Eureka 84.38% District Yes - Elementary Math Yes
Humboldt 69.00% Progress To Be Determined District Yes - Elementary Math No
Lander 73.56% By Testing in Future Years District Yes - Elementary Math No
Lincoln 67.33% District Yes - Elementary Math Yes
Lyon 65.53% District No - Elementary Math No
Mineral 51.36% District Yes - Elementary Math No
Nye 57.36% District Yes - Elementary Math No
Pershing 58.17% District Yes - Elementary Math No
Storey 72.73% District Yes - Elementary Math Yes
Washoe 65.93% District No - Elementary Math No
White Pine 44.15% District Yes - Elementary Math No
18. Appendix 2B – No Child Left Behind School Year 2008-2009
Source: Clark County School District Division of Assessment, Accountability, Research, and School Improvement.
Target and Actual Percentages of Students Meeting or Exceeding Standards
By Year and Subject for Each Nevada School District - All Students Tested Districts Not Meeting AYP in One Subject - English or Math
Middle Schools Districts Not Meeting AYP in Both English and Math
Target Percentage of Students 51.70% 63.80% 63.80% 75.90% 88.00% 100.00%
English/Language Arts- Middle School 2009 2010 2011 2012 2013 2014 AYP Status By Subject for District as a Whole and for Grade Level
Carson City 67.44% District Yes - Middle School English/ Language Arts No
Churchill 71.45% District No - Middle School English/ Language Arts No
Clark 62.71% District No - Middle School English/ Language Arts No
Douglas 79.94% District Yes - Middle School English/ Language Arts Yes
Elko 65.00% District No - Middle School English/ Language Arts No
Esmeralda - Report Not Available
Eureka 61.54% District Yes - Middle School English/ Language Arts Yes
Humboldt 64.54% Progress To Be Determined District Yes - Middle School English/ Language Arts No
Lander 65.54% By Testing in Future Years District Yes - Middle School English/ Language Arts Yes
Lincoln 71.64% District Yes - Middle School English/ Language Arts Yes
Lyon 68.78% District Yes - Middle School English/ Language Arts No
Mineral N/A District Yes - Middle School English/ Language Arts Yes
Nye 68.01% District No - Middle School English/ Language Arts No
Pershing 54.36% District Yes - Middle School English/ Language Arts Yes
Storey 75.12% District Yes - Middle School English/ Language Arts Yes
Washoe 66.44% District No - Middle School English/ Language Arts No
White Pine 65.56% District Yes - Middle School English/ Language Arts Yes
Target Percentage of Students 54.60% 65.90% 65.90% 77.20% 88.50% 100.00%
Math - Middle School 2009 2010 2011 2012 2013 2014 AYP Status By Subject for District as a Whole and for Grade Level
Carson City 63.29% District Yes - Middle School Math No
Churchill 61.54% District Yes - Middle School Math No
Clark 60.98% District No - Middle School Math No
Douglas 77.35% District Yes - Middle School Math Yes
Elko 62.72% District No - Middle School Math No
Esmeralda - Report Not Available
Eureka 70.97% District Yes - Middle School Math Yes
Humboldt 58.62% Progress To Be Determined District Yes - Middle School Math No
Lander 57.96% By Testing in Future Years District Yes - Middle School Math Yes
Lincoln 68.94% District Yes - Middle School Math Yes
Lyon 63.41% District No - Middle School Math No
Mineral N/A District Yes - Middle School Math Yes
Nye 65.01% District Yes - Middle School Math Yes
Pershing 57.68% District Yes - Middle School Math Yes
Storey 68.69% District Yes - Middle School Math Yes
Washoe 65.86% District No - Middle School Math No
White Pine 56.05% District Yes - Middle School Math Yes
19. Appendix 2C – No Child Left Behind School Year 2008-2009
Source: Clark County School District Division of Assessment, Accountability, Research, and School Improvement.
Target and Actual Percentages of Students Meeting or Exceeding Standards
By Year and Subject for Each Nevada School District - All Students Tested
High Schools Districts Not Meeting AYP in One Subject - English or Math
Districts Not Meeting AYP in Both English and Math
Target Percentage of Students 82.30% 86.70% 86.70% 91.10% 95.50% 100.00%
English/Language Arts- High School 2009 2010 2011 2012 2013 2014 AYP Status By Subject for District as a Whole and for Grade Level
Carson City 91.76% District Yes - High School English/Language Arts Yes
Churchill 90.94% District No - High School English/Language Arts No
Clark 89.52% District No - High School English/Language Arts No
Douglas 94.32% District Yes - High School English/Language Arts Yes
Elko 90.94% District No - High School English/Language Arts No
Esmeralda - Report Not Available
Eureka 92.31% District Yes - High School English/Language Arts Yes
Humboldt 92.25% Progress To Be Determined District Yes - High School English/Language Arts Yes
Lander 89.90% By Testing in Future Years District Yes - High School English/Language Arts Yes
Lincoln 84.94% District Yes - High School English/Language Arts No
Lyon 89.12% District No - High School English/Language Arts No
Mineral 88.71% District Yes - High School English/Language Arts Yes
Nye 89.79% District No - High School English/Language Arts No
Pershing 92.11% District Yes - High School English/Language Arts Yes
Storey 95.95% District Yes - High School English/Language Arts Yes
Washoe 90.97% District No - High School English/Language Arts No
White Pine 85.35% District Yes - High School English/Language Arts Yes
Target Percentage of Students 61.80% 71.30% 71.30% 80.80% 90.30% 100.00%
Math - High School 2009 2010 2011 2012 2013 2014 AYP Status By Subject for District as a Whole and for Grade Level
Carson City 80.49% District Yes - High School Math Yes
Churchill 82.58% District Yes - High School Math Yes
Clark 69.64% District No - High School Math No
Douglas 80.28% District Yes - High School Math No
Elko 72.97% District No - High School Math No
Esmeralda - Report Not Available
Eureka 84.62% District Yes - High School Math Yes
Humboldt 69.50% Progress To Be Determined District Yes - High School Math Yes
Lander 69.70% By Testing in Future Years District Yes - High School Math Yes
Lincoln 63.86% District Yes - High School Math No
Lyon 71.29% District No - High School Math No
Mineral 51.61% District Yes - High School Math Yes
Nye 64.40% District Yes - High School Math No
Pershing 78.95% District Yes - High School Math Yes
Storey 75.68% District Yes - High School Math Yes
Washoe 75.47% District No - High School Math No
White Pine 70.71% District Yes - High School Math Yes
20. Appendix 3 – National Assessment of Educational Progress (NAEP)
1
Source: U.S. Department of Education, Institute of Education Sciences, National Center for Education Statistics, National Assessment of
Educational Progress (NAEP), 2009 Mathematics Assessment. Includes District of Columbia and Department of Defense Schools.
Average Math and Reading Scale Scores 2009
Grade 4, By State 1
State
Math
Scores
Math
Rank State
Reading
Scores
Reading
Rank
United States 239.09 United States 219.60
Massachusetts 252.25 1 Massachusetts 233.75 1
New Hampshire 251.07 2 New Jersey 229.39 2
Minnesota 249.46 3 New Hampshire 229.14 3
Vermont 247.77 4 Connecticut 228.97 4
New Jersey 246.53 5 Vermont 228.74 5
Kansas 245.31 6 DoDEA 228.32 6
North Dakota 245.19 7 Virginia 226.53 7
Connecticut 244.72 8 Maryland 226.05 8
Maine 244.46 9 North Dakota 225.97 9
Montana 244.40 10 Colorado 225.70 10
Maryland 243.80 11 Florida 225.67 11
North Carolina 243.78 12 Kentucky 225.61 12
Ohio 243.69 13 Delaware 225.51 13
Pennsylvania 243.59 14 Montana 224.65 14
Wisconsin 243.59 15 Ohio 224.53 15
Colorado 243.13 16 New York 224.37 16
Virginia 243.07 17 Kansas 223.92 17
Indiana 242.62 18 Missouri 223.84 18
Iowa 242.60 19 Maine 223.79 19
Washington 242.26 20 Pennsylvania 223.68 20
South Dakota 242.10 21 Minnesota 223.34 21
Wyoming 242.01 22 Rhode Island 222.70 22
Florida 241.94 23 Indiana 222.66 23
Idaho 241.04 24 Wyoming 222.65 24
Missouri 240.68 25 Nebraska 222.52 25
New York 240.64 26 South Dakota 222.17 26
Texas 240.46 27 Iowa 221.42 27
Utah 240.32 28 Washington 221.33 28
DoDEA 240.29 29 Idaho 221.02 29
Delaware 239.49 30 Wisconsin 220.14 30
Kentucky 238.84 31 North Carolina 219.30 31
Rhode Island 238.77 32 Utah 219.20 32
Nebraska 238.75 33 Illinois 219.17 33
Illinois 238.29 34 Texas 218.86 34
Oregon 238.03 35 Michigan 218.24 35
Arkansas 237.54 36 Oregon 218.14 36
Alaska 237.21 37 Georgia 217.85 37
Oklahoma 236.78 38 Oklahoma 217.19 38
Michigan 236.28 39 Tennessee 216.74 39
Georgia 236.03 40 Alabama 216.27 40
Hawaii 235.68 41 Arkansas 216.15 41
South Carolina 235.67 42 South Carolina 215.94 42
Nevada 235.15 43 West Virginia 214.52 43
West Virginia 232.98 44 Nevada 211.14 44
Tennessee 231.83 45 Alaska 211.13 45
California 231.67 46 Hawaii 210.62 46
New Mexico 230.03 47 Mississippi 210.51 47
Arizona 229.99 48 Arizona 209.99 48
Louisiana 229.43 49 California 209.76 49
Alabama 227.96 50 New Mexico 207.65 50
Mississippi 227.26 51 Louisiana 207.49 51
District of Columbia 219.26 52 District of Columbia 201.98 52
21. Appendix 3 – National Assessment of Educational Progress (NAEP) Continued
1
Source: U.S. Department of Education, Institute of Education Sciences, National Center for Education Statistics, National Assessment of
Educational Progress (NAEP), 2009 Mathematics Assessment. Includes District of Columbia and Department of Defense Schools.
Average Math and Reading Scale Scores 2009
Grade 8, By State 1
State
Math
Scores
Math
Rank State
Reading
Scores
Reading
Rank
United States 281.67 United States 262.29
Massachusetts 298.85 1 Massachusetts 273.59 1
Minnesota 294.44 2 New Jersey 272.80 2
Vermont 292.87 3 DoDEA 272.46 3
North Dakota 292.84 4 Vermont 272.31 4
New Jersey 292.66 5 Connecticut 271.81 5
New Hampshire 292.32 6 New Hampshire 270.75 6
Montana 291.54 7 Pennsylvania 270.70 7
South Dakota 290.62 8 Montana 270.39 8
Washington 288.72 9 South Dakota 270.06 9
Connecticut 288.61 10 Minnesota 269.74 10
Kansas 288.60 11 North Dakota 269.24 11
Maryland 288.34 12 Ohio 268.68 12
Pennsylvania 288.30 13 Wyoming 268.16 13
Wisconsin 288.14 14 Maine 267.71 14
Colorado 287.37 15 Maryland 267.30 15
Idaho 287.31 16 Nebraska 267.07 16
DoDEA 287.15 17 Washington 266.92 17
Indiana 286.81 18 Missouri 266.88 18
Texas 286.69 19 Kentucky 266.85 19
Maine 286.36 20 Kansas 266.80 20
Wyoming 286.10 21 Wisconsin 265.81 21
Virginia 286.07 22 Indiana 265.69 22
Missouri 285.81 23 Virginia 265.64 23
Ohio 285.58 24 Utah 265.59 24
Oregon 285.04 25 Colorado 265.51 25
North Carolina 284.33 26 Oregon 265.09 26
Nebraska 284.26 27 Delaware 265.00 27
Iowa 284.17 28 Iowa 264.89 28
Utah 284.07 29 Idaho 264.84 29
Delaware 283.83 30 Illinois 264.51 30
Alaska 283.05 31 Florida 264.36 31
New York 282.58 32 New York 264.29 32
Illinois 282.43 33 Michigan 261.90 33
South Carolina 280.38 34 Tennessee 260.95 34
Florida 279.34 35 Texas 260.37 35
Kentucky 279.28 36 Georgia 260.24 36
Michigan 278.27 37 Rhode Island 259.89 37
Rhode Island 277.92 38 North Carolina 259.53 38
Georgia 277.56 39 Oklahoma 259.50 39
Arizona 277.33 40 Alaska 259.45 40
Arkansas 276.00 41 Arkansas 258.05 41
Oklahoma 275.71 42 Arizona 257.60 42
Tennessee 274.76 43 South Carolina 257.27 43
Nevada 274.15 44 Alabama 254.90 44
Hawaii 273.76 45 West Virginia 254.80 45
Louisiana 272.38 46 Hawaii 254.74 46
California 270.45 47 New Mexico 254.13 47
West Virginia 270.42 48 Nevada 253.84 48
New Mexico 269.70 49 Louisiana 253.33 49
Alabama 268.52 50 California 252.63 50
Mississippi 265.00 51 Mississippi 251.31 51
District of Columbia 253.60 52 District of Columbia 242.49 52