Challenges to Adapt BMPs to Reduce Nitrate Leaching
•Download as PPTX, PDF•
0 likes•147 views

72nd SWCS International Annual Conference July 30-August 2, 2017 Madison, WI

Recommended
Recommended
More Related Content
What's hot
What's hot (6)
Similar to Challenges to Adapt BMPs to Reduce Nitrate Leaching
Similar to Challenges to Adapt BMPs to Reduce Nitrate Leaching (20)
More from Soil and Water Conservation Society
More from Soil and Water Conservation Society (20)
Recently uploaded
Recently uploaded (20)
Challenges to Adapt BMPs to Reduce Nitrate Leaching
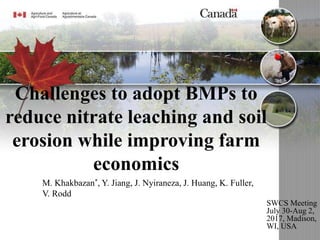
- 1. Challenges to adopt BMPs to reduce nitrate leaching and soil erosion while improving farm economics SWCS Meeting July 30-Aug 2, 2017, Madison, WI, USA M. Khakbazan*, Y. Jiang, J. Nyiraneza, J. Huang, K. Fuller, V. Rodd
- 2. Problem • Conventional potato production contributes little crop residue to the soil and involves significant tillage operations and chemical inputs which may result in leaching or/and runoff of excess nutrients and degradation of soil resources, including reduced top soil and diminished soil organic matter. • Conventional potato production has relied on high levels of soil disturbance (e.g. fall moldboard ploughing) in the fall which leaves the soil surface exposed to erosion until spring, and then multiple tillage passes in the spring to prepare the seedbed.
- 3. Potato production in Canada • Potato farm cash receipts is 1.1B in Canada • PEI (89,000 ac) Manitoba (64,500 ac), Alberta (52,300 ac), New Brunswick (46,000 ha) Changes in average yield (Cwt per acre) of potatoes in AB, MB, PEI, and NB from 1992-2016. y = 1.4171x + 254.16 R² = 0.1661 y = 1.8238x + 246.9 R² = 0.3594 y = 3.9152x + 208.1 R² = 0.586 y = 4.6018x + 258.65 R² = 0.788 0 50 100 150 200 250 300 350 400 450 CwtperAcre Year Prince Edward Island New Brunswick Manitoba Alberta Linear (Prince Edward Island) Linear (New Brunswick) Linear (Manitoba) Linear (Alberta)
- 4. Objective • The overall objective of this study was to determine if delaying fall ploughing to spring in forage phase of a potato rotation is a viable practice for potato growers in PEI. Specific objective was to evaluate the effect of this practice on economic returns and risk of returns trade-offs for potato producers.
- 5. Methodology • Three experimental studies were initiated between 2010- 2017. • To evaluate the potential impacts of postponing the ploughing of the forage in a barley–forage (mix of red clover and timothy)–potato rotation from fall to spring on reducing nitrate leaching and soil erosion and improving farm economics. 1. Harrington #1: two plowing time (fall and Spring) at 0, 60, 120, 180, 240 kg N ha-1 with three replicates 2. Harrington #2 three plowing temperature based (Early Fall, Late Fall, Spring) at 0 and 100 kg N ha-1 with three replicates 3. Souris: three sites on potato growers fields.
- 6. Methodology • A combination of budgeting techniques and economic modelling based on returns and risk of returns trade-offs was used to determine the profitability of Fall tillage or delay it until Spring
- 7. Fall Ploughing Pros ● Better distribution of labour (provides more time for other tasks during the following spring) ● Improved soil tilth, reduced soil lumps, and decreased soil compaction ● Uniform seedbed and seeding operations ● Reduced insects and diseases hazards ● Removal of weeds and volunteer crops ● Replenishment of available plant nutrients and water in the soil ● The land warms earlier and dry earlier during the following spring Cons ● Wind erosion and water erosion (8 Mg/ha/yr) ● 0.5 to 1 Mg/ha/yr yield loss due to erosion ● Elevated fall N mineralization and nitrate concentrations, and increased losses of nitrate N ● Leaching of about 16 kg N/ha/yr
- 8. Spring Ploughing Pros ● Retention of plant residue soil cover and reduced soil degradation ● Higher soil water content in the early growing season ● Reduced forage-phase nitrate leaching loss by 20 to 61% Cons ● Substantial growth of weeds and volunteer plants ● Increased insects or diseases harbouring with higher level of crop residue ● Wet and slow-to-warm soil conditions in spring resulting in planting delays ● Increased large clods, lumps, soil compaction and increased plant debris at harvest ● Poor seedbed preparation and harvest difficulties ● Under-decomposed organic residues ● Additional labour and time constraints during the spring seeding period with its unpredictable weather
- 9. Literature Review for Fall vs. Spring Ploughing Potato Yield Impacts Fall ploughing Spring ploughing Reference ● Similar yield and quality Carter et al. 1998, 2005, 2010 Carter and Sanderson 2001 Holmstrom et al. 2006 Lynch et al. 2008 ● Reduced yield by 12% Griffin et al. 2009 ● With spring moldboard ploughing of red clover, higher yields at low N rates and lower yields at high N rates Sanderson et al. 1999 ● 0.41 Mg/ha/yr yield loss due to erosion ● Increased yield by 4.5 Mg/ha ● Increased yield by 0.5 Mg/ha Dehaan et al. 1999 Ochuodho et al. 2013
- 10. Experimental Results Effect Mkt Yield (t ha-1 ) Net Revenue ($ ha-1 ) Harrington #1 0N F 39.97 3305 0N S 35.97 2393 Diff 4.00 912 60N F 34.71 2035 60N S 27.69 434 Diff 7.02 1600 120N F 36.31 2327 120N S 36.82 2443 Diff -0.51 -115 180N F 27.75 302 180N S 26.32 -23 Diff 1.43 325 240N F 30.27 805 240N S 26.81 17 Diff 3.46 788 Pr > F NS NS Harrington #2 0N E Fall 27.35 428.5 0N L Fall 30.03 1038.7 0N Spring 29.04 813.0 Diff 2.68 610.0 100N E Fall 36.05 2291.1 100N L Fall 34.60 1960.1 100N Spring 35.44 2153.1 Diff 1.45 331.0 Pr > F NS NS
- 11. Experimental Results Effect Rep Mkt Yield (t ha-1) Net Revenue ($ ha-1) Souris Site-Year F 1-2015 35.36 2038 F 2-2014 30.13 846 F 3-2014 25.84 -133 Mean 30.44 917 S 1-2015 33.66 1651 S 2-2014 32.05 1284 S 3-2014 28.82 547 Mean 31.51 1160 Pr > F NS NS Diff -1.07 -243
- 12. Experimental Results – Combined Effect Mkt Yield (t ha-1) Fall NR($ ha-1) Effect Mkt Yield (t ha-1) Spring NR($ ha-1) Yield Diff NR Diff($ ha-1) F 35.36 2038.3S 33.66 1650.7 1.70 387.6 F 30.13 845.8S 32.05 1283.6 -1.92 -437.8 F 25.84 -132.3S 28.82 547.2 -2.98 -679.4 0N F 31.76 1433.50N S 40.74 3480.0 -8.98 -2046.5 0N F 47.32 4981.40N S 28.03 583.7 19.29 4397.7 0N F 40.82 3499.60N S 39.14 3115.4 1.69 384.2 60N F 42.36 3778.760N S 29.79 911.6 12.58 2867.1 60N F 26.37 131.660N S 26.21 95.4 0.16 36.3 60N F 35.42 2194.860N S 27.09 295.8 8.33 1899.0 120N F 37.52 2602.5120N S 41.99 3622.6 -4.47 -1020.1 120N F 36.80 2439.5120N S 39.74 3108.0 -2.93 -668.5 120N F 34.61 1940.2120N S 28.72 597.3 5.89 1342.9 180N F 34.41 1820.8180N S 23.84 -587.8 10.56 2408.6 180N F 33.08 1517.8180N S 18.90 -1713.7 14.17 3231.4 180N F 15.75 -2431.9180N S 36.21 2232.8 -20.46 -4664.7 240N F 26.16 -130.6240N S 32.47 1306.2 -6.30 -1436.9 240N F 31.83 1161.9240N S 28.92 498.4 2.91 663.5 240N F 32.81 1384.2240N S 19.04 -1754.7 13.77 3138.9 0N F 23.94 -349.50N S 24.02 -332.0 -0.08 -17.5 0N F 28.31 647.50N S 30.95 1248.5 -2.64 -601.0 0N F 33.82 1902.80N S 32.15 1522.6 1.67 380.2 100N F 36.03 2286.4100N S 34.05 1836.2 1.97 450.2 100N F 34.85 2017.7100N S 37.08 2526.7 -2.23 -509.0 100N F 35.09 2072.7100N S 35.19 2096.3 -0.10 -23.6 Mean 32.93 1568.9 31.20 1173.8 1.73 395.1
- 13. Simulation notes Note A: Tillage cost range from $118 to $174 ha-1 for mouldboard plus disc followed by two passes of harrows. Note B: For delayed tillage to spring we added 15% to this range. Note C: We added extra total yield loss for weed/insects/diseases (1%) and soil clods and debris (2%) for S tillage at harvest Note D: We added reduction of yield of zero to 3.36% due to soil erosion of 8 Mg ha-1 year-1 for F tillage (0.42% yield loss per Mg soil erosion) Note E: Zero to 32 kg ha-1 year-1 N loss due to leaching (average 16 kg ha-1 year-1 ) from autumn ploughed plots for F tillage (16 kg times $1.2 /kg = $19.2) Note F: Opportunity costs of delayed seeding for S tillage were simulated at 0%, 2%, 4%, 6% based on crop insurance data in Manitoba
- 16. Simulation Results (N = 500 in each site) 0 0.05 0.1 0.15 0.2 0.25 0.3 -2901.01 -1714.34 -527.66 659.01 1845.69 3032.36 4219.04 Fall NI 0 0.02 0.04 0.06 0.08 0.1 0.12 0.14 0.16 0.18 -2117.17 -1256.59 -396.00 464.58 1325.17 2185.75 3046.33 Spring NI
- 17. Risk Premium: How much ($ ha-1 year-1) you will be required, or willing to be given up, relative to a baseline, to be indifferent between Fall tillage or delay it until Spring?
- 18. Souris Absolute risk averse coefficient (ARAC) 0.000 0.001 0.002 0.003 0.004 0.005 Riskpremium($ha-1) -200 0 200 400 600 800 Fall moldboard plowing Spring moldboard plowing Spring moldboard plowing, assumed 2% yield reduced Spring moldboard plowing, assumed 4% yield reduced Spring moldboard plowing, assumed 6% yield reduced
- 19. Harrington #1 Absolute risk averse coefficient (ARAC) 0.000 0.001 0.002 0.003 0.004 Riskpremium($ha -1 ) -1200 -1000 -800 -600 -400 -200 0 200 400 Fall moldboard plowing Spring moldboard plowing Spring moldboard plowing, assumed 2% yield reduced Spring moldboard plowing, assumed 4% yield reduced Spring moldboard plowing, assumed 6% yield reduced
- 20. Harrington #2 Absolute risk averse coefficient (ARAC) 0.0000 0.0005 0.0010 0.0015 0.0020 0.0025 0.0030 0.0035 Riskpremium($ha -1 ) -1000 -800 -600 -400 -200 0 200 Later fall moldboard plowing Early fall moldboard plowing Spring moldboard plowing Spring moldboard plowing, assumed 2% yield reduced Spring moldboard plowing, assumed 4% yield reduced Spring moldboard plowing, assumed 6% yield reduced
- 21. Souris, Harrington #1 & Harrington #2 combined Absolute risk averse coefficient (ARAC) 0.000 0.001 0.002 0.003 0.004 Riskpremium($ha -1 ) -1000 -800 -600 -400 -200 0 200 400 600 Fall moldboard plowing Spring moldboard plowing Spring moldboard plowing, assumed 2% yield reduced Spring moldboard plowing, assumed 4% yield reduced Spring moldboard plowing, assumed 6% yield reduced
- 22. Question: How much ($ ha-1 year-1) you will be required, or willing to be given up, to be indifferent between Fall tillage or delay it until Spring? Small PEI potato growers (7) were surveyed and they all indicated they will be required, on average, $617 ha-1 year-1 to be indifferent between Fall tillage or delay it until Spring?
Editor's Notes
- 2016a - Table 002-0001: Farm cash receipts, annual 2016b - Table 001-0014 - Area, production and farm value of potatoes, annual