Downloaded 28 times


![2 Prabhat Kumar
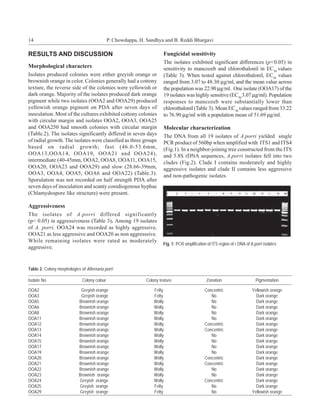
To overcome negative externalities and improve quality, a MATERIALS AND METHODS
number of efforts to promote plant-based, microbial based
and other strategies have been developed (Kumar et al., Location
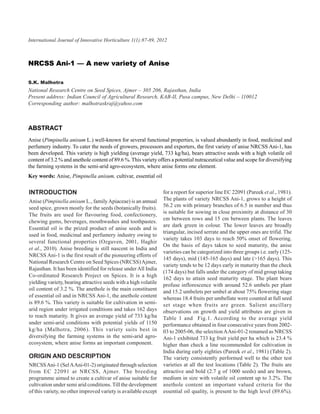
2005; Kumar and Poehling, 2007) but only with limited Experiments were conducted on tomato plants
and sporadic success (Lewis, 1997). Further, the challenges (Lycopersicon esculentum Mill; family Solanaceae; cv. King
of brining ‘system perspective of sustainable pest Kong II) at the greenhouse complex provided for the AIT-
management’ remains an allusive dream due to ‘linearity’ Hanover Project, Asian Institute of Technology, Bangkok,
in planning pest management. Few attempts have been made Thailand.
till-date to manipulate the basic behavior of the insects that
have the strong potential to be part of developing a system- Nets and plastics
based pest management approach. Two nets UV-blocking, Bionet® and non UV-blocking (=
Many herbivorous insects studied have two or three types UV transmitting), Anti Insect® nets (50 mesh: Polysack
of photosensitive receptor cells in their compound eyes; Plastic Industries, Israel) along with two plastics, UV-
hence they show a di- or tri-chromatic system able to blocking (Sun Selector Diffused Antivirus®, Ginegar Plastic
differentiate not only brightness but colors by interpolating Product Ltd, Kibbutz, Israel) and UV-transmitting (= non
the different stimuli from the multiple receptor system for blocking) plastic film, PE-1A (RKW AG, Germany) were
aphid vision (Döring and Chittka, 2007). However, used in the experiments (for spectral transmission,
sensitivity maxima are quite different from vertebrates. Most Fig. 1).
insects react especially to wavelength between 500 and 600
nm (green), around 450 nm (blue) and 350 – 380 nm (UV
Treatments and greenhouses
A). The function of UV sensitivity is only partly explained These two nets (UV-blocking and UV non-blocking) and
today. It is known that UV reception is used for inducing plastics (UV blocking and non-blocking) were permutated
flight activity (“take-off”), spatial orientation during in 4 different combinations: UV Blocking nets + UV
distance flights (e.g. whiteflies, thrips, aphids) as well as Blocking Plastics [henceforth referred as B (N+P)]; Non
location of specific targets that intensively reflect light in UV-blocking net + UV blocking plastic [NB-N+BP)]; UV
the UV range, such as specific structures in flowers offering blocking nets + UN non-blocking Plastics [BN+N-BP)];
high quality nutrition (e.g. bees, bumble bees) and it is UV Non-blocking nets + UV non-blocking plastic [NB
important for color differentiation (Kring and Schuster (N+P)]. A total of eight greenhouses (GH) (7.5 m × 2 m ×
1992; Goldsmith, 1993; Costa and Robb, 1999; Raviv and 2 m) were constructed with four GH each placed in identical
Antignus, 2004; Döring and Chittka, 2007; Diaz and orientations (either east/west or north/south direction) to
Fereres, 2007). avoid any effect of orientation. Furthermore, each
greenhouse was provided with two identical doors at the
Aim of protected cultivation is not only to allow length side. The front and rear end of the door walls were
production even under worse climatic conditions (e.g. covered with identical nets used for the side walls of each
heavy rainfalls) but to reduce the dependence of frequent greenhouse. The side-walls of the greenhouses were always
pesticide use with all its severe drawbacks (e.g. residues, covered with either of the nets and the roofs with either of
resistance). However, the use of screens as a physical the plastics. Between GH, 1.5 meter space reduced shading
control has limitations particularly with small insects since from each other. The area around the GH complex was
too small mesh sizes of nets or complete cover with cleaned and all weed plants were removed prior to each
plastics reduces the efficiency of natural ventilation which series of experiments. Between each series, greenhouses
is a prerequisite for greenhouses without expensive were thoroughly washed and cleaned approximately one
cooling devices. Materials hindering immigration and week prior to new experiments. A total of three experimental
being enough air transmissible are desired and UV- series of five weeks duration were carried out and each
blocking materials may be a further milestone in such a experiment was repeated once over the time. A total of 30
development. Therefore, we undertook this study with potted (25 cm high and 27 cm) tomato plants (2 weeks old)
different combined UV-blocking and UV-transmissible were transplanted in a local media in each greenhouse (pH-
roof and wall materials in small experimental greenhouses 5.3; organic matter – 28%; sand – 30%; silt – 39%; clay –
to study the immigration pattern of one of the major tomato 31%; total N – 0.4% ; K – 0.65%; P – 0.18%; Ca – 0.08%).
pest ie, thrips and related virus incidences in the humid Tomato seedlings were grown in an insect-free evapo-
tropics to explore the possibilities of designing a chemical cooled nursery. Radiation triggered and scheduled drip
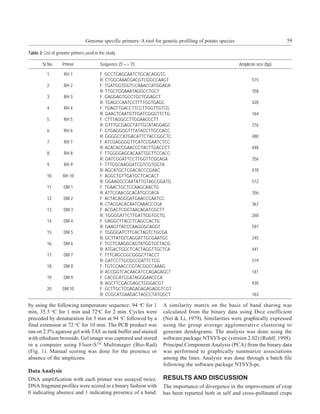
free high quality vegetable production system. irrigation combined with dosatron fertigation was provided](https://image.slidesharecdn.com/chaijournal-ijihvol1no-1-121229075949-phpapp01/85/Chai-journal-_ijih__vol1__no-1-6-320.jpg)
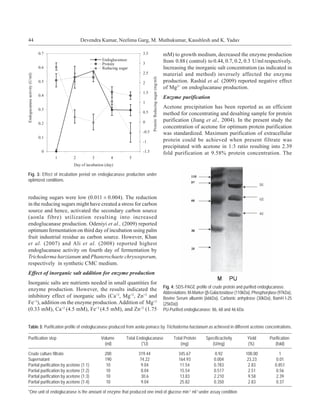
![4 Prabhat Kumar
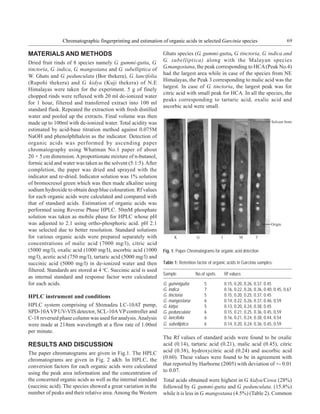
time (Cohen and Melamed-Madjar, 1978). The immigrating were transformed by square-root transformation before
thrips population were measured by blue sticky traps (BST) running an ANOVA followed by mean separation using
(25 × 15 cm) positioned half at the plant canopy and half Fisher’s LSD test (Steel and Torrie, 1980; Gomez and
above canopy. The BST were made from Blue PVC sheets Gomez, 1984). Data were then back transformed for
coated with insect-glue (Kosfix ®, Kosmix Polymer, presentation as Mean± SE. A significance level of µ = 0.05
Bangkok, Thailand) on both sides. A total of 6 BST were was used in for all analysis.
placed for each GH, changed two times a week and number
of thrips trapped at both side of the traps were counted. RESULTS AND DISCUSSION
Since each trap was considered as one replication total of
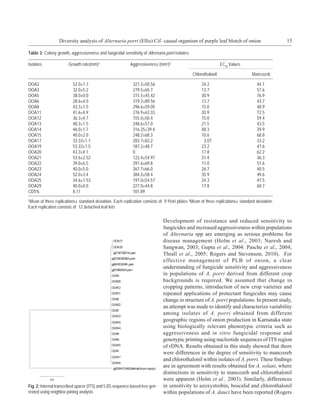
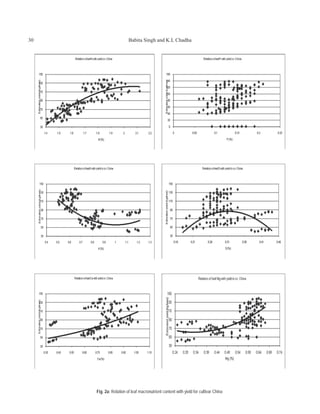
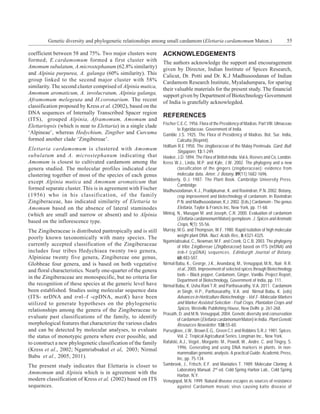
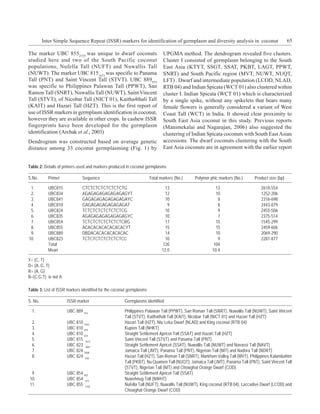
10 readings (sampling days) were collected on the Light Transmission and Temperature
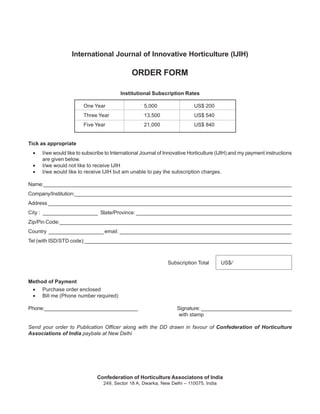
immigrating thrips inside each 8 GH during each of the No significant differences in temperatures or humidity
experiments. Additionally, two times a week number of inside the four greenhouses were found during either round
thrips infested leaves were counted from the non-virus of experiments. However, the UV light varies under each
infested plants until the fifth week. Two times a week, GH type either during sunny and cloudy days during each
number of virus infected tomato plants were counted and four experiments (Fig. 2). The UV levels drops to almost
marked and at the end of the experiments (43 days after half during cloudy days. During exp. 1 and 2, only 20% of
transplanting), DAS-ELISA tests were carried out to the days were cloudy whereas during experiment 3 and 4
distinguish between the tospovirus and other viruses e.g. over 40% days were cloudy.
TYLCV. Since the tospovirus was the most commonly
occurring one, the plants failed to test positive for the CaCV- Experiment 1 and 2. Partial Open gates (Partial
AIT infection but showing virus symptoms were assumed Ventilation)
to be infected with the TYCLV (referred as other viruses).
Thrips and leaf damage
Exp. 3 and 4. Effect of UV blocking nets and plastics Thrips, most abundantly recorded species during this
on the immigration and attraction of thrips and experiment and immigration of thrips followed similar
occurrence of tospoviruses (full ventilation with trends of entry into UV rich greenhouses over the ones
complete open doors) having low UV-intensity. The NB (N+P) GH attracted
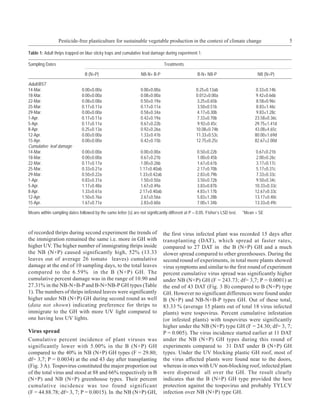
Two rounds of experiments were carried out in a similar significantly highest number of thrips over all other
greenhouse set-up as discussed above except that during greenhouses. Whereas, the B-N + NB-P and NB (N+P) GH
this round the two doors were kept open during the entire types had significantly different immigrating thrips for all
period of experiment. The number of thrips were counted sampling dates (Table 1). Even with a different total number
on the BST as per the procedure explained above. Similarly,
number of thrips infested leaves and virus infected plants
were counted, marked and at the end of experiment, tests
were carried out to distinguish between the tospoviruses
and other viruses. To investigate the abilities of thrips to
reach the experimental GH, two BST each was attached at
the outer walls (centrally placed) and traps were changed
twice a week followed by counting of thrips. The position
and orientation of the traps on all 4 GH types were same.
In this way, abilities of the thrips reaching GH were
determined.
Statistical Analyses
Adult whiteflies, thrips and aphids on traps, alate aphids
and whiteflies on leaves, number of thrips infested leaves,
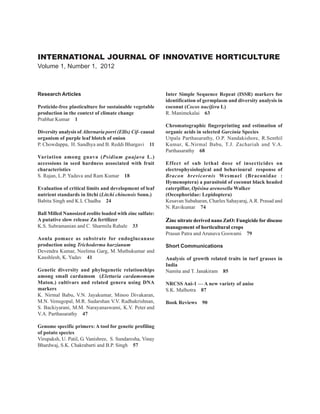
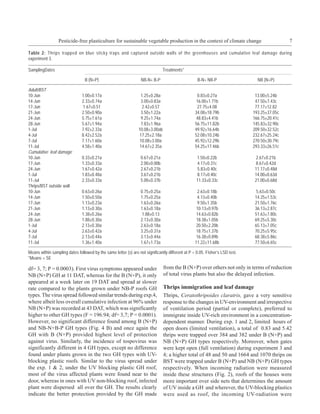
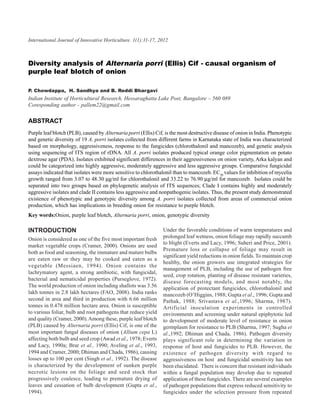
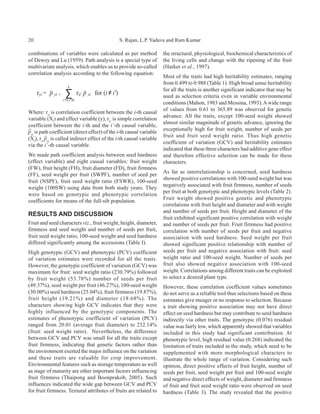
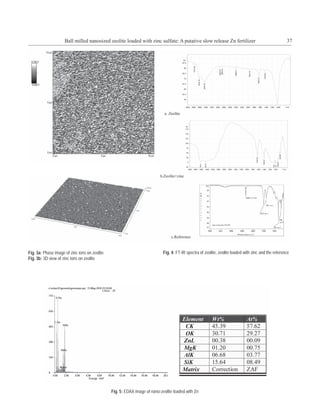
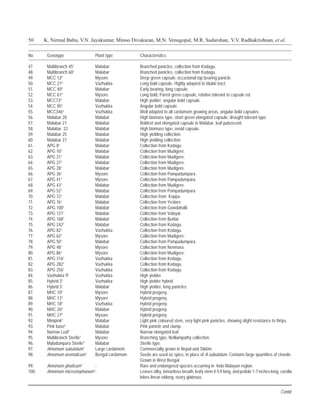
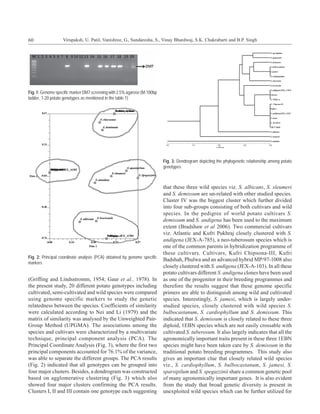
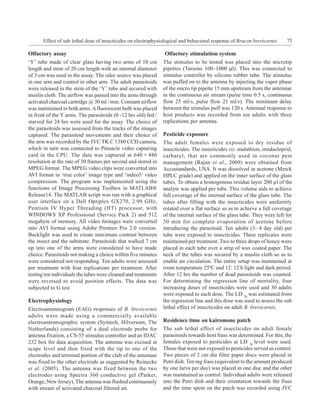
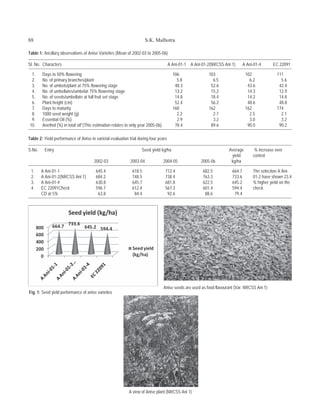
percentage of virus infected plants were subjected to Fig. 2: UV-A measurement (W/m2) under each four greenhouses, UV-block-
ing net sidewalls with UV-blocking plastic film as roof [ B (N+P)]; UV non-
HOVTEST = LEVENE option of SAS (SAS, 1999) to
blocking nets as sidewalls and UV non blocking plastic films as roof [NB
account for homogeneity of variance and normality. In case (N+P)]; UV-blocking nets as side walls and UV non blocking plastic films as
of non-homogeneity, percent values were transformed using roof [B-N+NB-P]; and, UV non blocking nets as side wall and UV-blocking
arcsine–square-root (arcsine√) transformation. Insects on plastics films as roof [NB-N+B=P] using Radiometer UV-Sensor (Dr. Grobel
traps and plants and number of infested leaves count values UV-Elektronik GmbH, Germany).](https://image.slidesharecdn.com/chaijournal-ijihvol1no-1-121229075949-phpapp01/85/Chai-journal-_ijih__vol1__no-1-8-320.jpg)
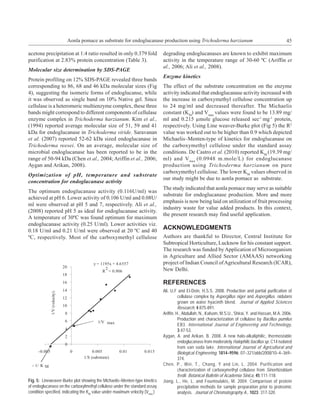
![6 Prabhat Kumar
found during experiment 4 for the immigrating thrips and
a higher number of thrips were attracted towards the GH
with high UV intensity.
Virus spread
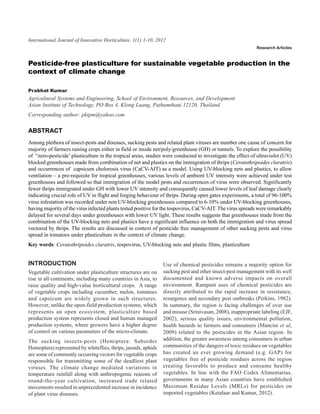
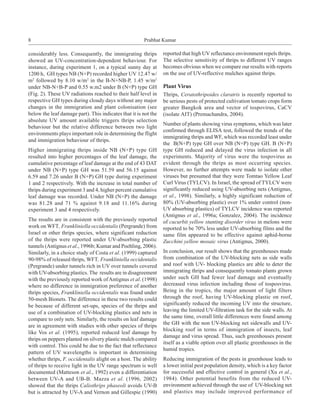
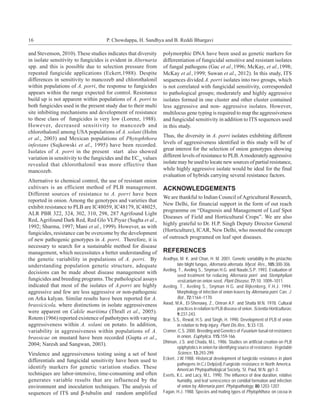
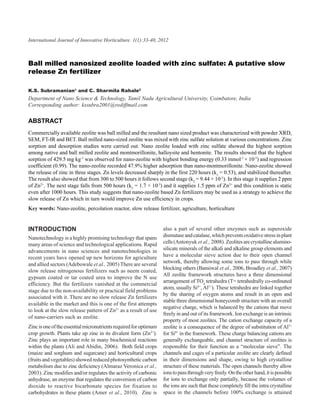
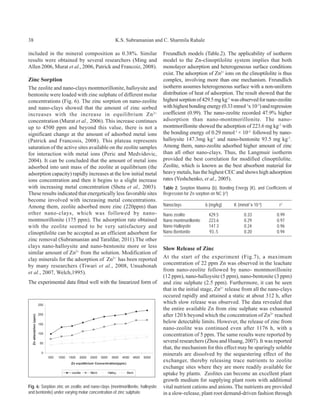
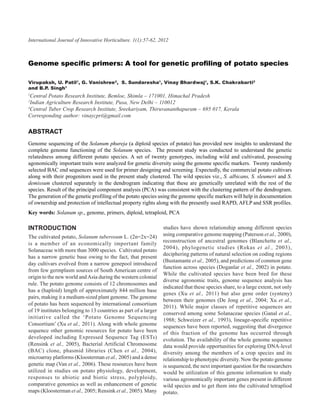
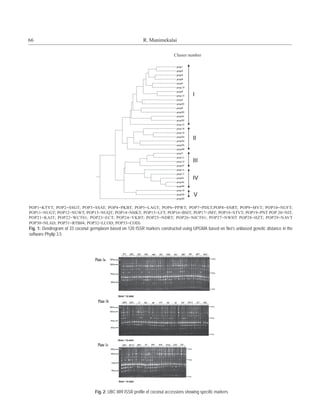
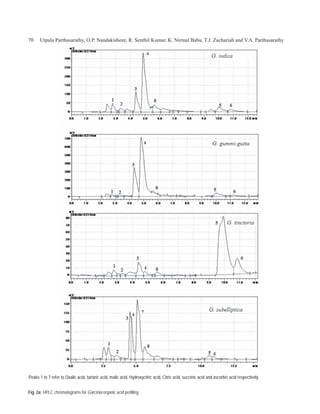
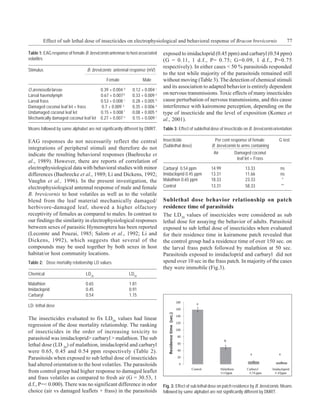
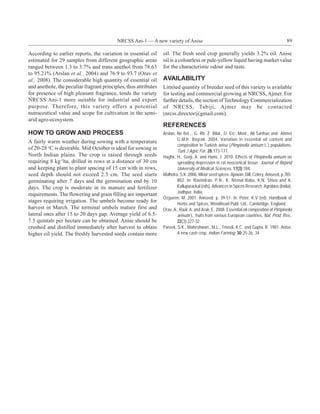
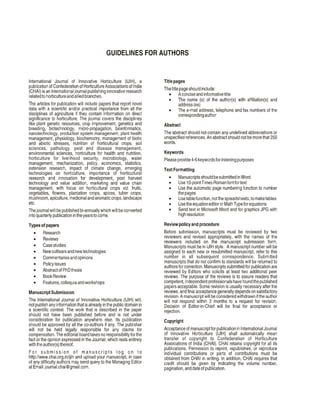
The high thrips population during exp. 3, resulted into 100%
virus infection by 43 DAT, which was significantly higher
compared to other GH type (F = 1588.25; df= 3,7; P =
0.0001). The B (N+P) provided significant protection
against viruses and only 10% plants found to have virus;
15% under NB-N+B-P and 51% plant under B-N+NB-P
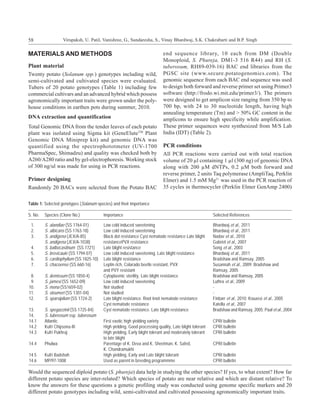
GH types (Fig. 4 A.) Out of these total virus infections,
over 75% tomato plants tested positive for tospovirus.
Tospovirus infection followed the similar trends and lowest
infection was recorded under B (N+P) GH type (F = 96.38;
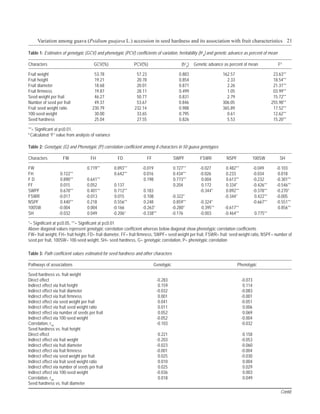
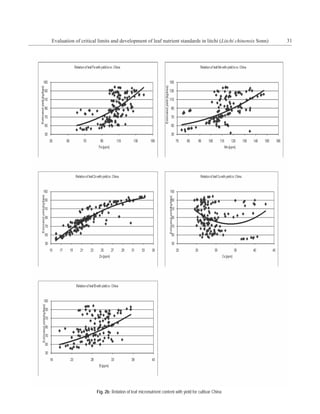
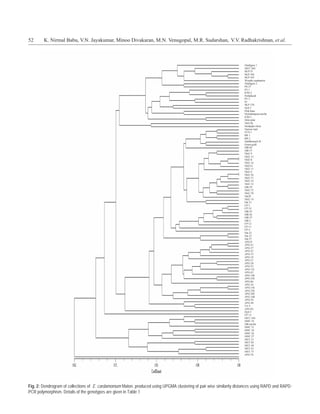
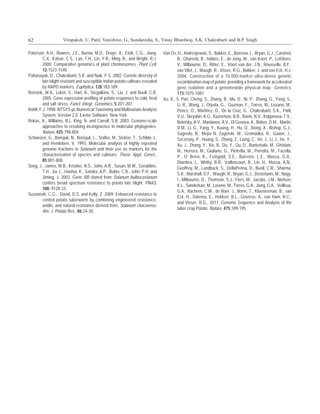
Fig. 3: Percent cumulative virus infected tomato plants under greenhouses,
UV-blocking net sidewalls with UV-blocking plastic film as roof [ B (N+P)]; UV
non-blocking nets as sidewalls and UV non blocking plastic films as roof [NB
(N+P)]; UV-blocking nets as side walls and UV non blocking plastic films as
roof [B-N+NB-P]; and, UV non blocking nets as side wall and UV-blocking
plastics films as roof [NB-N+B-P] during exp. 1 (A) and exp. 2 (B),when green-
house door open for 600-1000h. Cumulative percent at the 43 days after
transplanting sharing a common letter are not significantly different at P <0.05,
Fisher’s LSD.
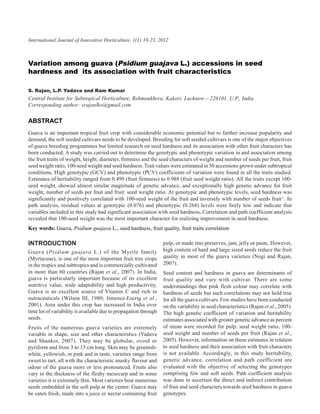
Experiment 3 and 4. Open doors (Complete
Ventilation)
Thrips and leaf damage
During exp.3, similar to the previously observed trends,
significantly higher number of thrips immigrated and
captured from the NB (N+P) GH followed by the B-N +
NB-P and others. Similar trends of higher leaf damage were
observed under NB (N+P) GH. No significant difference
was found for most sampling day between B (N+P) and
NB-N+B-P type GH (Table 2). Similar trends of thrips
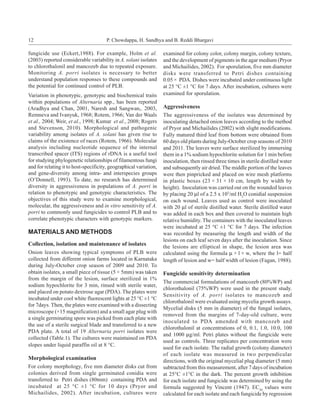
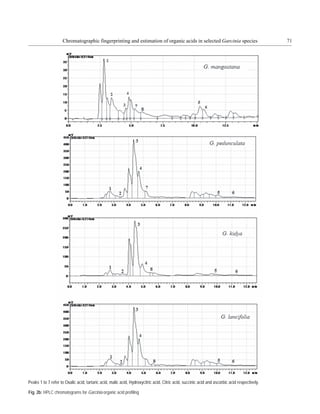
Fig. 4: Percent cumulative virus infected tomato plants under greenhouses
immigration and leaf damage with overall lower thrips (treatments), UV-blocking net sidewalls with UV-blocking plastic film as roof
population were observed during exp.4, a month later. [ B (N+P)]; UV non-blocking nets as sidewalls and UV non blocking plastic
films as roof [NB (N+P)]; UV-blocking nets as side walls and UV non blocking
During experiment, 3, significantly higher numbers of thrips
plastic films as roof [B-N+NB-P]; and, UV non blocking nets as side wall and
were attracted towards the NB (N+P) type greenhouses for UV-blocking plastics films as roof [NB-N+B-P] during exp. 3 (A) and exp. 4
all sampling days followed by B-N+NB-P. However no (B), when greenhouse doors kept open (complete ventilation). Cumulative
differences were found among the B (N+P) and NB-N+ B- percent at the 43 days after transplanting sharing a common letter are not
P type GH (Table 2). Similar significant attraction was significantly different at P <0.05, Fisher’s LSD.](https://image.slidesharecdn.com/chaijournal-ijihvol1no-1-121229075949-phpapp01/85/Chai-journal-_ijih__vol1__no-1-10-320.jpg)
![Diversity analysis of Alternaria porri (Ellis) Cif- causal organism of purple leaf blotch of onion 17
Jamaica and their effect on selected cocoa varieties. Trans. Brit. molecular characterization of Alternaria isolates associated with
Mycol.Soc., 91:389-401. Alternaria late blight of pistachio. Phytopathology, 92:406-416.
Food and Agricultural Organization, 2008.www.fao.org Purseglove, J.W. 1972. Tropical crops: Monocotyledons. Longma. London.
Gupta, R.P. Srivastava, K.J., Pandey, U.B. and Midmore, D.J. 1994. Raeder, U. and Broda, P. 1985. Rapid preparation of DNA from filamentous
Diseases and insect pests of onion in India. International Symposium fungi. Applied Microbiology, 1:17-20.
on Alliums for the Tropics. Acta Horticulturae, 35:265-269. Remneva, Z.I., and Ivanyuk, V.G. 1968. Intraspecific heterogeneity of
Gupta, K., Saharan, G. S., Naresh, M., and Sangwan, M. S. 2004. Alternaria solani the causal agent of early blight of potato. Mikol.
Identification of pathotypes of Alternaria brassicae from Indian Fitopatol. 202-209.
mustard [Brassica juncea (L.) Czern. and Coss]. J. Mycol. Plant Rogers, P. M. and Stevenson, W.R. 2010. Aggressiveness and fungicide
Pathol. 34:15-19. sensitivity of Alternaria dauci from cultivated carrot. Plant Disease,
Gac, M.L., Montfort, F., Cavelier, N. and Sailland, A. 1996. Comparative 94:405-412.
study of morphological, cultural and molecular markers for the Rotem, J. 1966. Variability in Alternaria porri f. solani. Isr. J. Bot. 15:48-57.
characterization of Pseudocercosporella herpotrichoides isolates. Saitou, N., and Nei, M.1987. The neighbor-joining method: A new method
European Journal of Plant Pathology, 102:325-337. for reconstructing phylogenetic trees. Molecular Biology and
Holm, A.L., Rivera, V.V., Secor, G.A and Gudmestad, N.C. 2003. Temporal Evolution, 4:406-425
sensitivity of Alternaria solani isolates to foliar fungicides. Am. J. of Sharma, I.M.1997. Screening of onion varieties /lines against PLB caused
Potato Res., 80:33-40. by Alternaria porri under field condition. Plant Disease Research,
Kumar, V., Haldar, S., Pandey, K.K., Singh, P.R., Singh, A.K. and Singh, 12:60-61
C.P. 2008. Cultural, morphological, pathogenic and molecular Singh, Daljeet. Dhiman, J.S., Sidhu, A.S., Hari Singh, D. and Singh, H.
variability amongst tomato isolates of Alternaria solani in India. World 1992. Current status of onions in India: strategies for disease
J Microbiol Biotechnol, 24:1003-1009. resistance breeding for sustained production. Onion Newsletter
Lorenz, G. 1988. Dicarboximide fungicides: History of resistance Tropics. 4:43-44.
development and monitoring methods. In: CJ. Delp(ed), Fungicide
Sugha, S,K., Develash, R.K. and Tyagi, R.D.1992. Performance of onion
Resistance in North America. American Phytopathological Society,
genotypes against PLB pathogen. South Ind.Hort., 40:297.
St. Paul, MN.pp45-51.
Sujkowski, L.S., Fry, B.A., Power, R.J., Goodwin, S.B., Peever, T.A.,Hamlen,
Mani, V.P., Chauhan, V.S., Joshi, H.C. and Tandon, J.P. 1999. Exploiting
R.A and Fry, W.E.1995. Senstivities of Mexican isolates of
gene effects for improving bulb yields in onion. Ind. J. genet. Pl.
Phytophthora infestans to chlorothalonil, cymoxanil amd metalaxyl.
Breed., 59:511-514
Plant Disease, 79:1117-1120.
McKay G. J., Egan D., Morris E. and Brown A. E. 1998. Identification of
Suwan, N., Nuandee, N., Akimitsu, K. and Nalumpang, S. 2012. Analysis of
benzimidazole resistance in Cladobotryum dendroides using a PCR-
β-tubulin gene from carbendazim resistant isolates of Cercospora
based method. Mycol. Res., 102:671-676
lactucae-sativae on lettuce in Thailand ‘Journal of Agricultural
McKay G.J., Egan, D., Morris, E., Scott S, and Brown, A.E. 1999. Genetic
and morphological characterization of Cladobotryum Species Technology, 8:711-723.
causing cobweb disease of mushrooms Appl.Environ. Microbiol., Tamura, K., Nei, M., and Kumar, S. 2004. Prospects for inferring very large
65:606-610. phylogenies by using the neighbor-joining method. Proceedings of
Messiaen, C.M.1994. The Alliums. The Tropical Vegetable Garden: the National Academy of Sciences (USA), 01:1030-1035.
Principles for improvement and increased production with Tamura, K., Dudley, J., Nei, M. and Kumar S. 2007. MEGA4: Molecular
application to the main vegetable types. C.T.A. Macmillan. London. Evolutionary Genetics Analysis (MEGA) software version 4.0.
Naresh, M., and Sangwan, M. S. 2003. Morphological and pathological Molecular Biology and Evolution, 24:1596-1599.
variations in rapeseed and mustard isolates of Alternaria brassicae. Thrall, P.H., Barrett, L.G., Burdon, J.J. and Alexander, H.M. 2005. Variation
Ind. Phytopathol., 56:188-190. in pathogen aggressiveness within meta population of Cakile
O’Donnell, K. 1993. Fusarium and its near relatives. Pages 225-236 in: The maritime-Alternaria brassicicola host pathogen association. Plant
Fungal Holomorph:Mitotic, Meiotic, and Pleomorphic Speciation in Pathol., 54:265-274.
Fungal Systematics. D. R. Reynolds and J. W. Taylor, (eds.) CAB Van der Waals, J.E., Korsten, L. and Slippers, B. 2004. Genetic diversity
International, Wallingford, U.K. among Alternaria solani isolates from potatoes in South Africa. Plant
Pasche, J.S., Wharam, C. M. and Gudmestad, N. C. 2004. Shift in sensitivity Disease, 88:959-964.
of Alternaria solani in response to QoI fungicides. Plant Dis. (eds.), Weir, T. L., Huff, D. R., Christ, B. J. and Romaine, C. P. 1998. RAPD-PCR
88:181-187. analysis of genetic variation among isolates of Alternaria solani and
Pryor, B.M. and Michailides, T.J. 2002. Morphological, pathogenic and Alternaria alternata from potato and tomato. Mycologia, 90:813-821.](https://image.slidesharecdn.com/chaijournal-ijihvol1no-1-121229075949-phpapp01/85/Chai-journal-_ijih__vol1__no-1-21-320.jpg)


![34 K.S. Subramanian and C. Sharmila Rahale
(Chirenje, et al., 2005). Thus, zeolite may show great promise magnification and 12.50KV.
as anion and cation carriers for CRFs to control zinc release.
It is hypothesized that nano zeolite are negatively charged and Surface Area measurement
they are capable of adsorbing Zn2+ ions that facilitate slow X-Ray Diffraction technique was used for rapid surface area
steady and regulated release of nutrients. This process will determination. Approximately one gram of samples was dusted
result in nano-fertilizer formulations that assist to regulated on a glass substrate. Care should be taken that the surface on
release of nutrients and improve zinc use efficiency while the glass substrate should be even and it was mounted on the
preventing environmental hazard. sample stage and diffraction was measured. From this an
automatic strip chart record of the sample peak was obtained.
MATERIALS AND METHODS The well known Deby-Scherrer formula provides the
relationship between mean crystallite size and diffraction line
Synthesis of zeolite based nano-fertilizer breadth.
The zeolite (clinoptilolites) (GM Chemicals, Ahmedabad,
India) were of vulcanoclastic origin, with a high cationic Bulk Density
interchange capacity [270 C mol (p+) kg-1]. The clinoptilolite The bulk density, particle density were determined by
was subjected to ball milling to achieve particles of 30 nm cylinder method as given by (Gupta and Dhakshinamurthi,
in diameter. Commonly occurring nano-clays such as 1980). Exactly 20 g of nano-clay samples were taken and
halloysite, montmorrilionite, and bentonite of 30-40 nm transferred to 100 ml measuring cylinder and compacted
sized particles (Sigma Aldrich chemicals, Bangalore) were by tapping 20 times and the volume was noted. Then 50 ml
used for the study. The physico chemical properties of of water was added along the sides of the cylinder using
zeolite and nano-were estimated following standard pipette till the entire mass was completely soaked. The
protocols (Cichocki, 2001). cylinder with nano-clays and water kept in an undisturbed
condition for at least 30 minutes so that the entire pore
Particle size analysis space was completely filled with water. The final volume
The samples were analyzed for size using DELSA Nano of soil plus water after the expiry of time and the bulk
Particle Size Analyzer (Beckman Coulter Counter, Model density was calculated.
ZM, Beckman Instruments, Fullerton, CA). All samples
were dispersed in deionized water. The sample was Colour
sonicated using Sonicator (Model MS-50, Heat Systems, Munsell colour chart is used for measuring the colour. The
UIltrasonics, Inc., USA) for five minutes at 1500rpm before colour of the dried powder of nanoclay was determined by
the average particle size measurement was done. matching the clay samples with the colour chip. The colour
chip which closely matches was taken as the colour.
Shape
The Scanning Electron Microscopy (FEI, Quanta 200, pH and Electrical Conductivity
Phillips, Netherlands) was used to get the shape of the nano- The pH and Electrical Conductivity (EC) of the nano-clay
clays. About 0.5 to 1.0 g of nano-clay sample was dusted samples was determined using pH meter and EC meter as
on the carbon conducting tape. Then the tape was mounted per the procedure given by (Cichocki, 2001). Exactly 20g
on sample stage and the images were taken in 16,000 of nano-clay sample was taken into a clean 100 ml beaker.
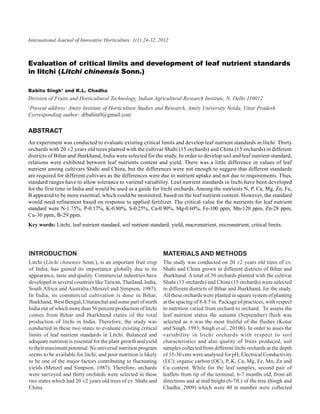
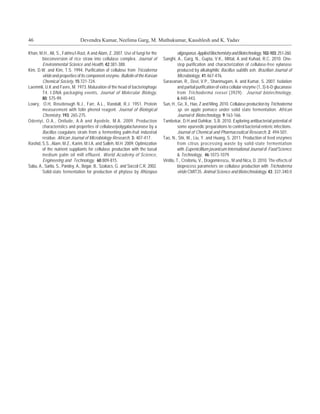
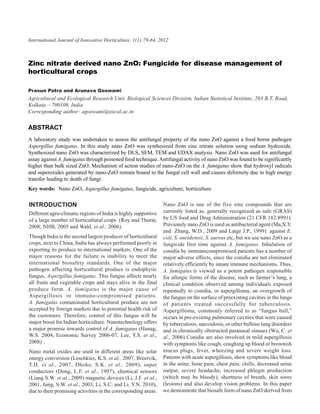
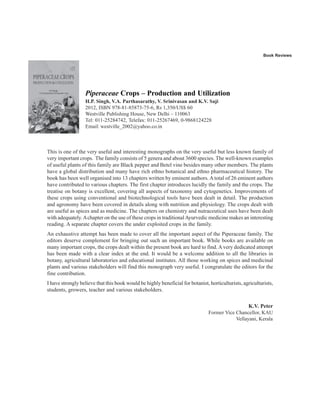
Table 1: Physical and chemical properties of nano-zeolite and nano-clays
Parameters Zeolite Montmorillonite Halloysite Bentonite
Physical Properties
Size (nm) 25-30 30-40 30-40 30-40
Shape Cubical Irregular Flakes Tubular Round
Surface Area (m2 g-1) 1300 1000 150 80
Bulk Density (g cc-1) 0.30 0.46 0.35 0.90
Color 5Y 7/4 5Y 8/1 2.5Y 8/2 2.5Y 7/4
Chemical Properties
pH of 1% slurry 7.9 8.0 8.2 10.4
EC (dSm-1) 0.02 0.02 0.03 0.35
CEC (C mol(p+) kg-1) 270 180 80 60
SiO2/Al2O3 molar ratio 1.95 1.83 1.72 1.65](https://image.slidesharecdn.com/chaijournal-ijihvol1no-1-121229075949-phpapp01/85/Chai-journal-_ijih__vol1__no-1-38-320.jpg)


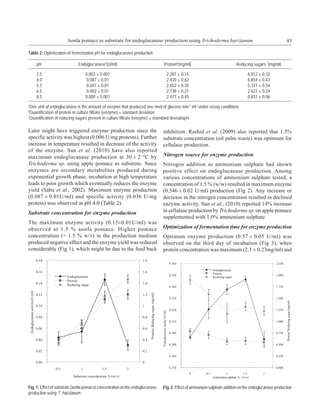
![42 Devendra Kumar, Neelima Garg, M. Muthukumar, Kaushlesh and K. Yadav
unit of endoglucanase is the amount of enzyme that temperature optimization studies, the enzyme extract was
produced one µ mole of glucose min-1 ml-1 under assay incubated at incremental temperatures of 10 ºC from
conditions. 20-60 ºC for 30 min and then assayed for endoglucanase
Optimization of pH and fermentation duration activity.
The pH of production medium was adjusted to 2.5, 4.0, Sodium dodecylsulfate
5.5, 6.5 and 8.5. The specific pH level for production of Polyacrylamide gel (SDS-PAGE) electrophoresis:
maximum enzyme was recorded. Fermentation period (1-5 Electrophoretic analysis of purified protein was done under
day) was also standardized for optimum endoglucanase alkaline conditions at pH 8.8 on 10% native polyacrylamide
production. gel and 12% denaturating PAGE (SDS-PAGE) as described
Optimization of substrate concentrations by Laemmli and Favre (1973). Electrophoresis was
performed at constant voltage of 100V for 4 h in Vertical
Substrate concentrations (0.5-2% w/v with increments of Mini Gel apparatus (Bangalore Genei, India). After
0.5%) and nitrogen addition (in the form of ammonium electrophoresis, the gels were stained with glycoprotein
sulphate @ 0.5-2% w/w of substrate with increments of staining using Schiff’s reagent. The molecular size of the
0.5%) were optimized. enzyme (kDa) was determined from the gel based standard
Effect of inorganic salts addition on endoglucanase protein markers [(β-galactosidase (110 kDa), phosphorylase
production (97 kDa), bovine serum albumin (66 kDa), carbonic
anhydrase (30 kDa) and bamHI-25 (25 kDa)]
Inorganic salts viz. calcium as CaCl2. 2H2O (4.5, 9.0 and
coelectrophoresed with the protein samples by relative front
45 mM), iron as FeCl3 (4.5, 9.0, 45 mM), magnesium as
(Rf) value determination based on migration distance.
MgCl2.7H2O (0.33, 3.3 and 33 mM) and Zinc as ZnSO4
(1.75, 17.5 and 35.5mM), were added individually into the Determination of kinetic constant
100 ml production medium. The endoglucanase activity was
Kinetics of the enzyme was analyzed using Lineweaver-
determined in the culture filtrate.
Burke and Michaelis-Menten plots (Sanghi et al., 2010).
Enzyme purification The enzyme kinetics experiment was performed by
Culture filtrate to acetone ratio was standardized for measuring the initial enzyme reaction velocity at different
optimum enzyme purification. The culture filtrate substrate concentrations of carboxy methyl cellulose sodium
containing extracellular protein was partially purified using salt in 50mM acetate buffer (pH 5.0). The Lineweaver-
culture filtrate to acetone ratio, i.e., 1:1, 1:2, 1:3 and 1:4 at Burke plot was used to establish the Michaelis constant
4 °C for 24 h. The precipitate was collected by (KM) and maximum velocity (Vmax) of the enzyme reaction.
centrifugation at 12,000 g, at 4 °C for 20 min and re In all experiments three replications were taken and mean
dissolved in10 ml of 0.05 M acetate buffer of pH 5.0. values were calculated.
Enzyme characterization RESULTS AND DISCUSSION
Optimization of fermentation temperature and pH for
Optimization of pH and temperature for maximum enzyme production
enzyme activity
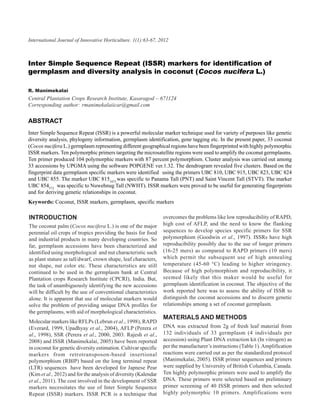
Temperature and pH are the most important factors, as they
The effect of pH (3.0 to 7.0 in the increments of 1unit) on markedly influence enzyme activity. Maximum
endoglucanase activity was studied using citrate/phosphate endoglucanase activity (0.024 ± 0.004U/ml) was recorded
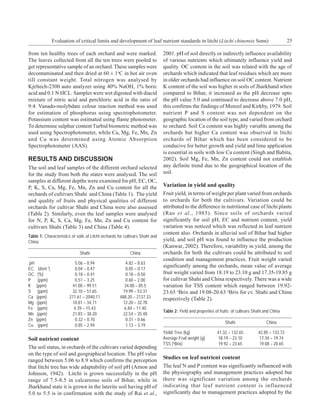
buffer (0.02 M) as described by Ali et al., (2008). For at 30 ºC while the reducing sugar content decreased (Table 1).
Table 1: Optimization of fermentation temperature for endoglucanase production
Temperature(oC) Endoglucanasea(U/ml) Proteinb(mg/ml) Reducing sugars c(mg/ml)
20 0.018±0.001 5.014±0.62 3.386±0.09
30 0.024±0.004 4.161±0.63 3.085±0.26
40 0.010±0.001 7.090±0.84 4.830±0.37
a
One unit of endoglucanase is the amount of enzyme that produced one µmol of glucose min-1 ml-1 under assay conditions
b
Quantification of protein in culture filtrate (enzyme) ± standard deviation
c
Quantification of reducing sugars present in culture filtrate (enzyme) ± standard deviation](https://image.slidesharecdn.com/chaijournal-ijihvol1no-1-121229075949-phpapp01/85/Chai-journal-_ijih__vol1__no-1-46-320.jpg)


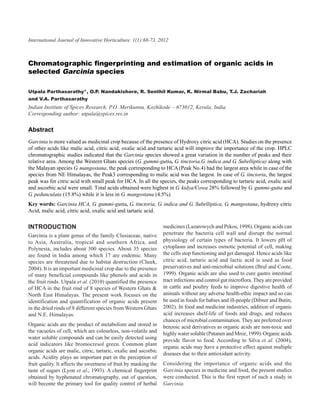


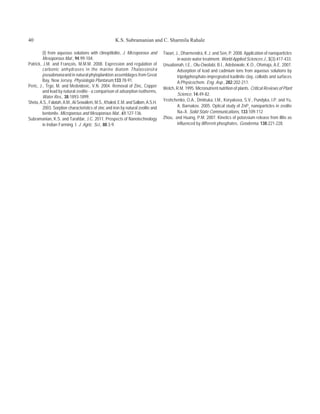
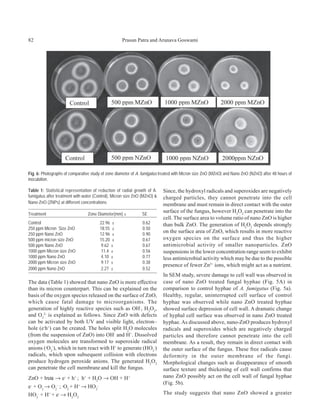
![80 Prasun Patra and Arunava Goswami
zinc nitrate act as an effective antifungal agent against A. synthesized nano ZnO was recorded from Dynamic Light
fumigatus. Scattering (DLS) in a particle size analyzer (90 Plus,
Brookhaven Instrument Corporation, USA). The laser light
MATERIALS AND METHODS (λ = 660 nm) was scattered at an angle θ = 90º at 25 ºC
Chemicals placing the dispersion in a glass cuvette. For this measurement
a small portion of sample solution in ethanol was taken in a
AR grade zinc nitrate [Zn(NO3)2·6H2O], Sodium hydroxide test tube and then diluted with further addition of ethanol
(NaOH) were purchased from Merck, India. AR grade and then again sonicated for 30 minutes in a sonication bath
Potato Dextrose Agar (PDA) was purchased from Himedia, (Branson Inc, USA). After settling for 10 minutes the solution
India. Deionised water (Sartorious Stedim biotech) was used was again diluted with same ratio of ethanol and
throughout the experiment. measurements were performed after sonication of the solution
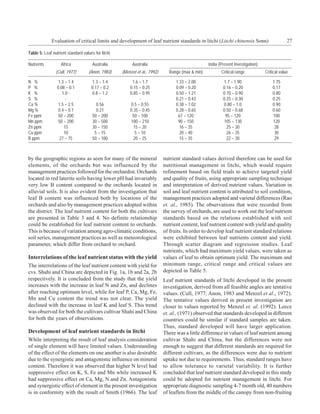
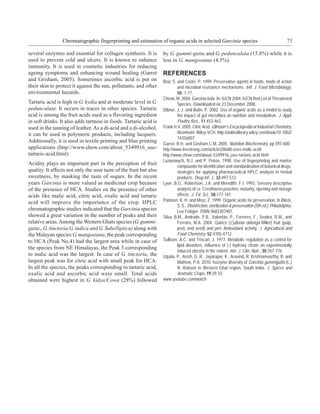
Fungus Strain for 30 minutes. The average size was found to be 586 nm
(~ 600 nm) with poly-dispersity ratio of 0.242 (Fig. 1a).
Wild Aspergillus fumigatus strain was purchased from Scanning electron microscope was used to study the size
Microbial Type Culture Collection (MTCC), Chandigarh, and surface morphology of ZnO nanoparticles. Due to small
India. Strain was phenotypically and genotypically size of the particles the morphology was not quite clear from
characterized in the laboratory with standard markers and SEM micrograph (Fig. 1b). However, the size of the particles
PCR primers. was far smaller (~50 nm) as compared to the DLS results.
Synthesis of nano ZnO nanoparticles Composition of the sample was confirmed by Energy-
dispersive X-ray spectroscopy. EDAX analysis showed that
To prepare the precursor, 50 ml of 0.5 M zinc nitrate was the sample contained Zn and O as the elemental composition
added (drop wise) to 50 ml of 0.5 M NaOH solution within of synthesized nano ZnO (Fig. 2a). Distinct size and shape
a time period of 30 min, and then the mixed solution was (50 nm) was confirmed by TEM micrograph (Fig. 2b). Taken
kept at 25 °C for 2 h under vigorous stirring condition. The together the size of nano-ZnO was found to be 50 nm.
aqueous solution turns slimy, and precipitates were found
in the bottom of the flask. Finally, the white precursor was
Antifungal assay
collected after the mixture was centrifuged, filtrated, washed Wild strain of A. fumigatus was used for antifungal assay.
with water and alcohol, and dried at room temperature under Strain was maintained on potato dextrose agar plates at 30°C
vacuum overnight for further characterization (Dhingra and by periodical sub-culturing. The antimycotic activity of both
Sinclair, 1985). nano ZnO and micronized (bulk) were tested at four
different concentrations (250, 500, 1000 and 2000 ppm)
Characterization of ZnO nanoparticles
using modified poison food technique originally proposed
Synthesized nano ZnO was characterized by using Dynamic by Dhingra and Sinclair in 1985 (Stoimenov, P.K. et al.,
Light Scattering (DLS), Scanning Electron Microscopy 2002). Every concentration of micronized and nano ZnO
(SEM), Transmission Electron Microscopy (TEM) and was mixed in distilled water and sonicated for 15 minutes
EDAX analysis. Particle size distributions (PSD) of and then mixed with potato dextrose agar. Fungal
Fig. 1a: Particle size distribution (DLS measurements) of nano ZnO which depicts the size distribution as well as the quality of the sample;
Fig. 1b: Scanning electron microscopic image of nano ZnO.](https://image.slidesharecdn.com/chaijournal-ijihvol1no-1-121229075949-phpapp01/85/Chai-journal-_ijih__vol1__no-1-84-320.jpg)


The document summarizes a study on using ultraviolet (UV)-blocking greenhouses to reduce pesticide use for vegetable production. The study tested different combinations of UV-blocking and UV-transmitting nets and plastics in greenhouse structures. Results showed that greenhouses with lower UV intensity had significantly fewer invading thrips and lower virus infection in tomatoes. Specifically, greenhouses with UV-blocking nets and plastics had 96-100% lower virus infection rates compared to non-UV blocking structures. The findings suggest that UV-blocking greenhouse materials can effectively reduce immigration of sucking pests and transmission of viruses, providing an option for pesticide-free vegetable production.


![Breeding for disease resistance in mungbean [Vigna radiata (L.) Wilczek]](https://cdn.slidesharecdn.com/ss_thumbnails/kkc-180611160826-thumbnail.jpg?width=640&height=640&fit=bounds)


