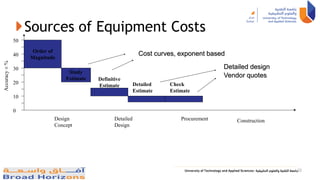
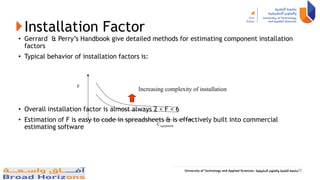
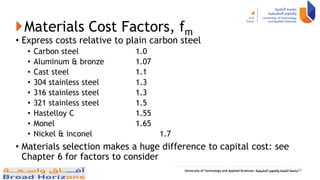
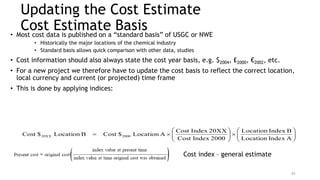
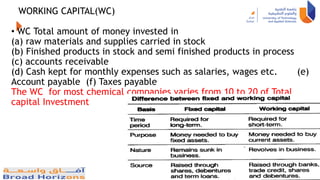
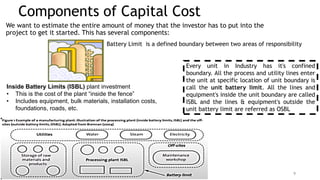
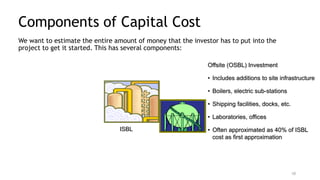
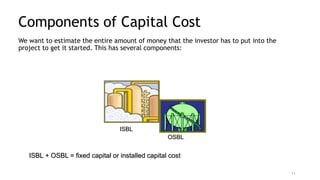
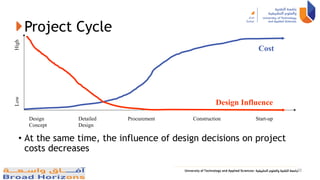
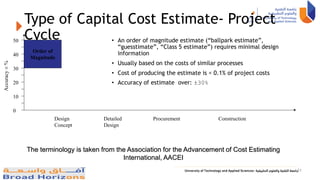
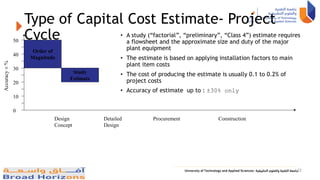
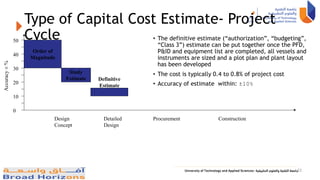
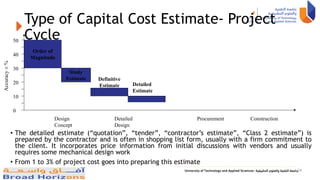
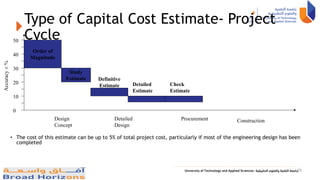
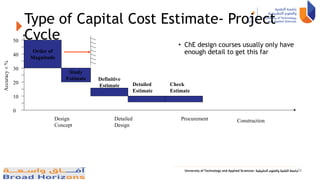
ENCH4119- PLANT
DESIGN AND ECONOMICS
Instructor:
Name : Dr. Saravana Kumar
Room No : B112
Email: drsara.soh@cas.edu.om
PROCESS ECONOMICS
“Economics is the study of how people and society choose to employ scarce resources that could have alternative
uses in order to produce various commodities and to distribute them for consumption, now or in the future,
…”from Paul Samuelson and William Nordhaus, conomics, 12th Ed., McGraw- Hill, New York, 1985.
ENGINEERING ECONOMICS: The application of economic principles to engineering problems, for example in
comparing the comparative costs of two alternative capital projects.
2
Why does money have time value?
–The owner of the money must defer its use. Thus, the
person using the money must pay for deferring the benefits.
– An alternative use of the money could have generated
other benefits, e.g. interests.
• How do we characterize time value?
–We use an interest rate, so that the effect of time is
proportional to the total amount of money involved and
positively related with the length of time.
PV = FV/(1 + r)n
WHAT DO WE NEED TO KNOW?
• Time value of money
• Estimation of cash flows
• Quantitative measurements of profitability
• Systematic comparison of alternatives
PV- Present Value
FV- Future Value
WHY DO ENGINEERS NEED TO LEARN ABOUT ECONOMICS?
Ages ago, the most significant barriers to engineers were
technological. The things that engineers wanted to do, they simply did
not yet know how to do, or hadn't yet developed the tools to do. There
are certainly many more challenges like this which face present-day
engineers
• Natural resources (from which we must build things) are becoming
more scarce and more expensive
• Negative side-effects of engineering innovations (such as air
pollution from automobiles)
Engineers must decide if the benefits of a project exceed its costs, and
must make this comparison in a unified framework. The framework
within which to make this comparison is the field of engineering
economics,
which strives to answer exactly these questions, and perhaps more. 3
What is Engineering Economics?
• Engineering Economics is about making decisions
• Engineering Economics assesses the appropriateness
of a given project, estimates its value, and justifies it
from an engineering standpoint
• Engineering Economics is the application of
economic techniques to the evaluation of design and
engineering alternatives
4
Production, consumption and capital formation are called the basic economic activities of an
economy
5
Cost Estimation for Design
6
Process Economics has three basic roles
1. Evaluation of design options – cost required to process design options
2. Process optimization –setting of process variables
3. Overall project profitability – economics of overall project
Capital cost for new design includes
• Battery limits investment
• Utility investment
• Off site investment
• Engineering fees
• Working capital
Capital Investment
• Capital- stock of accumulated wealth
• Investment – to use the savings or investing money for profit
• Total capital investment = Fixed Capital Investment + Working Capital
• Fixed capital investment divided into two types
(a) manufacturing fixed capital investments(Direct cost)
(b) Non manufacturing fixed capital investments(indirect cost)
• Direct cost represents the capital necessary for the installed process
equipment for complete operations
Ex. Site preparation, piping, instruments, insulation,
foundations, and auxiliary facilities
• Indirect cost – not directly related to process operation
Ex. Land, processing buildings, administrative and other offices,
warehouses, labs, transportation, shipping, utility, disposal facilities
7
WORKING CAPITAL(WC)
• WC Total amount of money invested in
(a) raw materials and supplies carried in stock
(b) Finished products in stock and semi finished products in process
(c) accounts receivable
(d) Cash kept for monthly expenses such as salaries, wages etc. (e)
Account payable (f) Taxes payable
The WC for most chemical companies varies from 10 to 20 of Total
capital Investment
8
Components of Capital Cost
We want to estimate the entire amount of money that the investor has to put into the
project to get it started. This has several components:
Inside Battery Limits (ISBL) plant investment
• This is the cost of the plant “inside the fence”
• Includes equipment, bulk materials, installation costs,
foundations, roads, etc.
9
Battery Limit is a defined boundary between two areas of responsibility
Every unit in Industry has it's confined
boundary. All the process and utility lines enter
the unit at specific location of unit boundary is
call the unit battery limit. All the lines and
equipment's inside the unit boundary are called
ISBL and the lines & equipment's outside the
unit battery limit are referred as OSBL
Components of Capital Cost
We want to estimate the entire amount of money that the investor has to put into the
project to get it started. This has several components:
ISBL
Offsite (OSBL) Investment
• Includes additions to site infrastructure
• Boilers, electric sub-stations
• Shipping facilities, docks, etc.
• Laboratories, offices
• Often approximated as 40% of ISBL
cost as first approximation
10
Components of Capital Cost
We want to estimate the entire amount of money that the investor has to put into the
project to get it started. This has several components:
ISBL
ISBL + OSBL = fixed capital or installed capital cost
OSBL
11
Components of Capital Cost
We want to estimate the entire amount of money that the investor has to put into the
project to get it started. This has several components:
ISBL
OSBL
Engineering & Construction Costs
• Site construction costs
• Home office costs
12
Components of Capital Cost
We want to estimate the entire amount of money that the investor has to put into the
project to get it started. This has several components:
ISBL
OSBL E&C
Working Capital
• To buy feedstocks
• To get in business
13
Components of Capital Cost
We want to estimate the entire amount of money that the investor has to put into the
project to get it started. This has several components:
ISBL
OSBL E&C
WC
Contingency
• To allow for the unexpected
?
14
ISBL Costs
• Direct Field Costs
• Major equipment
• Furnaces, heat exchangers, coolers
• Vessels, reactors, columns, tanks
• Pumps, drivers, compressors, fans, turbines
• Refrigerators, driers, centrifuges
• Bulk items
• Electrics, instrumentation, computer control
• Piping, valves
• Structures, insulation, paint
• Lube oils, solvents, catalysts
• Civil works
• Roads, foundations
• Piling, buildings
• Installation labor & supervision
• Indirect Field Costs
• Construction costs
• Construction equipment
• Temporary construction
• Temporary power and water
• Construction workshops
• Field expenses & services
• Field canteen
• Specialists costs
• Overtime, adverse weather
• Construction insurance
• Labor benefits & burdens
15
Home Office Costs
Engineering
Procurement
Construction services
Construction supervision
Project management
Expenses
Bonding
Contractor’s fee
These costs should be estimated individually as they do not scale that well with
project size, but a rule of thumb is 10 – 30% of ISBL investment
16
Working Capital
• Working capital (WC) is the money you need to get the plant running
• Buy feedstock's, pay bills, etc., until product is sold & revenue begins
• More sophisticated methods break out WC in terms of operating costs, e.g. in terms of
• Days of RM storage
• Days of product storage
• Days accounts receivable less accounts payable
• Inventories held (e.g. warehouse parts)
• Cash on hand
• WC Total amount of money invested in
(a) raw materials and supplies carried in stock
(b) Finished products in stock and semi finished products in process
(c) accounts receivable
(d) Cash kept for monthly expenses such as salaries, wages etc.
(e) Account payable
(f) Taxes payable
The WC for most chemical companies varies from 10 to 20 of TCI
17
Contingency
• Contingency charges allow for variation from the predicted
cost estimate
• Variation can be caused by
• Scope change
• Change in economic scenario
• Currency fluctuations
• Labor disputes, weather problems, subcontractor problems
• Validity of cost estimate and vendor quotes
• Contingency should be at least 10% of ISBL, & can be up to 50% if the process
technology is uncertain: more about this later
18
Types of capital Cost Estimate
Project Cycle
Design
Concept
Start-up
Construction
Procurement
Detailed
Design
• As the project proceeds, costs accumulate and the overall cost
estimate becomes more certain
Low
High
Cost
19
Project Cycle
Design
Concept
Start-up
Construction
Procurement
Detailed
Design
• At the same time, the influence of design decisions on project
costs decreases
Low
High
Cost
Design Influence
20
Type of Capital Cost Estimate- Project
Cycle
Design
Concept
Construction
Procurement
Detailed
Design
• An order of magnitude estimate (“ballpark estimate”,
“guesstimate”, “Class 5 estimate”) requires minimal design
information
• Usually based on the costs of similar processes
• Cost of producing the estimate is < 0.1% of project costs
• Accuracy of estimate over: ±30%
Accuracy
±
%
50
40
30
20
10
0
Order of
Magnitude
The terminology is taken from the Association for the Advancement of Cost Estimating
International, AACEI
21
Type of Capital Cost Estimate- Project
Cycle
Design
Concept
Construction
Procurement
Detailed
Design
• A study (“factorial”, “preliminary”, “Class 4”) estimate requires
a flowsheet and the approximate size and duty of the major
plant equipment
• The estimate is based on applying installation factors to main
plant item costs
• The cost of producing the estimate is usually 0.1 to 0.2% of
project costs
• Accuracy of estimate up to : ±30% only
Accuracy
±
%
50
40
30
20
10
0
Order of
Magnitude
Study
Estimate
22
Type of Capital Cost Estimate- Project
Cycle
Design
Concept
Construction
Procurement
Detailed
Design
• The definitive estimate (“authorization”, “budgeting”,
“Class 3”) estimate can be put together once the PFD,
P&ID and equipment list are completed, all vessels and
instruments are sized and a plot plan and plant layout
has been developed
• The cost is typically 0.4 to 0.8% of project cost
• Accuracy of estimate within: ±10%
Accuracy
±
%
50
40
30
20
10
0
Order of
Magnitude
Study
Estimate Definitive
Estimate
23
Type of Capital Cost Estimate- Project
Cycle
Design
Concept
Construction
Procurement
Detailed
Design
• The detailed estimate (“quotation”, “tender”, “contractor’s estimate”, “Class 2 estimate”) is
prepared by the contractor and is often in shopping list form, usually with a firm commitment to
the client. It incorporates price information from initial discussions with vendors and usually
requires some mechanical design work
• From 1 to 3% of project cost goes into preparing this estimate
Accuracy
±
%
50
40
30
20
10
0
Order of
Magnitude
Study
Estimate
Detailed
Estimate
Definitive
Estimate
24
Type of Capital Cost Estimate- Project
Cycle
Design
Concept
Construction
Procurement
Detailed
Design
• The cost of this estimate can be up to 5% of total project cost, particularly if most of the engineering design has been
completed
Accuracy
±
%
50
40
30
20
10
0
Order of
Magnitude
Study
Estimate
Check
Estimate
Detailed
Estimate
Definitive
Estimate
25
Type of Capital Cost Estimate- Project
Cycle
Design
Concept
Construction
Procurement
Detailed
Design
• ChE design courses usually only have
enough detail to get this far
Accuracy
±
%
50
40
30
20
10
0
Order of
Magnitude
Study
Estimate
Check
Estimate
Detailed
Estimate
Definitive
Estimate
26
Exponential Estimating
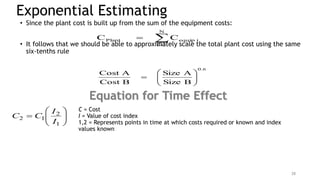
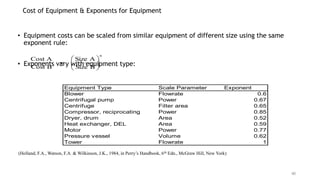
• The cost of most plant items varies with the equipment size in a non-linear manner:
Size
Cost
Log[Size]
Log[Cost]
• By taking logs, we can usually get a reasonably good correlation over a few orders of
magnitude
• The exponent n is 0.6 for many types of equipment, hence this is often known as the “Six-
tenths rule”
n
B
Size
A
Size
B
Cost
A
Cost









27
n
a
a KA
C  b
n
b
C
K
A

Exponential Estimating
• Since the plant cost is built up from the sum of the equipment costs:
• It follows that we should be able to approximately scale the total plant cost using the same
six-tenths rule



N
1
i
i
equip
Plant C
C
0.6
B
Size
A
Size
B
Cost
A
Cost









28
Equation for Time Effect









1
2
1
2
I
I
C
C
C = Cost
I = Value of cost index
1,2 = Represents points in time at which costs required or known and index
values known
Exponents for Different Processes
In practice, the 0.6 factor does not apply to all equipment or all types of process:
• Most petrochemical processes are better fitted with exponent 0.7
• Processes with a lot of gas compression or mechanical work have exponents 0.8 to 0.9 (e.g.
MeOH, paper pulping)
• Small scale, highly-instrumented processes have lower exponents 0.4 to 0.5
29
Example
• A 40,000 bbl/d hydrotreater costs 56 MM$. How much would a 30,000 bbl/d hydrotreater
cost at the same location?
MM$
47
40
30
56
Cost
B
size
A
size
B
Cost
A
Cost
0.6
0.6


















30
Estimating Plant Cost for Manufactured Products
• For large scale mass manufacture (>0.5 MM pieces/y) a rule of
thumb is
Total cost of production = 2 x materials cost
• This allows a very approximate estimate of plant cost if other
fixed costs and utilities can be estimated
• More detailed methods allow for number of components, number
of assembly steps and complexity of assembly
31
Estimating the Equipment Cost
Project Cycle
Design
Concept
Construction
Procurement
Detailed
Design
These estimates usually start with an estimate of the cost for each major piece
of plant equipment
Accuracy
±
%
50
40
30
20
10
0
Order of
Magnitude
Study
Estimate
Check
Estimate
Detailed
Estimate
Definitive
Estimate
32
Sources of Equipment Costs
Design
Concept
Construction
Procurement
Detailed
Design
Accuracy
±
%
50
40
30
20
10
0
Order of
Magnitude
Study
Estimate
Cost curves, exponent based
Detailed design
Vendor quotes
Check
Estimate
Detailed
Estimate
Definitive
Estimate
33
Equipment Cost Correlations
• The ChE literature has an abundance of cost correlations
• Many of these are updates or derivatives of the work of Guthrie, and have to be used with
some caution
• The IChemE and ACostE publish an excellent (& very cheap) guide to capital cost estimating
with recent cost correlations, but these need to be converted from U.K. to U.S. basis.
• Many cost engineers collect data and keep their own correlations
• Best practice in industry is to use costing software (see later)
• Correlations given in Ch7 can be used as a first approximation if no software is available.
Note: these are not based on Guthrie’s work
Guthrie, K.M. Capital Cost Estimating, Chem. Eng., 76(6), 114, 1969
Guthrie, K.M. Process Plant Estimating, Evaluation and Control, Craftsman Book Co., Solana Beach, CA, 1974
Gerrard, A.M. Guide to Capital Cost Estimating, 4th Edn., Institute of Chemical Engineers, Rugby, U.K., 2000
e.g. Perry’s Handbook, other design textbooks
34
Cost of Installation
Factorial Estimates
• In addition to the purchased cost of the equipment itself, we need to consider the costs of:
• Installing the equipment
• Piping, ducting, etc.
• Instrumentation and control
• Electrical systems
• Civil engineering work such as foundations & piling
• Structures and buildings
• Insulation, paint and fireproofing
• Foundations and structures
• For preliminary and study estimates these are estimated by multiplying the main plant item
cost by an installation factor (or Lang factor)
Cinstalled = Cequipment x F
35
Installation Factors
• Lang originally proposed three installation factors, depending on plant type, roughly 4.0
• Simple methods allow for variation of F by equipment type (e.g., the factors proposed by Hand):
• More complex methods build up F from component factors
Equipment Type F
Compressors 2.5
Distillation columns 4
Furnaces 2
Heat exchangers 3.5
Instruments 4
Miscellaneous equipment 2.5
Pressure vessels 4
Pumps 4
Lang, H.J. Simplified approach to preliminary cost estimates. Chem. Eng., 55(6), 112, 1948
Hand, W.E. From flow sheet to cost estimate. Petrol. Refiner, 37(9), 331, 1958
36
Installation Factor
F = (1 + fp)fm + fer + fi + fel + fc + fs + fl
Where:
• fp is the piping installation factor
• fm is the material cost factor
• fer is the site erection installation factor
• fi is the instrumentation installation factor
• fel is the electrical installation factor
• fc is the civil installation factor
• fs is the structure & buildings installation factor
• fl is the lagging, paint and fireproof installation factor
• All of these factors (except fm) vary with installation complexity and equipment cost
• Note that the factors are standardized on a plain carbon steel basis
37
Installation Factor
• Gerrard & Perry’s Handbook give detailed methods for estimating component installation
factors
• Typical behavior of installation factors is:
• Overall installation factor is almost always 2 < F < 6
• Estimation of F is easy to code in spreadsheets & is effectively built into commercial
estimating software Cequipment
F
Increasing complexity of installation
38
Materials Cost Factors, fm
• Express costs relative to plain carbon steel
• Carbon steel 1.0
• Aluminum & bronze 1.07
• Cast steel 1.1
• 304 stainless steel 1.3
• 316 stainless steel 1.3
• 321 stainless steel 1.5
• Hastelloy C 1.55
• Monel 1.65
• Nickel & inconel 1.7
• Materials selection makes a huge difference to capital cost: see
Chapter 6 for factors to consider
39
Cost of Equipment & Exponents for Equipment
• Equipment costs can be scaled from similar equipment of different size using the same
exponent rule:
• Exponents vary with equipment type:
n
B
Size
A
Size
B
Cost
A
Cost









Equipment Type Scale Parameter Exponent
Blower Flowrate 0.6
Centrifugal pump Power 0.67
Centrifuge Filter area 0.65
Compressor, reciprocating Power 0.85
Dryer, drum Area 0.52
Heat exchanger, DEL Area 0.59
Motor Power 0.77
Pressure vessel Volume 0.62
Tower Flowrate 1
(Holland, F.A., Watson, F.A. & Wilkinson, J.K., 1984, in Perry’s Handbook, 6th Edn., McGraw Hill, New York)
40
Updating the Cost Estimate
Cost Estimate Basis
• Most cost data is published on a “standard basis” of USGC or NWE
• Historically the major locations of the chemical industry
• Standard basis allows quick comparison with other data, studies
• Cost information should also always state the cost year basis, e.g. $2004, ₤2000, €2002, etc.
• For a new project we therefore have to update the cost basis to reflect the correct location,
local currency and current (or projected) time frame
• This is done by applying indices:



















A
Index
Location
B
Index
Location
2000
Index
Cost
20XX
Index
Cost
A
Location
$
Cost
B
Location
$
Cost 2000
20XX
41
Cost index – general estimate
U.S.A. Cost Indices
• Engineering News Record (ENR) Construction Index
• Mainly for civil engineering work
• Not really suitable for process industries, but has been going since 1904
• Chemical Engineering (CE) Plant Cost Index
• Published monthly in Chemical Engineering magazine
• Multi-component index, but Chem. Eng. also has equipment indices
• Marshall & Swift (M&S) Equipment Cost Index
• Also published monthly in Chemical Engineering
• Composite from several industries (including cement, chemicals, glass, …)
• Nelson-Farrer Refinery Construction Index
• Published monthly in Oil & Gas Journal
• Applies to refinery & petrochemical plants on USGC
• OGJ also publishes quarterly indices for 40 equipment types
42
Comparison of U.S.A. Cost Indices
0
500
1000
1500
2000
2500
1985 1990 1995 2000 2005 2010
Year
Index
Value
NF
CE
MS
0.8
1
1.2
1.4
1.6
1.8
2
1985 1990 1995 2000 2005 2010
Year
Index
Relative
to
1990
NF
CE
MS
43
Location Factors
• Location factor captures differences in local
costs of labor, import duties, fabrication and
installation infrastructure, etc.
• Location factors are a function of time & are
trending closer to 1.0 as a result of
globalization
• Most sites have a good idea of their own
location factor relative to USGC or NWE
Country Region Location factor
United States Gulf coast 1.00
East coast 1.04
West Coast 1.07
Midwest 1.02
Canada Ontario 1.00
Fort McMurray 1.60
Mexico 1.03
Brazil 1.14
China imported 1.12
indigenous 0.61
Japan 1.26
SE Asia 1.12
Australia 1.21
India 1.02
Middle East 1.07
France 1.13
Germany 1.11
Italy 1.14
Netherlands 1.19
Russia 1.53
United Kingdom 1.02
44
Methods of estimating capital investment
• Method A Detailed item estimate(Considering all individual items)
• Method B Unit cost estimate
• Method C Percentage delivered equipment cost
• Method D Lang factors for approximation of capital investment
• Method E Power factor applied to plant/capacity ratio
• Method F Investment cost per unit of capacity
• Method G Turnover ratio
45
Method B Unit cost estimate
•used to estimate preliminary and definitive estimate
46
Method C Percentage delivered equipment
cost
Method D Lang factors for approximation of capital
investment
Method E Power factor Method
Capacity power factor for various process plants
R – Ratio(new to old), C-capacity old facility
x- 0.6to 0.7 , fe- cost index ratio
f-lumped cast factor
Cn= CfeRx
Computer Tools for Cost Estimation
Aspen ICARUS Process Evaluator™ (IPE)
• Allows import of simulation data from Aspen
Plus®, HYSYS®, UniSim, Pro II, ChemCAD
• Makes expert system assumptions for bulks,
installation, indirect costs & home office costs
• Provides a relatively quick, defensible cost
estimate with common basis of assumptions
• Easy to update as design detail is added
47
Precision & Contingency
• Contingency is strictly a cost added by the contractor to allow for uncertainty in the
estimate
Cost
Probability
Mean (most likely) value
Contractor’s estimate
• Contingency should be set to give a desired probability (statistical confidence) that the project will
come in under the quoted cost
• Higher uncertainty requires more contingency, hence “Me third!” for new technology
• See Ch7 for more details
48
Cost Engineering Resources
• References cited above
• Association for the Advancement of Cost Engineering (AACE) International www.aacei.org
• Project Management Institute www.pmi.org
• U.K. Association of Cost Engineers (ACostE) www.acoste.org.uk
• International Cost Engineering Council (ICEC) www.icoste.org (has listings to Cost
Engineering societies in 46 countries)
49
M.S. Peters, K.D. Timmerhaus, R.E. West, “Plant Design and Economics for Chemical Engineers” 5th
edition, McGraw-Hill, 2003
R. Turton, R.C. Baillie, W.B. Whiting, J.A. Shaeiwitz, “Analysis, Synthesis, and Design of Chemical
Processes.” 2nd edition, 2003.

Ch4-Cost Estimation for Design UTAS Fall22.pdf

  • 1.
    ENCH4119- PLANT DESIGN ANDECONOMICS Instructor: Name : Dr. Saravana Kumar Room No : B112 Email: drsara.soh@cas.edu.om
  • 2.
    PROCESS ECONOMICS “Economics isthe study of how people and society choose to employ scarce resources that could have alternative uses in order to produce various commodities and to distribute them for consumption, now or in the future, …”from Paul Samuelson and William Nordhaus, conomics, 12th Ed., McGraw- Hill, New York, 1985. ENGINEERING ECONOMICS: The application of economic principles to engineering problems, for example in comparing the comparative costs of two alternative capital projects. 2 Why does money have time value? –The owner of the money must defer its use. Thus, the person using the money must pay for deferring the benefits. – An alternative use of the money could have generated other benefits, e.g. interests. • How do we characterize time value? –We use an interest rate, so that the effect of time is proportional to the total amount of money involved and positively related with the length of time. PV = FV/(1 + r)n WHAT DO WE NEED TO KNOW? • Time value of money • Estimation of cash flows • Quantitative measurements of profitability • Systematic comparison of alternatives PV- Present Value FV- Future Value
  • 3.
    WHY DO ENGINEERSNEED TO LEARN ABOUT ECONOMICS? Ages ago, the most significant barriers to engineers were technological. The things that engineers wanted to do, they simply did not yet know how to do, or hadn't yet developed the tools to do. There are certainly many more challenges like this which face present-day engineers • Natural resources (from which we must build things) are becoming more scarce and more expensive • Negative side-effects of engineering innovations (such as air pollution from automobiles) Engineers must decide if the benefits of a project exceed its costs, and must make this comparison in a unified framework. The framework within which to make this comparison is the field of engineering economics, which strives to answer exactly these questions, and perhaps more. 3
  • 4.
    What is EngineeringEconomics? • Engineering Economics is about making decisions • Engineering Economics assesses the appropriateness of a given project, estimates its value, and justifies it from an engineering standpoint • Engineering Economics is the application of economic techniques to the evaluation of design and engineering alternatives 4 Production, consumption and capital formation are called the basic economic activities of an economy
  • 5.
  • 6.
    Cost Estimation forDesign 6 Process Economics has three basic roles 1. Evaluation of design options – cost required to process design options 2. Process optimization –setting of process variables 3. Overall project profitability – economics of overall project Capital cost for new design includes • Battery limits investment • Utility investment • Off site investment • Engineering fees • Working capital
  • 7.
    Capital Investment • Capital-stock of accumulated wealth • Investment – to use the savings or investing money for profit • Total capital investment = Fixed Capital Investment + Working Capital • Fixed capital investment divided into two types (a) manufacturing fixed capital investments(Direct cost) (b) Non manufacturing fixed capital investments(indirect cost) • Direct cost represents the capital necessary for the installed process equipment for complete operations Ex. Site preparation, piping, instruments, insulation, foundations, and auxiliary facilities • Indirect cost – not directly related to process operation Ex. Land, processing buildings, administrative and other offices, warehouses, labs, transportation, shipping, utility, disposal facilities 7
  • 8.
    WORKING CAPITAL(WC) • WCTotal amount of money invested in (a) raw materials and supplies carried in stock (b) Finished products in stock and semi finished products in process (c) accounts receivable (d) Cash kept for monthly expenses such as salaries, wages etc. (e) Account payable (f) Taxes payable The WC for most chemical companies varies from 10 to 20 of Total capital Investment 8
  • 9.
    Components of CapitalCost We want to estimate the entire amount of money that the investor has to put into the project to get it started. This has several components: Inside Battery Limits (ISBL) plant investment • This is the cost of the plant “inside the fence” • Includes equipment, bulk materials, installation costs, foundations, roads, etc. 9 Battery Limit is a defined boundary between two areas of responsibility Every unit in Industry has it's confined boundary. All the process and utility lines enter the unit at specific location of unit boundary is call the unit battery limit. All the lines and equipment's inside the unit boundary are called ISBL and the lines & equipment's outside the unit battery limit are referred as OSBL
  • 10.
    Components of CapitalCost We want to estimate the entire amount of money that the investor has to put into the project to get it started. This has several components: ISBL Offsite (OSBL) Investment • Includes additions to site infrastructure • Boilers, electric sub-stations • Shipping facilities, docks, etc. • Laboratories, offices • Often approximated as 40% of ISBL cost as first approximation 10
  • 11.
    Components of CapitalCost We want to estimate the entire amount of money that the investor has to put into the project to get it started. This has several components: ISBL ISBL + OSBL = fixed capital or installed capital cost OSBL 11
  • 12.
    Components of CapitalCost We want to estimate the entire amount of money that the investor has to put into the project to get it started. This has several components: ISBL OSBL Engineering & Construction Costs • Site construction costs • Home office costs 12
  • 13.
    Components of CapitalCost We want to estimate the entire amount of money that the investor has to put into the project to get it started. This has several components: ISBL OSBL E&C Working Capital • To buy feedstocks • To get in business 13
  • 14.
    Components of CapitalCost We want to estimate the entire amount of money that the investor has to put into the project to get it started. This has several components: ISBL OSBL E&C WC Contingency • To allow for the unexpected ? 14
  • 15.
    ISBL Costs • DirectField Costs • Major equipment • Furnaces, heat exchangers, coolers • Vessels, reactors, columns, tanks • Pumps, drivers, compressors, fans, turbines • Refrigerators, driers, centrifuges • Bulk items • Electrics, instrumentation, computer control • Piping, valves • Structures, insulation, paint • Lube oils, solvents, catalysts • Civil works • Roads, foundations • Piling, buildings • Installation labor & supervision • Indirect Field Costs • Construction costs • Construction equipment • Temporary construction • Temporary power and water • Construction workshops • Field expenses & services • Field canteen • Specialists costs • Overtime, adverse weather • Construction insurance • Labor benefits & burdens 15
  • 16.
    Home Office Costs Engineering Procurement Constructionservices Construction supervision Project management Expenses Bonding Contractor’s fee These costs should be estimated individually as they do not scale that well with project size, but a rule of thumb is 10 – 30% of ISBL investment 16
  • 17.
    Working Capital • Workingcapital (WC) is the money you need to get the plant running • Buy feedstock's, pay bills, etc., until product is sold & revenue begins • More sophisticated methods break out WC in terms of operating costs, e.g. in terms of • Days of RM storage • Days of product storage • Days accounts receivable less accounts payable • Inventories held (e.g. warehouse parts) • Cash on hand • WC Total amount of money invested in (a) raw materials and supplies carried in stock (b) Finished products in stock and semi finished products in process (c) accounts receivable (d) Cash kept for monthly expenses such as salaries, wages etc. (e) Account payable (f) Taxes payable The WC for most chemical companies varies from 10 to 20 of TCI 17
  • 18.
    Contingency • Contingency chargesallow for variation from the predicted cost estimate • Variation can be caused by • Scope change • Change in economic scenario • Currency fluctuations • Labor disputes, weather problems, subcontractor problems • Validity of cost estimate and vendor quotes • Contingency should be at least 10% of ISBL, & can be up to 50% if the process technology is uncertain: more about this later 18
  • 19.
    Types of capitalCost Estimate Project Cycle Design Concept Start-up Construction Procurement Detailed Design • As the project proceeds, costs accumulate and the overall cost estimate becomes more certain Low High Cost 19
  • 20.
    Project Cycle Design Concept Start-up Construction Procurement Detailed Design • Atthe same time, the influence of design decisions on project costs decreases Low High Cost Design Influence 20
  • 21.
    Type of CapitalCost Estimate- Project Cycle Design Concept Construction Procurement Detailed Design • An order of magnitude estimate (“ballpark estimate”, “guesstimate”, “Class 5 estimate”) requires minimal design information • Usually based on the costs of similar processes • Cost of producing the estimate is < 0.1% of project costs • Accuracy of estimate over: ±30% Accuracy ± % 50 40 30 20 10 0 Order of Magnitude The terminology is taken from the Association for the Advancement of Cost Estimating International, AACEI 21
  • 22.
    Type of CapitalCost Estimate- Project Cycle Design Concept Construction Procurement Detailed Design • A study (“factorial”, “preliminary”, “Class 4”) estimate requires a flowsheet and the approximate size and duty of the major plant equipment • The estimate is based on applying installation factors to main plant item costs • The cost of producing the estimate is usually 0.1 to 0.2% of project costs • Accuracy of estimate up to : ±30% only Accuracy ± % 50 40 30 20 10 0 Order of Magnitude Study Estimate 22
  • 23.
    Type of CapitalCost Estimate- Project Cycle Design Concept Construction Procurement Detailed Design • The definitive estimate (“authorization”, “budgeting”, “Class 3”) estimate can be put together once the PFD, P&ID and equipment list are completed, all vessels and instruments are sized and a plot plan and plant layout has been developed • The cost is typically 0.4 to 0.8% of project cost • Accuracy of estimate within: ±10% Accuracy ± % 50 40 30 20 10 0 Order of Magnitude Study Estimate Definitive Estimate 23
  • 24.
    Type of CapitalCost Estimate- Project Cycle Design Concept Construction Procurement Detailed Design • The detailed estimate (“quotation”, “tender”, “contractor’s estimate”, “Class 2 estimate”) is prepared by the contractor and is often in shopping list form, usually with a firm commitment to the client. It incorporates price information from initial discussions with vendors and usually requires some mechanical design work • From 1 to 3% of project cost goes into preparing this estimate Accuracy ± % 50 40 30 20 10 0 Order of Magnitude Study Estimate Detailed Estimate Definitive Estimate 24
  • 25.
    Type of CapitalCost Estimate- Project Cycle Design Concept Construction Procurement Detailed Design • The cost of this estimate can be up to 5% of total project cost, particularly if most of the engineering design has been completed Accuracy ± % 50 40 30 20 10 0 Order of Magnitude Study Estimate Check Estimate Detailed Estimate Definitive Estimate 25
  • 26.
    Type of CapitalCost Estimate- Project Cycle Design Concept Construction Procurement Detailed Design • ChE design courses usually only have enough detail to get this far Accuracy ± % 50 40 30 20 10 0 Order of Magnitude Study Estimate Check Estimate Detailed Estimate Definitive Estimate 26
  • 27.
    Exponential Estimating • Thecost of most plant items varies with the equipment size in a non-linear manner: Size Cost Log[Size] Log[Cost] • By taking logs, we can usually get a reasonably good correlation over a few orders of magnitude • The exponent n is 0.6 for many types of equipment, hence this is often known as the “Six- tenths rule” n B Size A Size B Cost A Cost          27 n a a KA C  b n b C K A 
  • 28.
    Exponential Estimating • Sincethe plant cost is built up from the sum of the equipment costs: • It follows that we should be able to approximately scale the total plant cost using the same six-tenths rule    N 1 i i equip Plant C C 0.6 B Size A Size B Cost A Cost          28 Equation for Time Effect          1 2 1 2 I I C C C = Cost I = Value of cost index 1,2 = Represents points in time at which costs required or known and index values known
  • 29.
    Exponents for DifferentProcesses In practice, the 0.6 factor does not apply to all equipment or all types of process: • Most petrochemical processes are better fitted with exponent 0.7 • Processes with a lot of gas compression or mechanical work have exponents 0.8 to 0.9 (e.g. MeOH, paper pulping) • Small scale, highly-instrumented processes have lower exponents 0.4 to 0.5 29
  • 30.
    Example • A 40,000bbl/d hydrotreater costs 56 MM$. How much would a 30,000 bbl/d hydrotreater cost at the same location? MM$ 47 40 30 56 Cost B size A size B Cost A Cost 0.6 0.6                   30
  • 31.
    Estimating Plant Costfor Manufactured Products • For large scale mass manufacture (>0.5 MM pieces/y) a rule of thumb is Total cost of production = 2 x materials cost • This allows a very approximate estimate of plant cost if other fixed costs and utilities can be estimated • More detailed methods allow for number of components, number of assembly steps and complexity of assembly 31
  • 32.
    Estimating the EquipmentCost Project Cycle Design Concept Construction Procurement Detailed Design These estimates usually start with an estimate of the cost for each major piece of plant equipment Accuracy ± % 50 40 30 20 10 0 Order of Magnitude Study Estimate Check Estimate Detailed Estimate Definitive Estimate 32
  • 33.
    Sources of EquipmentCosts Design Concept Construction Procurement Detailed Design Accuracy ± % 50 40 30 20 10 0 Order of Magnitude Study Estimate Cost curves, exponent based Detailed design Vendor quotes Check Estimate Detailed Estimate Definitive Estimate 33
  • 34.
    Equipment Cost Correlations •The ChE literature has an abundance of cost correlations • Many of these are updates or derivatives of the work of Guthrie, and have to be used with some caution • The IChemE and ACostE publish an excellent (& very cheap) guide to capital cost estimating with recent cost correlations, but these need to be converted from U.K. to U.S. basis. • Many cost engineers collect data and keep their own correlations • Best practice in industry is to use costing software (see later) • Correlations given in Ch7 can be used as a first approximation if no software is available. Note: these are not based on Guthrie’s work Guthrie, K.M. Capital Cost Estimating, Chem. Eng., 76(6), 114, 1969 Guthrie, K.M. Process Plant Estimating, Evaluation and Control, Craftsman Book Co., Solana Beach, CA, 1974 Gerrard, A.M. Guide to Capital Cost Estimating, 4th Edn., Institute of Chemical Engineers, Rugby, U.K., 2000 e.g. Perry’s Handbook, other design textbooks 34
  • 35.
    Cost of Installation FactorialEstimates • In addition to the purchased cost of the equipment itself, we need to consider the costs of: • Installing the equipment • Piping, ducting, etc. • Instrumentation and control • Electrical systems • Civil engineering work such as foundations & piling • Structures and buildings • Insulation, paint and fireproofing • Foundations and structures • For preliminary and study estimates these are estimated by multiplying the main plant item cost by an installation factor (or Lang factor) Cinstalled = Cequipment x F 35
  • 36.
    Installation Factors • Langoriginally proposed three installation factors, depending on plant type, roughly 4.0 • Simple methods allow for variation of F by equipment type (e.g., the factors proposed by Hand): • More complex methods build up F from component factors Equipment Type F Compressors 2.5 Distillation columns 4 Furnaces 2 Heat exchangers 3.5 Instruments 4 Miscellaneous equipment 2.5 Pressure vessels 4 Pumps 4 Lang, H.J. Simplified approach to preliminary cost estimates. Chem. Eng., 55(6), 112, 1948 Hand, W.E. From flow sheet to cost estimate. Petrol. Refiner, 37(9), 331, 1958 36
  • 37.
    Installation Factor F =(1 + fp)fm + fer + fi + fel + fc + fs + fl Where: • fp is the piping installation factor • fm is the material cost factor • fer is the site erection installation factor • fi is the instrumentation installation factor • fel is the electrical installation factor • fc is the civil installation factor • fs is the structure & buildings installation factor • fl is the lagging, paint and fireproof installation factor • All of these factors (except fm) vary with installation complexity and equipment cost • Note that the factors are standardized on a plain carbon steel basis 37
  • 38.
    Installation Factor • Gerrard& Perry’s Handbook give detailed methods for estimating component installation factors • Typical behavior of installation factors is: • Overall installation factor is almost always 2 < F < 6 • Estimation of F is easy to code in spreadsheets & is effectively built into commercial estimating software Cequipment F Increasing complexity of installation 38
  • 39.
    Materials Cost Factors,fm • Express costs relative to plain carbon steel • Carbon steel 1.0 • Aluminum & bronze 1.07 • Cast steel 1.1 • 304 stainless steel 1.3 • 316 stainless steel 1.3 • 321 stainless steel 1.5 • Hastelloy C 1.55 • Monel 1.65 • Nickel & inconel 1.7 • Materials selection makes a huge difference to capital cost: see Chapter 6 for factors to consider 39
  • 40.
    Cost of Equipment& Exponents for Equipment • Equipment costs can be scaled from similar equipment of different size using the same exponent rule: • Exponents vary with equipment type: n B Size A Size B Cost A Cost          Equipment Type Scale Parameter Exponent Blower Flowrate 0.6 Centrifugal pump Power 0.67 Centrifuge Filter area 0.65 Compressor, reciprocating Power 0.85 Dryer, drum Area 0.52 Heat exchanger, DEL Area 0.59 Motor Power 0.77 Pressure vessel Volume 0.62 Tower Flowrate 1 (Holland, F.A., Watson, F.A. & Wilkinson, J.K., 1984, in Perry’s Handbook, 6th Edn., McGraw Hill, New York) 40
  • 41.
    Updating the CostEstimate Cost Estimate Basis • Most cost data is published on a “standard basis” of USGC or NWE • Historically the major locations of the chemical industry • Standard basis allows quick comparison with other data, studies • Cost information should also always state the cost year basis, e.g. $2004, ₤2000, €2002, etc. • For a new project we therefore have to update the cost basis to reflect the correct location, local currency and current (or projected) time frame • This is done by applying indices:                    A Index Location B Index Location 2000 Index Cost 20XX Index Cost A Location $ Cost B Location $ Cost 2000 20XX 41 Cost index – general estimate
  • 42.
    U.S.A. Cost Indices •Engineering News Record (ENR) Construction Index • Mainly for civil engineering work • Not really suitable for process industries, but has been going since 1904 • Chemical Engineering (CE) Plant Cost Index • Published monthly in Chemical Engineering magazine • Multi-component index, but Chem. Eng. also has equipment indices • Marshall & Swift (M&S) Equipment Cost Index • Also published monthly in Chemical Engineering • Composite from several industries (including cement, chemicals, glass, …) • Nelson-Farrer Refinery Construction Index • Published monthly in Oil & Gas Journal • Applies to refinery & petrochemical plants on USGC • OGJ also publishes quarterly indices for 40 equipment types 42
  • 43.
    Comparison of U.S.A.Cost Indices 0 500 1000 1500 2000 2500 1985 1990 1995 2000 2005 2010 Year Index Value NF CE MS 0.8 1 1.2 1.4 1.6 1.8 2 1985 1990 1995 2000 2005 2010 Year Index Relative to 1990 NF CE MS 43
  • 44.
    Location Factors • Locationfactor captures differences in local costs of labor, import duties, fabrication and installation infrastructure, etc. • Location factors are a function of time & are trending closer to 1.0 as a result of globalization • Most sites have a good idea of their own location factor relative to USGC or NWE Country Region Location factor United States Gulf coast 1.00 East coast 1.04 West Coast 1.07 Midwest 1.02 Canada Ontario 1.00 Fort McMurray 1.60 Mexico 1.03 Brazil 1.14 China imported 1.12 indigenous 0.61 Japan 1.26 SE Asia 1.12 Australia 1.21 India 1.02 Middle East 1.07 France 1.13 Germany 1.11 Italy 1.14 Netherlands 1.19 Russia 1.53 United Kingdom 1.02 44
  • 45.
    Methods of estimatingcapital investment • Method A Detailed item estimate(Considering all individual items) • Method B Unit cost estimate • Method C Percentage delivered equipment cost • Method D Lang factors for approximation of capital investment • Method E Power factor applied to plant/capacity ratio • Method F Investment cost per unit of capacity • Method G Turnover ratio 45
  • 46.
    Method B Unitcost estimate •used to estimate preliminary and definitive estimate 46 Method C Percentage delivered equipment cost Method D Lang factors for approximation of capital investment Method E Power factor Method Capacity power factor for various process plants R – Ratio(new to old), C-capacity old facility x- 0.6to 0.7 , fe- cost index ratio f-lumped cast factor Cn= CfeRx
  • 47.
    Computer Tools forCost Estimation Aspen ICARUS Process Evaluator™ (IPE) • Allows import of simulation data from Aspen Plus®, HYSYS®, UniSim, Pro II, ChemCAD • Makes expert system assumptions for bulks, installation, indirect costs & home office costs • Provides a relatively quick, defensible cost estimate with common basis of assumptions • Easy to update as design detail is added 47
  • 48.
    Precision & Contingency •Contingency is strictly a cost added by the contractor to allow for uncertainty in the estimate Cost Probability Mean (most likely) value Contractor’s estimate • Contingency should be set to give a desired probability (statistical confidence) that the project will come in under the quoted cost • Higher uncertainty requires more contingency, hence “Me third!” for new technology • See Ch7 for more details 48
  • 49.
    Cost Engineering Resources •References cited above • Association for the Advancement of Cost Engineering (AACE) International www.aacei.org • Project Management Institute www.pmi.org • U.K. Association of Cost Engineers (ACostE) www.acoste.org.uk • International Cost Engineering Council (ICEC) www.icoste.org (has listings to Cost Engineering societies in 46 countries) 49 M.S. Peters, K.D. Timmerhaus, R.E. West, “Plant Design and Economics for Chemical Engineers” 5th edition, McGraw-Hill, 2003 R. Turton, R.C. Baillie, W.B. Whiting, J.A. Shaeiwitz, “Analysis, Synthesis, and Design of Chemical Processes.” 2nd edition, 2003.