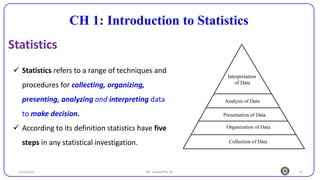
1
Statistical Applications in Textile Engineering
TEng5231
CH - 1: Class - 1
Introduction to Statistics
25/10/2023 By: Leweyehu Sh.
Note: Do your assignments on Time and
honestly
Switch off or keep your
phone in Silent mode Keep time
Ask and Answer
Questions in Class
Should do well in
this class
Enjoy this courseand
have fun
4. 5. 6.
2 3
1
Norms of the classroom
25/10/2023 By: Leweyehu Sh. 2
25/10/2023 By: Leweyehu Sh. 3
Before any type of study textile engineers generally have following questions.
1. How many tests are to be carried out for getting the desired results?
2. How to analyze the results or the data collected for the purpose of the study?
3. How to interpret the results of analysis?
Answers to these questions can be obtained with the help of the subject ‘Statistics’
4
CH 1: Introduction to Statistics
Statistics
25/10/2023 By: Leweyehu Sh.
✓ Statistics refers to a range of techniques and
procedures for collecting, organizing,
presenting, analyzing and interpreting data
to make decision.
✓ According to its definition statistics have five
steps in any statistical investigation.
5
1. Data Collection
25/10/2023 By: Leweyehu Sh.
 The process of gathering and
recording information or
observations from various sources to
analyze and interpret it.
 The process of obtaining
measurements or counts.
 Data development
Comparison Primary Data Secondary Data
Meaning The firsthand data gathered by
the researcher himself.
Data collected by someone else earlier.
Data time Real time data Past data
Process Very involved Quick and easy
Source Survey, observations,
expérimentes, questionnaire,
personal interview, etc.
Government publications, websites,
books, journal articles, internal records
etc.
Cost effectiveness Expensive Economical
Collection time Long Short
Specific Always specific to the
researcher's needs.
May or may not be specific to the
researcher's need.
Available in Crude form Refined form
Accuracy and
Reliability
More Relatively less
10/25/2023 Leweye Sh. 6
7
25/10/2023 By: Leweyehu Sh.
 It involves transforming raw data into a
format that is more manageable,
accessible, and conducive to extracting
meaningful insights.
 Includes editing, classifying, and
tabulating the data collected.
2. Data Organization
 It refers to the process of arranging collected data in a structured and orderly manner
to facilitate analysis and interpretation
8
3. Data Presentation
25/10/2023 By: Leweyehu Sh.
 The purpose of data presentation is to
facilitate the understanding,
interpretation, and communication of
information contained within the data.
 Can be done in the form of tables,
graphs or diagrams.
 It refers to the process of visually or numerically representing data clearly and concisely.
9
4. Analysis of data
25/10/2023 By: Leweyehu Sh.
 To dig out useful information for
decision making
 It involves extracting relevant
information from the data (like mean,
median, mode, range, variance…),
10
5. Interpretation of data
25/10/2023 By: Leweyehu Sh.
 Concerned with drawing conclusions from the data collected and analyzed; and
giving meaning to analysis results.
11
Fields of statistics
25/10/2023 By: Leweyehu Sh.
1. Descriptive statistics
 A statistical method that is
concerned with the collection,
organization, summarization, and
analysis of data from a sample of
population.
2. Inferential statistics
 A statistical method that is
concerned with the drawing
conclusions/ inferring about a
particular population by
selecting and measuring a
random sample from the
population.
Variable & attribute
 The qualitative type characteristic, which changes from individual to individual is
called as an attribute.
 Example : external appearance of the fabric or the choice of color of the
garment etc.
 The quantitative type characteristic, whose value changes from individual to
individual, is called as the variable.
 Example: the variables may be staple length of the fiber or the count of the
yarn or the strength of the fabric etc.
10/25/2023 Leweye Sh. 12
13
Types of data
 Data refers to the information or observations that are collected or measured for
analysis. There are several types of data that are commonly used in statistical analysis.
25/10/2023 By: Leweyehu Sh.
1. Categorical data (qualitative)
➢ Non-numeric variables and
can't be measured.
✓ Examples: luster of the fabric,
the color, the brightness of the
garment.
2.Numerical data (quantitative)
➢ Numerical variables and can be measured.
▪ Discrete: (Assuming only count values)
▪ Continuous: which can assume any
value within a specific range.
14
a. Discrete Data
• Are variables which assume a finite or countable number of possible values.
• Usually obtained by counting.
Examples:
• Number of defective needles in a pack of 10 needles
• The number of defective garments in a sample of 10 garments
• The number of accidents in a textile mill during a month etc.
25/10/2023 By: Leweyehu Sh.
15
b. Continuous Data
• Are variables which assume an infinite number of possible Values between any two
specific values
• Are usually obtained by measurement.
Examples:
• The staple length of the fiber
• The count of the yarn
• The strength of the fabric etc.
25/10/2023 By: Leweyehu Sh.
16
3. Nominal data
➢ Only naming and classifying observations is possible. When numbers are
assigned to categories, it is only for coding purposes, and it does not provide a
sense of size.
Example: Gender of a person (M, F), eye color (e.g., brown, blue), religion (Christian,
Muslim), place of residence (urban, rural) etc.
25/10/2023 By: Leweyehu Sh.
17
4. Ordinal data
➢Categorization and ranking (ordering) observations is possible.
➢We can talk of greater than or less than and it conveys meaning to the value but;
➢Impossible to express the real difference between measurements in numerical
terms.
Examples: Socio-economic status (very low, low, medium, high, very high), severity(mild,
moderate, sever), blood pressure (very low, low, high, very high etc.
25/10/2023 By: Leweyehu Sh.
18
Individual, Sample, and Population
25/10/2023 By: Leweyehu Sh.
 Individual : it refers to a single unit or
object that is being studied or observed.
 Sample: A sample is a subset of population
selected from a larger population.
 Population: A population refers to the entire
group of individuals or objects that we are
interested in studying.
19
25/10/2023 By: Leweyehu Sh.
Types of
samples
20
1. Simple Random Sampling
25/10/2023 By: Leweyehu Sh.
• In a simple random sample, every member of
the population has an equal chance of being
selected.
• To conduct this type of sampling, we can use
tools like random number generators or other
techniques that are based entirely on chance.
• Often used when the population is relatively
small and easily accessible
21
2. Systematic sampling
25/10/2023 By: Leweyehu Sh.
• Systematic sampling is similar to simple
random sampling, but it is usually slightly
easier to conduct.
• Every member of the population is listed
with a number, but instead of randomly
generating numbers, individuals are chosen
at regular intervals
• interval = Τ
𝑝𝑜𝑝𝑢𝑙𝑎𝑡𝑖𝑜𝑛 𝑠𝑎𝑚𝑝𝑙𝑒
22
3. Stratified sampling
25/10/2023 By: Leweyehu Sh.
• Stratified sampling involves dividing the population into
subpopulations that may differ in important ways.
• It allows you draw more precise conclusions by ensuring that
every subgroup is properly represented in the sample.
• Based on the overall proportions of the population, we
calculate how many people should be sampled from each
subgroup.
𝑛𝑖 =
𝑁𝑖
𝑁
∗ n
• Then we use random or systematic sampling to select a sample
from each subgroup.
23
4. Cluster sampling
25/10/2023 By: Leweyehu Sh.
• Cluster sampling also involves dividing the population into
subgroups, but each subgroup should have similar
characteristics to the whole sample. Instead of sampling
individuals from each subgroup, we randomly select entire
subgroups.
• This method is good for dealing with large and dispersed
populations, but there is more risk of error in the sample,
as there could be substantial differences between clusters.
• It’s difficult to guarantee that the sampled clusters are
really representative of the whole population
24
Governing Factors for sampling Methods from textile point of view
▪ Types of the material
▪ Amount of Material available
▪ Nature of the tests
▪ Type of testing instrument
▪ Information required
▪ Degree of accuracy required
Q. In which of the textile material (natural or manufactured ) should we take a greater
number of samples from 100 bales to check its strength? Why?
25/10/2023 By: Leweyehu Sh.
25
Quiz 1
1. What is the application of statistics in the field of textile
engineering? Explain in detail
25/10/2023 By: Leweyehu Sh.
26
Thank you!!!
10/25/2023 BY: Leweye S.

CH- 1 class -1- Introduction to statistics.pdf

  • 1.
    1 Statistical Applications inTextile Engineering TEng5231 CH - 1: Class - 1 Introduction to Statistics 25/10/2023 By: Leweyehu Sh.
  • 2.
    Note: Do yourassignments on Time and honestly Switch off or keep your phone in Silent mode Keep time Ask and Answer Questions in Class Should do well in this class Enjoy this courseand have fun 4. 5. 6. 2 3 1 Norms of the classroom 25/10/2023 By: Leweyehu Sh. 2
  • 3.
    25/10/2023 By: LeweyehuSh. 3 Before any type of study textile engineers generally have following questions. 1. How many tests are to be carried out for getting the desired results? 2. How to analyze the results or the data collected for the purpose of the study? 3. How to interpret the results of analysis? Answers to these questions can be obtained with the help of the subject ‘Statistics’
  • 4.
    4 CH 1: Introductionto Statistics Statistics 25/10/2023 By: Leweyehu Sh. ✓ Statistics refers to a range of techniques and procedures for collecting, organizing, presenting, analyzing and interpreting data to make decision. ✓ According to its definition statistics have five steps in any statistical investigation.
  • 5.
    5 1. Data Collection 25/10/2023By: Leweyehu Sh.  The process of gathering and recording information or observations from various sources to analyze and interpret it.  The process of obtaining measurements or counts.  Data development
  • 6.
    Comparison Primary DataSecondary Data Meaning The firsthand data gathered by the researcher himself. Data collected by someone else earlier. Data time Real time data Past data Process Very involved Quick and easy Source Survey, observations, expérimentes, questionnaire, personal interview, etc. Government publications, websites, books, journal articles, internal records etc. Cost effectiveness Expensive Economical Collection time Long Short Specific Always specific to the researcher's needs. May or may not be specific to the researcher's need. Available in Crude form Refined form Accuracy and Reliability More Relatively less 10/25/2023 Leweye Sh. 6
  • 7.
    7 25/10/2023 By: LeweyehuSh.  It involves transforming raw data into a format that is more manageable, accessible, and conducive to extracting meaningful insights.  Includes editing, classifying, and tabulating the data collected. 2. Data Organization  It refers to the process of arranging collected data in a structured and orderly manner to facilitate analysis and interpretation
  • 8.
    8 3. Data Presentation 25/10/2023By: Leweyehu Sh.  The purpose of data presentation is to facilitate the understanding, interpretation, and communication of information contained within the data.  Can be done in the form of tables, graphs or diagrams.  It refers to the process of visually or numerically representing data clearly and concisely.
  • 9.
    9 4. Analysis ofdata 25/10/2023 By: Leweyehu Sh.  To dig out useful information for decision making  It involves extracting relevant information from the data (like mean, median, mode, range, variance…),
  • 10.
    10 5. Interpretation ofdata 25/10/2023 By: Leweyehu Sh.  Concerned with drawing conclusions from the data collected and analyzed; and giving meaning to analysis results.
  • 11.
    11 Fields of statistics 25/10/2023By: Leweyehu Sh. 1. Descriptive statistics  A statistical method that is concerned with the collection, organization, summarization, and analysis of data from a sample of population. 2. Inferential statistics  A statistical method that is concerned with the drawing conclusions/ inferring about a particular population by selecting and measuring a random sample from the population.
  • 12.
    Variable & attribute The qualitative type characteristic, which changes from individual to individual is called as an attribute.  Example : external appearance of the fabric or the choice of color of the garment etc.  The quantitative type characteristic, whose value changes from individual to individual, is called as the variable.  Example: the variables may be staple length of the fiber or the count of the yarn or the strength of the fabric etc. 10/25/2023 Leweye Sh. 12
  • 13.
    13 Types of data Data refers to the information or observations that are collected or measured for analysis. There are several types of data that are commonly used in statistical analysis. 25/10/2023 By: Leweyehu Sh. 1. Categorical data (qualitative) ➢ Non-numeric variables and can't be measured. ✓ Examples: luster of the fabric, the color, the brightness of the garment. 2.Numerical data (quantitative) ➢ Numerical variables and can be measured. ▪ Discrete: (Assuming only count values) ▪ Continuous: which can assume any value within a specific range.
  • 14.
    14 a. Discrete Data •Are variables which assume a finite or countable number of possible values. • Usually obtained by counting. Examples: • Number of defective needles in a pack of 10 needles • The number of defective garments in a sample of 10 garments • The number of accidents in a textile mill during a month etc. 25/10/2023 By: Leweyehu Sh.
  • 15.
    15 b. Continuous Data •Are variables which assume an infinite number of possible Values between any two specific values • Are usually obtained by measurement. Examples: • The staple length of the fiber • The count of the yarn • The strength of the fabric etc. 25/10/2023 By: Leweyehu Sh.
  • 16.
    16 3. Nominal data ➢Only naming and classifying observations is possible. When numbers are assigned to categories, it is only for coding purposes, and it does not provide a sense of size. Example: Gender of a person (M, F), eye color (e.g., brown, blue), religion (Christian, Muslim), place of residence (urban, rural) etc. 25/10/2023 By: Leweyehu Sh.
  • 17.
    17 4. Ordinal data ➢Categorizationand ranking (ordering) observations is possible. ➢We can talk of greater than or less than and it conveys meaning to the value but; ➢Impossible to express the real difference between measurements in numerical terms. Examples: Socio-economic status (very low, low, medium, high, very high), severity(mild, moderate, sever), blood pressure (very low, low, high, very high etc. 25/10/2023 By: Leweyehu Sh.
  • 18.
    18 Individual, Sample, andPopulation 25/10/2023 By: Leweyehu Sh.  Individual : it refers to a single unit or object that is being studied or observed.  Sample: A sample is a subset of population selected from a larger population.  Population: A population refers to the entire group of individuals or objects that we are interested in studying.
  • 19.
    19 25/10/2023 By: LeweyehuSh. Types of samples
  • 20.
    20 1. Simple RandomSampling 25/10/2023 By: Leweyehu Sh. • In a simple random sample, every member of the population has an equal chance of being selected. • To conduct this type of sampling, we can use tools like random number generators or other techniques that are based entirely on chance. • Often used when the population is relatively small and easily accessible
  • 21.
    21 2. Systematic sampling 25/10/2023By: Leweyehu Sh. • Systematic sampling is similar to simple random sampling, but it is usually slightly easier to conduct. • Every member of the population is listed with a number, but instead of randomly generating numbers, individuals are chosen at regular intervals • interval = Τ 𝑝𝑜𝑝𝑢𝑙𝑎𝑡𝑖𝑜𝑛 𝑠𝑎𝑚𝑝𝑙𝑒
  • 22.
    22 3. Stratified sampling 25/10/2023By: Leweyehu Sh. • Stratified sampling involves dividing the population into subpopulations that may differ in important ways. • It allows you draw more precise conclusions by ensuring that every subgroup is properly represented in the sample. • Based on the overall proportions of the population, we calculate how many people should be sampled from each subgroup. 𝑛𝑖 = 𝑁𝑖 𝑁 ∗ n • Then we use random or systematic sampling to select a sample from each subgroup.
  • 23.
    23 4. Cluster sampling 25/10/2023By: Leweyehu Sh. • Cluster sampling also involves dividing the population into subgroups, but each subgroup should have similar characteristics to the whole sample. Instead of sampling individuals from each subgroup, we randomly select entire subgroups. • This method is good for dealing with large and dispersed populations, but there is more risk of error in the sample, as there could be substantial differences between clusters. • It’s difficult to guarantee that the sampled clusters are really representative of the whole population
  • 24.
    24 Governing Factors forsampling Methods from textile point of view ▪ Types of the material ▪ Amount of Material available ▪ Nature of the tests ▪ Type of testing instrument ▪ Information required ▪ Degree of accuracy required Q. In which of the textile material (natural or manufactured ) should we take a greater number of samples from 100 bales to check its strength? Why? 25/10/2023 By: Leweyehu Sh.
  • 25.
    25 Quiz 1 1. Whatis the application of statistics in the field of textile engineering? Explain in detail 25/10/2023 By: Leweyehu Sh.
  • 26.